

Paper Menu >>
Journal Menu >>
 Open Journal of Radiology, 2013, 3, 124-129 http://dx.doi.org/10.4236/ojrad.2013.33020 Published Online September 2013 (http://www.scirp.org/journal/ojrad) Three-Dimensional Rotational Angiography in Congenital Heart Disease: Estimation of Radiation Exposure Gloria Reinke1, Julia Halbfaß1, Sven Dittrich1, Rosemarie Banckwitz2, Christoph Köhler2, Stephan Achenbach3, Oliver Rompel4, Martin Glöckler1* 1Department of Pediatric Cardiology, University Hospital Erlangen, Erlangen, Germany 2Siemens Medical Solutions, Forchheim, Germany 3Department of Cardiology, University Hospital Erlangen, Erlangen, Germany 4Division of Pediatric Radiology, Department of Radiology, University Hospital Erlangen, Erlangen, Germany Email: *[email protected] Received June 1, 2013; revised July 1, 2013; accepted July 9, 2013 Copyright © 2013 Gloria Reinke et al. This is an open access article distributed under the Creative Commons Attribution License, which permits unrestricted use, distribution, and reproduction in any medium, provided the original work is properly cited. ABSTRACT Objectives: There is an increasing use of three-dimensional rotational angiography (3D-RA) during catheterization of congenital heart disease. Dose-area-product (DAP) measured by the angiography system and computed-tomography dose index (CTDI) do not appear practical for dose assessment. Hence, we performed real dose measurements in an- thropomorphic phantoms. Methods: Three different anthropomorphic phantoms (10 kg, 19 kg and 73 kg bodyweight) equipped with thermoluminescent dosimeters (TLD) were used. We used a typical standard diagnostic program and a low-dose program. The effective dose (ED) was calculated according to the International Commission on Radiological Protection (ICRP) 103. The 3D distribution of radiation in the body was assessed. Results: ED for the male 10 kg phantom was 0.192 mSv in the diagnostic program and 0.050 mSv (male) in the low-dose program. The 19 kg phantom received an ED of 0.205 mSv (male) in the diagnostic program. In the low-dose program the ED reached 0.058 mSv (male). The male adult 73 kg phantom was exposed with an ED of 0.730 mSv in the diagnostic program and 0.282 mSv in the low-dose program. ED for the female phantoms was slightly higher for both acquisition-programs. Dose distribu- tion was inhomogeneous with a dose maximum in the esophageal region behind the heart, whereas in the brain, intes- tine and gonads we found nearly no radiation. Conclusions: 3D-RA imaging in the interventional catheter laboratory is possible with an effective dose lower than 1 mSv. With its potential to reduce fluoroscopic time and the number of con- trol angiographies in catheterization and intervention in complex anatomy, it can decrease the radiation dose. Keywords: Effective Dose; Radiation Exposure; Anthropomorphic Phantom; Rotational Angiography 1. Introduction The emerging technique of three-dimensional rotational angiography (3D-RA) in congenital heart disease has a high impact on the workflow of pediatric cardiologists. The 3D-RA is a flat-detector computer tomography (FD- CT) with continuous contrast admission in the volume of interest (VOI) during a typical acquisition time of 5 sec. The flat-detector is mounted on the c-arm of the angio- graphy-system and moves once over 180˚ plus fan angle around the patient. It provides accurate diagnostic infor- mation exceeding conventional biplane angiography. The main advantages of this new imaging modality include the unlimited views on the high resolution three dimen- sional (3D) vascular models for surgical planning and the use of 3D models in interventions. These 3D models can be used for 3D navigation in catheter interventions. There- fore, models from high resolution 3D-RA as well as im- ages from former magnetic resonance imaging (MRI) or computed tomography (CT) studies are acquired. MRI and CT images can be implemented by merging them with an actual low-dose 3D-RA dataset [1-4]. Image acquisition for 3D-RA is performed by a single run of the c-arm equipped with a flat detector around the patient. These FD-CT scanners provide an irradiation field in cranio-caudal z-direction of typically up to 200 mm. Consequently, resulting radiation doses should be determinable in a reliable way. In standard CT, dosi- metry is based upon the concept of the computed to- mography dose index (CTDI) as a dose descriptor. In its current definition it is characterized by an integration *Corresponding author. C opyright © 2013 SciRes. OJRad  G. REINKE ET AL. 125 length of 100 mm. Therefore CTDI100 is inadequate for dose assessment in wide beam CT-scanners such as C- arm FD-CT [5]. Moreover, these scanners utilize the so-called partial scanning (angular range < 360˚), which is expected to cause inhomogeneous dose distribution within the patient and consequently makes the use of CTDI even more questionable. Kyriakou et al. emphasize that the use of CTDI100 may strongly underestimate pa- tient’s dose acquired during FD-CT examination. As a practical solution they recommend Monte Carlo simula- tion-based radiation dose calculations [5]. On the other hand, dose estimations solely based on the dose-area pro- duct (DAP) also have to be scrutinized critically, be- cause the used conversion factors derive from single in- cidence imaging and have never been validated for FD- CT. This clearly leads to underestimation of dose asses- sment, too [6]. To estimate the organ and the total dose phantom measurements have to be performed in large phantoms with respect to the large z-coverage. Therefore, humanlike anthropomorphic phantoms equipped with multiple thermoluminescent dosimeters (TLD) seem to be a reliable method to estimate the effective dose (ED). 2. Methods In our catheterization laboratory we exposed the phan- toms to a biplane angiography system equipped with two 20 × 20 cm2 flat panel detectors (Axiom Artis, syn- goDynaCT, Siemens Healthcare, Forchheim, Germany). Two different imaging protocols were used: First, a di- agnostic program (5sDRc) with 30 images per second, scanning time 5 sec, a fixed tube voltage of 90 kV and automatically adapted tube current. Second, a low-dose program which is in use for registration of prior high resolution datasets from MRI or CT. The low-dose pro- gram (5sDR-L) also uses 30 images per second and a 5 second-scanning time but 0.2 mm copper filtration and a tube voltage of 70 kV. To achieve enough radiation ex- posure for the TLDs we always exposed the phantom three times with the same program in the same position. Three different anthropomorphic phantoms were exa- mined: 1. A 10 kg model “Clifford” representing children with an age of 0.5 - 3 years. 2. A 19 kg model “Braden” representing children with an age of 3 - 7 years. 3. A 73 kg model “Alderson” representing an adult person. We exposed the Clifford- and the Braden-model se- parately with the two different programs and in addition separately with and without anti scatter grid in the diag- nostic program. The adult Alderson model also under- went both programs, always using the anti-scatter grid. The models are composed of transversal slices with 2.5 cm thickness including drilled holes in which the lithium fluoride TLDs were placed (TLD-100 rods, 1 × 1 × 6 mm; The Harshaw Chemical Company, Chrystal and Electronics Products Department, Solon, Ohio, USA). There are always 3 TLDs for one anatomic structure to get an averaged dose value. For the male gonads we used sachets. Before starting the irradiation the TLDs were cali- brated. The TLDs of one series were always used to- gether for a measuring cycle to guarantee equal quality. Thus, they were irradiated, read and regenerated. There- fore, they were divided in two fractions: fraction 1 was used for the calibration and for the determination of the calibration factor. It was irradiated by a definitive dose of 1Gy. Fraction 2 then underwent the real examination after the calibration factor had been transferred to the TLDs. The readout was performed according to a standard procedure [7]. The organ doses result from the mean value of 3 TLDs. To estimate the organ equivalent dose the di- rectly and indirectly weighted organ dose were added. The effective dose was calculated by summarizing the weighted organ doses according to the guidelines of the International Commission on Radiological Protection (ICRP) 103 [8]. To illustrate the measured organ doses, we created de- lineations with slices in frontal, sagittal and transversal direction. To visualize the amount and the distribution of the organ doses a color scale represented in spectral col- ors was designed with the dimension of 0 mSv to 8.5 mSv. Then the organs and tissues were dyed referring to the dose values on the scale (image editing software GIMP 2.1.11; GNU imaging manipulation program; Free Software Foundation, Boston, MA USA). 3. Results We found an inhomogeneous dose distribution. The highest dose was registered anterior the spine behind the heart, measured by TLDs in the esophagus (Alderson: 8.43 mSv). In all three phantoms the maximal organ dose is located in the thorax (Alderson: esophagus, Braden: left lung, Clifford: right lung). Concerning the head and abdominal region, especially the brain (≤0.06 mSv), the intestine (≤0.04 mSv), the urinary bladder (≤0.01 mSv) and the gonads (≤0.02 mSv), we detected only little ra- diation. No radiation measured by the testis sachets. We noticed higher dose values in the posterior part of the body than in the front (lung, esophagus > thymus, ster- num). There was a slightly higher dose registered on the patient’s left side compared to the right in the Alderson phantom. Figure 1 illustrates the organ doses and their distribution in the phantom bodies. The effective gender-specific dose of the different pro- grams and phantoms are represented in Table 1. De- pending on the acquisition-program, the phantom and Copyright © 2013 SciRes. OJRad 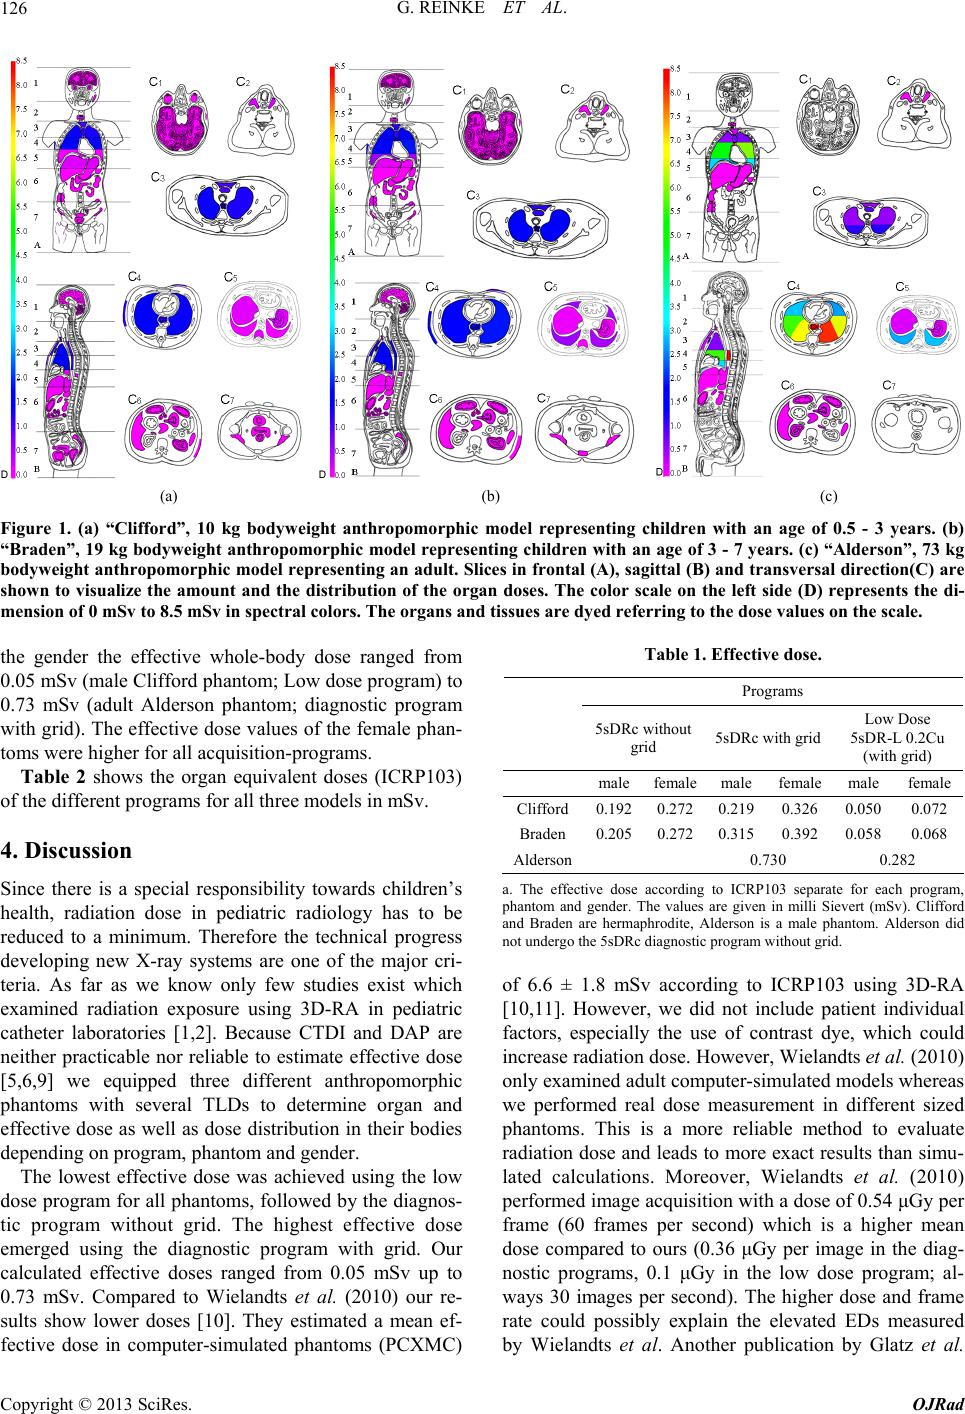 G. REINKE ET AL. Copyright © 2013 SciRes. OJRad 126 (a) (b) (c) Figure 1. (a) “Clifford”, 10 kg bodyweight anthropomorphic model representing children with an age of 0.5 - 3 years. (b) “Braden”, 19 kg bodyweight anthr opomorphic model representing children with an age of 3 - 7 years. (c) “Alderson”, 73 kg bodyweight anthropomorphic model representing an adult. Slices in frontal (A), sagittal (B) and transversal direction(C) are shown to visualize the amount and the distribution of the organ doses. The color scale on the left side (D) represents the di- mension of 0 mSv to 8.5 mSv in spectral colors. The organs and tissues are dyed referring to the dose values on the scale. Table 1. Effective dose. the gender the effective whole-body dose ranged from 0.05 mSv (male Clifford phantom; Low dose program) to 0.73 mSv (adult Alderson phantom; diagnostic program with grid). The effective dose values of the female phan- toms were higher for all acquisition-programs. Programs 5sDRc without grid 5sDRc with grid Low Dose 5sDR-L 0.2Cu (with grid) male femalemale female male female Clifford 0.1920.2720.219 0.326 0.0500.072 Braden 0.2050.2720.315 0.392 0.0580.068 Alderson 0.730 0.282 Table 2 shows the organ equivalent doses (ICRP103) of the different programs for all three models in mSv. 4. Discussion Since there is a special responsibility towards children’s health, radiation dose in pediatric radiology has to be reduced to a minimum. Therefore the technical progress developing new X-ray systems are one of the major cri- teria. As far as we know only few studies exist which examined radiation exposure using 3D-RA in pediatric catheter laboratories [1,2]. Because CTDI and DAP are neither practicable nor reliable to estimate effective dose [5,6,9] we equipped three different anthropomorphic phantoms with several TLDs to determine organ and effective dose as well as dose distribution in their bodies depending on program, phantom and gender. a. The effective dose according to ICRP103 separate for each program, phantom and gender. The values are given in milli Sievert (mSv). Clifford and Braden are hermaphrodite, Alderson is a male phantom. Alderson did not undergo the 5sDRc diagnostic program without grid. of 6.6 ± 1.8 mSv according to ICRP103 using 3D-RA [10,11]. However, we did not include patient individual factors, especially the use of contrast dye, which could increase radiation dose. However, Wielandts et al. (2010) only examined adult computer-simulated models whereas we performed real dose measurement in different sized phantoms. This is a more reliable method to evaluate radiation dose and leads to more exact results than simu- lated calculations. Moreover, Wielandts et al. (2010) performed image acquisition with a dose of 0.54 μGy per frame (60 frames per second) which is a higher mean dose compared to ours (0.36 μGy per image in the diag- nostic programs, 0.1 μGy in the low dose program; al- ways 30 images per second). The higher dose and frame rate could possibly explain the elevated EDs measured y Wielandts et al. Another publication by Glatz et al. The lowest effective dose was achieved using the low dose program for all phantoms, followed by the diagnos- tic program without grid. The highest effective dose emerged using the diagnostic program with grid. Our calculated effective doses ranged from 0.05 mSv up to 0.73 mSv. Compared to Wielandts et al. (2010) our re- sults show lower doses [10]. They estimated a mean ef- fective dose in computer-simulated phantoms (PCXMC) b 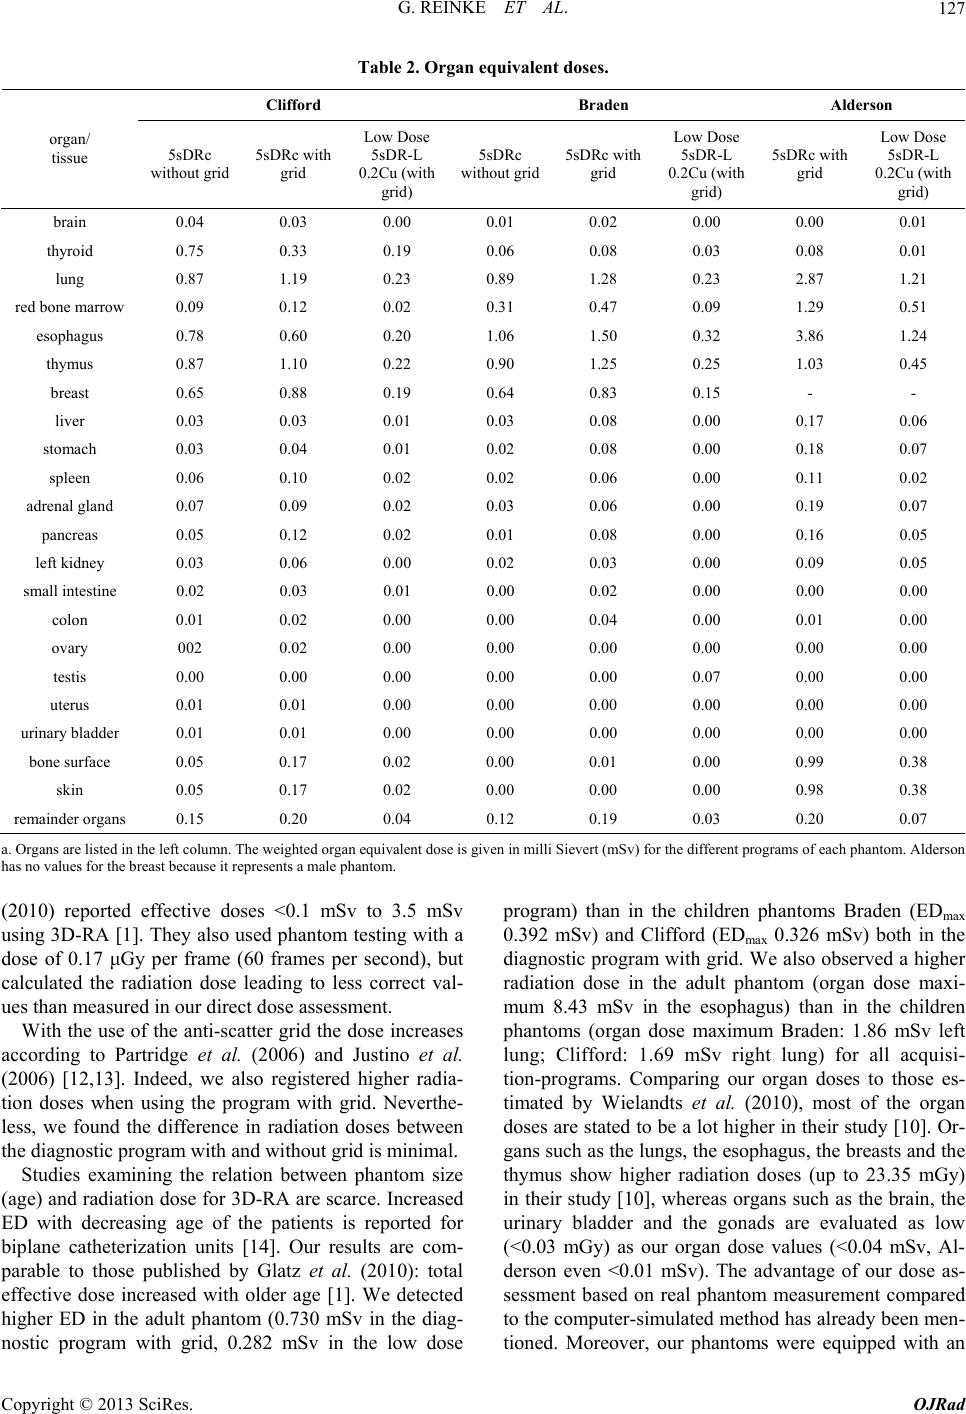 G. REINKE ET AL. 127 Table 2. Organ equivalent doses. Clifford Braden Alderson organ/ 5sDRc without grid 5sDRc with Low Dose 5sDRc without grid 5sDRc with Low Dose 5sDRc with Dose tissue grid 5sDR-L 0.2Cu (with grid) grid 5sDR-L 0.2Cu (with grid) grid Low 5sDR-L 0.2Cu (with grid) brain 0.04 0.03 0.01 0.02 0.00 0.00 0.00 0.01 thyroid 0.75 0.33 0.19 0.06 0.08 0.03 0.08 0.01 lung 0.87 1.19 0.23 0.89 1.28 0.23 2.87 1.21 red bone rrow 0 0. s adrd s urinder remairgans ma0.09 0.12 0.02 0.31 0.47 0.09 1.29 0.51 esophagus 0.78 0.60 0.20 1.06 1.50 0.32 3.86 1.24 thymus 0.87 1.10 0.22 0.90 1.25 0.25 1.03 0.45 breast 0.65 0.88 0.19 0.64 0.83 0.15 - - liver 0.03 0.03 0.01 0.03 0.08 0.00 .1706 tomach0.03 0.04 0.01 0.02 0.08 0.00 0.18 0.07 spleen 0.06 0.10 0.02 0.02 0.06 0.00 0.11 0.02 enal glan0.07 0.09 0.02 0.03 0.06 0.00 0.19 0.07 pancreas 0.05 0.12 0.02 0.01 0.08 0.00 0.16 0.05 left kidney0.03 0.06 0.00 0.02 0.03 0.00 0.09 0.05 mall intestine0.02 0.03 0.01 0.00 0.02 0.00 0.00 0.00 colon 0.01 0.02 0.00 0.00 0.04 0.00 0.01 0.00 ovary 002 0.02 0.00 0.00 0.00 0.00 0.00 0.00 testis 0.00 0.00 0.00 0.00 0.00 0.07 0.00 0.00 uterus 0.01 0.01 0.00 0.00 0.00 0.00 0.00 0.00 ary blad0.01 0.01 0.00 0.00 0.00 0.00 0.00 0.00 bone surface 0.05 0.17 0.02 0.00 0.01 0.00 0.99 0.38 skin 0.05 0.17 0.02 0.00 0.00 0.00 0.98 0.38 nder o0.15 0.20 0.04 0.12 0.19 0.03 0.20 0.07 a.the len. The we organ equt dose is giilli Sievor the rogramch phantomrson .5 mSv program) than in the children phantoms Braden (EDmax Organs are listed in ft columightedivalenven in mert (mSv) fdifferent ps of ea. Alde has no values for the breast because it represents a male phantom. 0) reported effective doses <0.1 mSv to 3(201 using 3D-RA [1]. They also used phantom testing with a dose of 0.17 μGy per frame (60 frames per second), but calculated the radiation dose leading to less correct val- ues than measured in our direct dose assessment. With the use of the anti-scatter grid the dose increases according to Partridge et al. (2006) and Justino et al. (2006) [12,13]. Indeed, we also registered higher radia- tion doses when using the program with grid. Neverthe- less, we found the difference in radiation doses between the diagnostic program with and without grid is minimal. Studies examining the relation between phantom size (age) and radiation dose for 3D-RA are scarce. Increased ED with decreasing age of the patients is reported for biplane catheterization units [14]. Our results are com- parable to those published by Glatz et al. (2010): total effective dose increased with older age [1]. We detected higher ED in the adult phantom (0.730 mSv in the diag- nostic program with grid, 0.282 mSv in the low dose 0.392 mSv) and Clifford (EDmax 0.326 mSv) both in the diagnostic program with grid. We also observed a higher radiation dose in the adult phantom (organ dose maxi- mum 8.43 mSv in the esophagus) than in the children phantoms (organ dose maximum Braden: 1.86 mSv left lung; Clifford: 1.69 mSv right lung) for all acquisi- tion-programs. Comparing our organ doses to those es- timated by Wielandts et al. (2010), most of the organ doses are stated to be a lot higher in their study [10]. Or- gans such as the lungs, the esophagus, the breasts and the thymus show higher radiation doses (up to 23.35 mGy) in their study [10], whereas organs such as the brain, the urinary bladder and the gonads are evaluated as low (<0.03 mGy) as our organ dose values (<0.04 mSv, Al- derson even <0.01 mSv). The advantage of our dose as- sessment based on real phantom measurement compared to the computer-simulated method has already been men- tioned. Moreover, our phantoms were equipped with an Copyright © 2013 SciRes. OJRad 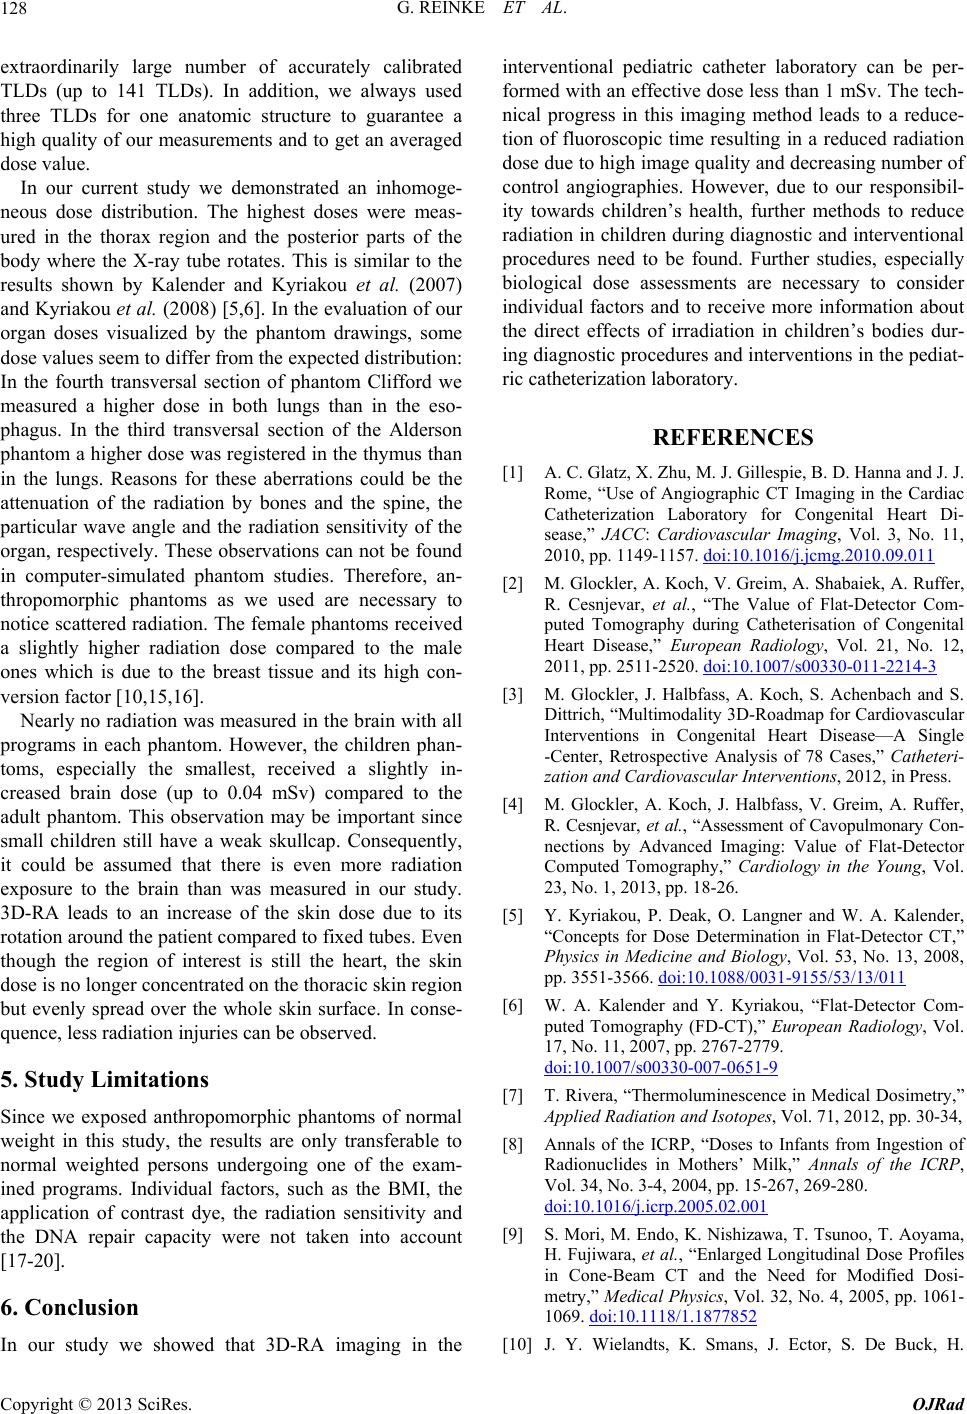 G. REINKE ET AL. 128 extraordinarily large number of accurately calibrated TLDs (up to 141 TLDs). In addition, we always used three TLDs for one anatomic structure to guarantee a high quality of our measurements and to get an averaged dose value. In our current study we demonstrated an inhomoge- neous dose distribution. The highest doses were meas- ured in the thorax region and the posterior parts of the body where the X-ray tube rotates. This is similar to the re 0.04 mSv) compared t ad erable to dergoing one of the exam- factors, such as the BMI, t onal pediatric catheter laboratory can be per- formed with an effective dose less than 1 mSv. The tech- is imaging method leads to a reduce- c CT Imaging in the Cardiac Catheterization Laboratory for Congenital Heart Di- sease,” JACC g, Vol. 3, No. 11, 2010, pp. 1149g.2010.09.011 sults shown by Kalender and Kyriakou et al. (2007) and Kyriakou et al. (2008) [5,6]. In the evaluation of our organ doses visualized by the phantom drawings, some dose values seem to differ from the expected distribution: In the fourth transversal section of phantom Clifford we measured a higher dose in both lungs than in the eso- phagus. In the third transversal section of the Alderson phantom a higher dose was registered in the thymus than in the lungs. Reasons for these aberrations could be the attenuation of the radiation by bones and the spine, the particular wave angle and the radiation sensitivity of the organ, respectively. These observations can not be found in computer-simulated phantom studies. Therefore, an- thropomorphic phantoms as we used are necessary to notice scattered radiation. The female phantoms received a slightly higher radiation dose compared to the male ones which is due to the breast tissue and its high con- version factor [10,15,16]. Nearly no radiation was measured in the brain with all programs in each phantom. However, the children phan- toms, especially the smallest, received a slightly in- creased brain dose (up too the ult phantom. This observation may be important since small children still have a weak skullcap. Consequently, it could be assumed that there is even more radiation exposure to the brain than was measured in our study. 3D-RA leads to an increase of the skin dose due to its rotation around the patient compared to fixed tubes. Even though the region of interest is still the heart, the skin dose is no longer concentrated on the thoracic skin region but evenly spread over the whole skin surface. In conse- quence, less radiation injuries can be observed. 5. Study Limitations Since we exposed anthropomorphic phantoms of normal weight in this study, the results are only transf normal weighted persons un ined programs. Individual he application of contrast dye, the radiation sensitivity and the DNA repair capacity were not taken into account [17-20]. 6. Conclusion In our study we showed that 3D-RA imaging in the interventi nical progress in th tion of fluoroscopic time resulting in a reduced radiation dose due to high image quality and decreasing number of control angiographies. However, due to our responsibil- ity towards children’s health, further methods to reduce radiation in children during diagnostic and interventional procedures need to be found. Further studies, especially biological dose assessments are necessary to consider individual factors and to receive more information about the direct effects of irradiation in children’s bodies dur- ing diagnostic procedures and interventions in the pediat- ric catheterization laboratory. REFERENCES [1] A. C. Glatz, X. Zhu, M. J. Gillespie, B. D. Hanna and J. J. Rome, “Use of Angiographi : Cardiovascular Imagin -1157. doi:10.1016/j.jcm [2] M. Glockler, A. Koch, V. Greim, A. Shabaiek, A. Ruffer, R. Cesnjevar, et al., “The Value of Flat-Detector Com- puted Tomography during Catheterisation of Congenital Heart Disease,” European Radiology, Vol. 21, No. 12, 2011, pp. 2511-2520. doi:10.1007/s00330-011-2214-3 [3] M. Glockler, J. Halbfass, A. Koch, S. Achenbach and S. Dittrich, “Multimodality 3D-Roadmap for Cardiovascular Interventions in Congenital Heart Disease—A Single -Center, Retrospective Analysis of 78 Cases,” Catheteri- zation and Cardiovascular Interventions, 2012, in Press. [4] M. Glockler, A. Koch, J. Halbfass, V. Greim, A. Ruffer, R. Cesnjevar, et al., “Assessment of Cavopulmonary Con- nections by Advanced Imaging: Value of Flat-Detector Computed Tomography,” Cardiology in the Young, Vol. 23, No. 1, 2013, pp. 18-26. [5] Y. Kyriakou, P. Deak, O. Langner and W. A. Kalender, “Concepts for Dose Determination in Flat-Detector CT,” Physics in Medicine and Biology, Vol. 53, No. 13, 2008, pp. 3551-3566. doi:10.1088/0031-9155/53/13/011 [6] W. A. Kalender and Y. Kyriakou, “Flat-Detector Com- puted Tomography (FD-CT),” European Radiology, Vol. 17, No. 11, 2007, pp. 2767-2779. doi:10.1007/s00330-007-0651-9 [7] T. Rivera, “Thermoluminescence in Medical Dosimetry,” Annals of the ICRP, 7, 269-280. Applied Radiation and Isotopes, Vol. 71, 2012, pp. 30-34, [8] Annals of the ICRP, “Doses to Infants from Ingestion of Radionuclides in Mothers’ Milk,” Vol. 34, No. 3-4, 2004, pp. 15-26 doi:10.1016/j.icrp.2005.02.001 [9] S. Mori, M. Endo, K. Nishizawa, T. Tsunoo, T. Aoyama, H. Fujiwara, et al., “Enlarged Longitudinal Dose Profiles in Cone-Beam CT and the Need for Modified Dosi- metry,” Medical Physics, Vol. 32, No. 4, 2005, 1069. pp. 1061- doi:10.1118/1.1877852 [10] J. Y. Wielandts, K. Smans, J. Ector, S. De Buck, H. Copyright © 2013 SciRes. OJRad  G. REINKE ET AL. Copyright © 2013 SciRes. OJRad 129 . 563-579. Heidbuchel and H. Bosmans, “Effective Dose Analysis of Three-Dimensional Rotational Angiography During Ca- theter Ablation Procedures,” Physics in Medicine and Bi- ology, Vol. 55, No. 3, 2010, pp doi:10.1088/0031-9155/55/3/001 [11] J. Y. Wielandts, S. De Buck, J. Ector, A. Lagerche, R. Willems, H. Bosmans, et al., “Three-Dimensional Car- diac Rotational Angiography: Effective Radiation Dose and Image Quality Implications,” Europace 2, 2010, pp. 194-201. , Vol. 12, No. europace/eup394doi:10.1093/ , No [12] J. Partridge, G. McGahan, S. Causton, M. Bowers, M. Mason, M. Dalby, et al., “Radiation Dose Reduction without Compromise of Image Quality in Cardiac An- giography and Intervention with the Use of a Flat Panel Detector without an Antiscatter Grid,” Heart, Vol. 92. 4, 2006, pp. 507-510. doi:10.1136/hrt.2005.063909 [13] H. Justino, “The ALARA Concept in Pediatric Cardiac Catheterization: Techniques and Tactics for Managing Radiation Dose,” Pediatric Radiology, Vol. 36, Suppl. 2, 2006, pp. 146-153. [14] J. Rassow, A. A. Schmaltz, F. Hentrich and C. Streffer “Geschlechtsspezifische Bestimmung adiological Protection—A Re- , “Effective Doses to Patients from Paediatric Cardiac Ca- theterization,” British Journal of Radiology, Vol. 73, No. 866, 2000, pp. 172-183. [15] H. von Boetticher, der Effektiven Dosis am Beispiel von CT-Thoraxun- tersuchungen,” Zeitschrift für Medizinische Physik, Vol. 13, No. 2, 2003, p. 123. [16] A. D. Wrixon, “New Recommendations from the Interna- tional Commission on R view,” Physics in Medicine and Biology, Vol. 53, No. 8, 2008, pp. R41-R60. doi:10.1088/0031-9155/53/8/R01 [17] M. A. Kuefner, S. Grudzenski, S. A. Schwab, M. Wied- erseiner, M. Heckmann, W. Bautz, et al., “DNA Double- Strand Breaks and Their Repair in Blood Lymphocytes of Patients Undergoing Angiographic Procedures,” Investi- gative Radiology, Vol. 44, No. 8, 2009, pp. 440-446. doi:10.1097/RLI.0b013e3181a654a5 [18] M. A. Kuefner, F. M. Hinkmann, S. Alibek, S. Azoul K. Anders, W. A. Kalender, et al., “R ay, eduction of X-Ray Induced DNA Double-Strand Breaks in Blood Lym- phocytes During Coronary CT Angiography Using High- Pitch Spiral Data Acquisition with Prospective ECG- Triggering,” Investigative Radiology, Vol. 45, No. 4, 2010, pp. 182-187. doi:10.1097/RLI.0b013e3181d3eddf [19] S. Achenbach, K. Anders and W. A. Kalender, “Dual- Source Cardiac Computed Tomography: Image Quality and Dose Considerations,” European Radiology, Vol. 18, No. 6, 2008, pp. 1188-1198. doi:10.1007/s00330-008-0883-3 [20] M. A. Kuefner, S. Grudzenski, M. Lell, K. Anders, et al., “Effe J. Hamann, S. Achenbach, ct of CT Scan Protocols on X-Ray-Induced DNA Double-Strand Breaks in Blood lymphocytes of Patients Undergoing Coronary CT An- giography,” European Radiology, Vol. 20, No. 12, 2010, pp. 2917-2924. doi:10.1007/s00330-010-1873-9 |