

Paper Menu >>
Journal Menu >>
 Food and Nutrition Sciences, 2013, 4, 43-48 http://dx.doi.org/10.4236/fns.2013.49A2007 Published Online September 2013 (http://www.scirp.org/journal/fns) Physico-Chemical and Sensory Evaluation of Wheat Bread Supplemented with Stabilized Undefatted Rice Bran Michael O. Ameh1, Dick I. Gernah2*, Bibiana D. Igbabul2 1Department of Nutrition and Dietetics, Federal Medical Centre, Makurdi, Nigeria; 2Department of Food Science and Technology, University of Agriculture, Makurdi, Nigeria. Email: *[email protected] Received July 2nd, 2013; revised August 2nd, 2013; accepted August 9th, 2013 Copyright © 2013 Michael O. Ameh et al. This is an open access article distributed under the Creative Commons Attribution License, which permits unrestricted use, distribution, and reproduction in any medium, provided the original work is properly cited. ABSTRACT The effect of rice bran supplementation on some physico-chemical and sensory properties of wheat bread was deter- mined. Blends of wheat flour and rice bran (95:5, 90:10 and 85:15) were used to bake bread with 100% wheat flour as control. Thereafter, proximate, vitamin and mineral composition, as well as the physical and sensory properties of the dough and bread loaves were determined, using standard methods of analysis. The moisture content, crude protein, crude fat, crude fibre and ash of the composite bread loaves increased significantly (p < 0.05) from 21.07% to 23.67%, 12.04% to 13.10%, 1.57% to 3.77%, 1.76% to 2.91% and 1.46% to 2.41% respectively; while carbohydrate content decreased with increased level of supplementation from 62.10% to 54.14%. There were significant increases (p < 0.05) in vitamin B1 (Thiamin) from 0.15 mg/100g to 0.47 mg/100g and B2 (Niacin) from 3.31 mg/100g to 4.04 mg/100g but no significant increase (p > 0.05) in vitamin B3 (Riboflavin). Mineral content of the bread increased significantly (p < 0.05) with increased level of supplementation from 9.32 mg/100g to 20.52 mg/100g (Iron), 80.74 mg/100g to 188.20 mg/100g (Potassium), 81.31 mg/100g to 130.70 mg/100g (Calcium) and 13.65 mg/100g to 132.22 mg/100g (Magne- sium). However, there was a significant decrease (p < 0.05) in sodium with increased level of supplementation from 305.25 mg/100g to 253.03 mg/100g. Bread loaf weight increased from 152.7 g to 162.7 g; while loaf volume decreased from 655.2 ml to 586.0 ml and specific loaf volume decreased from 4.29 ml/g to 3.60 ml/g. There were significant dif- ferences (p < 0.05) in physical properties of dough and bread loaves between the composite bread and the control. Though 100% wheat bread had better acceptability scores (7.95) compared to composite bread (7.20 for 95:5 blend), all the composite bread samples had significantly (p < 0.05) higher values for nutritional parameters. There was therefore, a significant improvement in the nutritional composition of the wheat bread with rice bran supplementation. Keywords: Composite Bread; Vitamins; Minerals; Rice Bran; Supplementation 1. Introduction The problems of malnutrition in Nigeria, although dif- ferent in magnitude and severity among different groups, are due to protein, vitamins, and mineral deficiencies [1]. Since the diet of an average Nigerian consists of foods that are mostly carbohydrate based, there is therefore, need for strategic use of inexpensive high protein and micronutrient food sources that will increase the protein content of the staple diet in order to enhance their nutri- tive value. Bread is an important staple food, the consumption of which is steadily increasing in Nigeria due to changing life styles. Nutritionally, bread contains a high percent- age of carbohydrate and fat both of which are needed for energy production. Other nutrients like vitamins, miner- als and protein are relatively in small proportion [2]. It is however, relatively expensive, being made from wheat which cannot be cultivated in the tropics for climatic reasons. Wheat importation therefore represents an im- mense drain on the economy while also suppressing and displacing indigenous cereals, with a resultant detrimen- tal effect on agricultural and technological development. Recently, the focus of interest and significant efforts has been in the development of food products from by- products or wastes and under-utilized agricultural prod- ucts—“wealth from waste” [3]. Apparently, such utiliza- tion and development embarks on production of various new food products by maximizing the available re- *Corresponding author. Copyright © 2013 SciRes. FNS  Physico-Chemical and Sensory Evaluation of Wheat Bread Supplemented with Stabilized Undefatted Rice Bran 44 sources to contribute the recommended dietary nutrient intake to fulfill the consumer’s expectations. Develop- ment of new generation bread products derived from diverse sources of non-wheat flours provides an alterna- tive towards nutritionally richer and cheaper bread prod- ucts [4]. The objective of supplementing alternative in- gredients in bread formulation is to improve the nutri- tional value of wheat flour particularly proteins, minerals, vitamins and dietary fibre [4]. Formulation of composite flour is vital for development of value added products with optimal functionality [5]. A variety of wheat flour substitutes such as soy or defatted soy flour [6], defatted wheat germ [7], flax seed [8], sunflower seed [9], chem- pedak seed flour [10], and rice bran [11,12] have been tried in bakery formulation with varying success. Rice bran, the brown outer layer of rice kernel is mai- nly composed of pericarp, aleurone/sub-aleurone layers and germ. Currently it is discarded as a waste product during the process of rice milling in this part of the world. However, it is an excellent source of total dietary fiber ranging from 20% - 51% [13]. Rice bran fiber has laxa- tive effect with increased fecal output and stool frequen- cies [14]. It is also a good source of proteins, lipids, vi- tamins and minerals. Chemically it contains 11% - 17% protein, 11% - 18% fat, 10% fibre, 9% ash and 45% - 65% nitrogen free extract (NFE). It is a rich source of B—vitamins and minerals such as potassium, calcium, magnesium and iron [13,15,16]. The amino acid profile of rice bran has been generally reported to be superior to cereal grain proteins [17]. The low content of saturated fatty acids and high content of linoleic acid, poly-unsa- turated fatty acids plus tocopherol makes rice bran oil a health beneficial food [18]. Godber et al. [19] have shown that rice bran and rice bran oil have potential health benefits in the prevention of diseases such as can- cer, kidney stones, heart disease and hyperlipidaemia. This is attributed to the high content of gammaryzanol, which is a mixture of ferulate esters of triterpene alcohols [19]. Work done in this area suggests that supplementation of wheat flour with rice bran holds the potential to uplift the nutritional profile of their food products with special reference to protein, lysine and dietary fiber contents [20]. Sharp and Kitchen [11] reported that defatted rice bran increases dough yield, contributes to an attractive crumb and crust, does not disturb fermentation or mixing toler- ance of dough, causes baked products to remain fresh, moist and also adds significant amino acids, minerals and vitamins to baked goods. Owing to its composition and apparent hypoallergenicity, rice bran has much applica- tion in a diet which may be characterized by high dietary fibre and low saturated fat. It may be particularly benefi- cial to those individuals who are allergic to other cereal grains [21]. This work was therefore, aimed at assessing the effect of rice bran supplementation on the physical properties, nutritional composition and sensory acceptability of wheat bread. 2. Materials and Methods 2.1. Source of Materials About 4.0 kg of parboiled rice bran was obtained from Olam Nigeria Limited Rice Mill, Makurdi; while 5.0 kg of wheat flour and other ingredients like sugar, bakers’ yeast, plasticized fat and salt were purchased from Mod- ern Market, Makurdi, Benue State. 2.2. Material Preparation The Rice bran and wheat flour were sieved to a consis- tent particle size (0.50 mm) to remove impurities such as hulls, endosperm and weed seeds. And both were pack- aged in a low density polyethylene bags and stored at room temperature for future use. 2.3. Formulation of Flour Blends Three flour blends were prepared by mixing wheat flour with rice bran in the proportions of 95:5, 90:10 and 85:15 using a mechanical blender (Sharp EM11), while 100% wheat flour was used as control. The four flour samples were packaged in black low density polyethylene bags and stored in 500 ml lidded plastic containers at room temperature from where samples were taken for analysis and bread production. 2.4. Baking Process Bread was baked from the flour samples using the straight dough method of Chauhan et al. [22]. All ingre- dients were thoroughly mixed in a dough mixer to form dough, which was put into a baking pan greased with plasticized fat and covered with greased bread wrapper. The doughs were fermented for 90 minutes at room tem- perature (28˚C - 30˚C), proofed at 35˚C - 40˚C for 90 minutes, and baked at 250˚C for 30 minutes. The bread loaves were packaged in low density polyethylene bags for consumption and stored at room temperature for fu- ture analysis. 2.5. Analyses 2.5.1. Chemical A nalyses The moisture, ash, crude fat, crude protein and crude fibre contents of the flours and bread samples were de- termined using the method of AOAC [23]. Carbohydrate was determined by difference as described by Ihekoronye and Ngoddy [24]. Mineral composition (Ca, Mg, K and Fe) was determined using Atomic Absorption Spectro- Copyright © 2013 SciRes. FNS 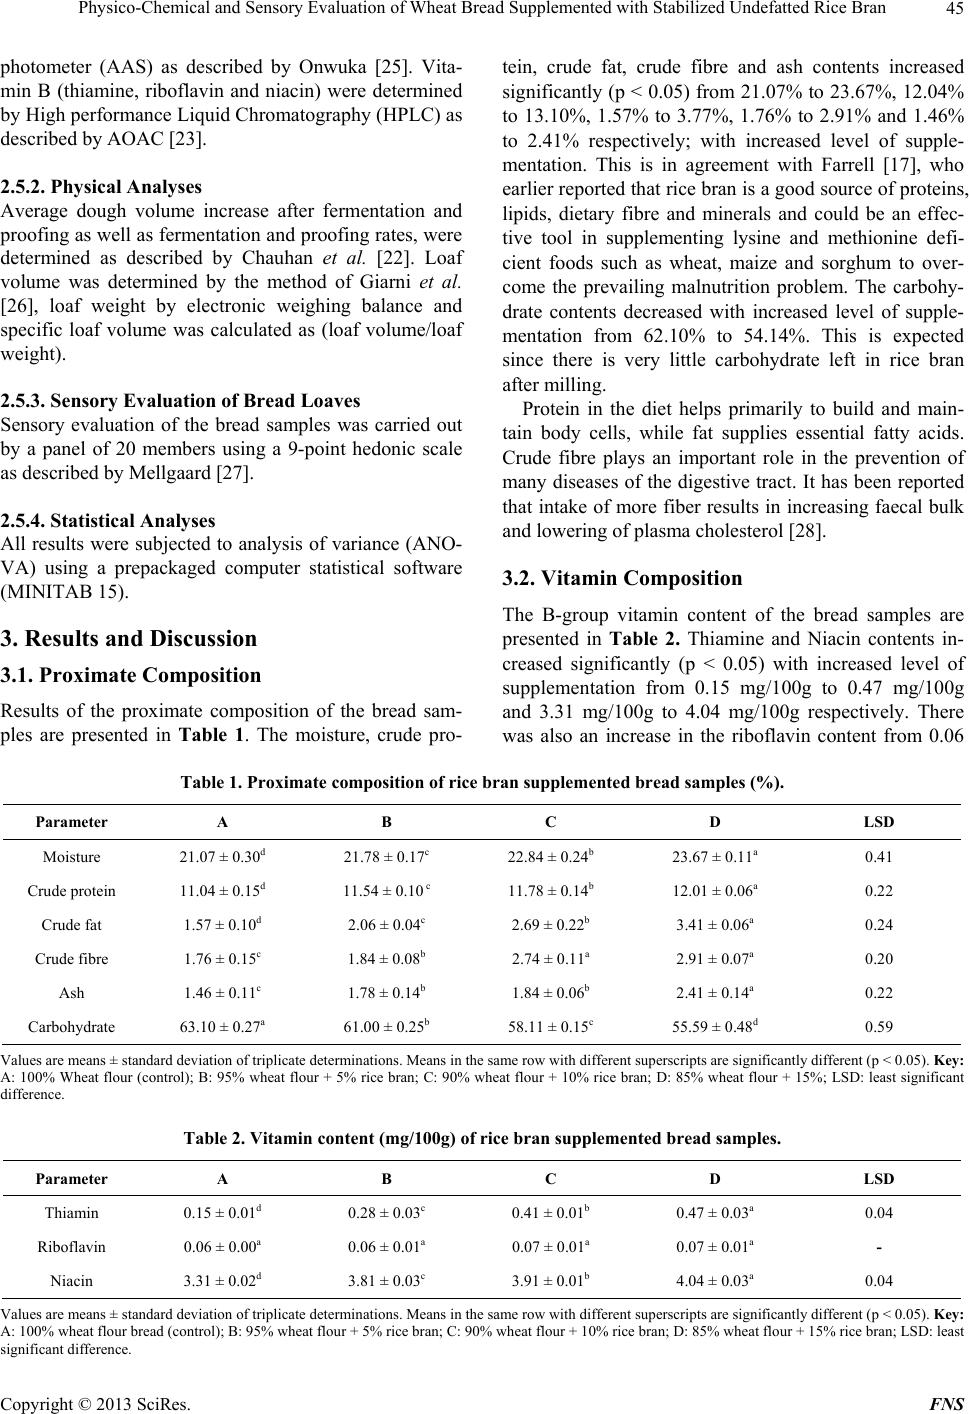 Physico-Chemical and Sensory Evaluation of Wheat Bread Supplemented with Stabilized Undefatted Rice Bran Copyright © 2013 SciRes. FNS 45 photometer (AAS) as described by Onwuka [25]. Vita- min B (thiamine, riboflavin and niacin) were determined by High performance Liquid Chromatography (HPLC) as described by AOAC [23]. 2.5.2. Physical An a l y ses Average dough volume increase after fermentation and proofing as well as fermentation and proofing rates, were determined as described by Chauhan et al. [22]. Loaf volume was determined by the method of Giarni et al. [26], loaf weight by electronic weighing balance and specific loaf volume was calculated as (loaf volume/loaf weight). 2.5.3. Sensory E v aluati on of Bread Loaves Sensory evaluation of the bread samples was carried out by a panel of 20 members using a 9-point hedonic scale as described by Mellgaard [27]. 2.5.4. St a ti stical An alyses All results were subjected to analysis of variance (ANO- VA) using a prepackaged computer statistical software (MINITAB 15). 3. Results and Discussion 3.1. Proximate Composition Results of the proximate composition of the bread sam- ples are presented in Table 1. The moisture, crude pro- tein, crude fat, crude fibre and ash contents increased significantly (p < 0.05) from 21.07% to 23.67%, 12.04% to 13.10%, 1.57% to 3.77%, 1.76% to 2.91% and 1.46% to 2.41% respectively; with increased level of supple- mentation. This is in agreement with Farrell [17], who earlier reported that rice bran is a good source of proteins, lipids, dietary fibre and minerals and could be an effec- tive tool in supplementing lysine and methionine defi- cient foods such as wheat, maize and sorghum to over- come the prevailing malnutrition problem. The carbohy- drate contents decreased with increased level of supple- mentation from 62.10% to 54.14%. This is expected since there is very little carbohydrate left in rice bran after milling. Protein in the diet helps primarily to build and main- tain body cells, while fat supplies essential fatty acids. Crude fibre plays an important role in the prevention of many diseases of the digestive tract. It has been reported that intake of more fiber results in increasing faecal bulk and lowering of plasma cholesterol [28]. 3.2. Vitamin Composition The B-group vitamin content of the bread samples are presented in Table 2. Thiamine and Niacin contents in- creased significantly (p < 0.05) with increased level of supplementation from 0.15 mg/100g to 0.47 mg/100g and 3.31 mg/100g to 4.04 mg/100g respectively. There was also an increase in the riboflavin content from 0.06 Table 1. Proximate composition of rice bran supplemented bread samples (%). Parameter A B C D LSD Moisture 21.07 ± 0.30d 21.78 ± 0.17c 22.84 ± 0.24b 23.67 ± 0.11a 0.41 Crude protein 11.04 ± 0.15d 11.54 ± 0.10 c 11.78 ± 0.14b 12.01 ± 0.06a 0.22 Crude fat 1.57 ± 0.10d 2.06 ± 0.04c 2.69 ± 0.22b 3.41 ± 0.06a 0.24 Crude fibre 1.76 ± 0.15c 1.84 ± 0.08b 2.74 ± 0.11a 2.91 ± 0.07a 0.20 Ash 1.46 ± 0.11c 1.78 ± 0.14b 1.84 ± 0.06b 2.41 ± 0.14a 0.22 Carbohydrate 63.10 ± 0.27a 61.00 ± 0.25b 58.11 ± 0.15c 55.59 ± 0.48d 0.59 Values are means ± standard deviation of triplicate determinations. Means in the same row with different superscripts are significantly different (p < 0.05). Key: A: 100% Wheat flour (control); B: 95% wheat flour + 5% rice bran; C: 90% wheat flour + 10% rice bran; D: 85% wheat flour + 15%; LSD: least significant difference. Table 2. Vitamin content (mg/100g) of rice bran supplemented bread samples. Parameter A B C D LSD Thiamin 0.15 ± 0.01d 0.28 ± 0.03c 0.41 ± 0.01b 0.47 ± 0.03a 0.04 Riboflavin 0.06 ± 0.00a 0.06 ± 0.01a 0.07 ± 0.01a 0.07 ± 0.01a - Niacin 3.31 ± 0.02d 3.81 ± 0.03c 3.91 ± 0.01b 4.04 ± 0.03a 0.04 Values are means ± standard deviation of triplicate determinations. Means in the same row with different superscripts are significantly different (p < 0.05). Key: A: 100% wheat flour bread (control); B: 95% wheat flour + 5% rice bran; C: 90% wheat flour + 10% rice bran; D: 85% wheat flour + 15% rice bran; LSD: least significant difference. 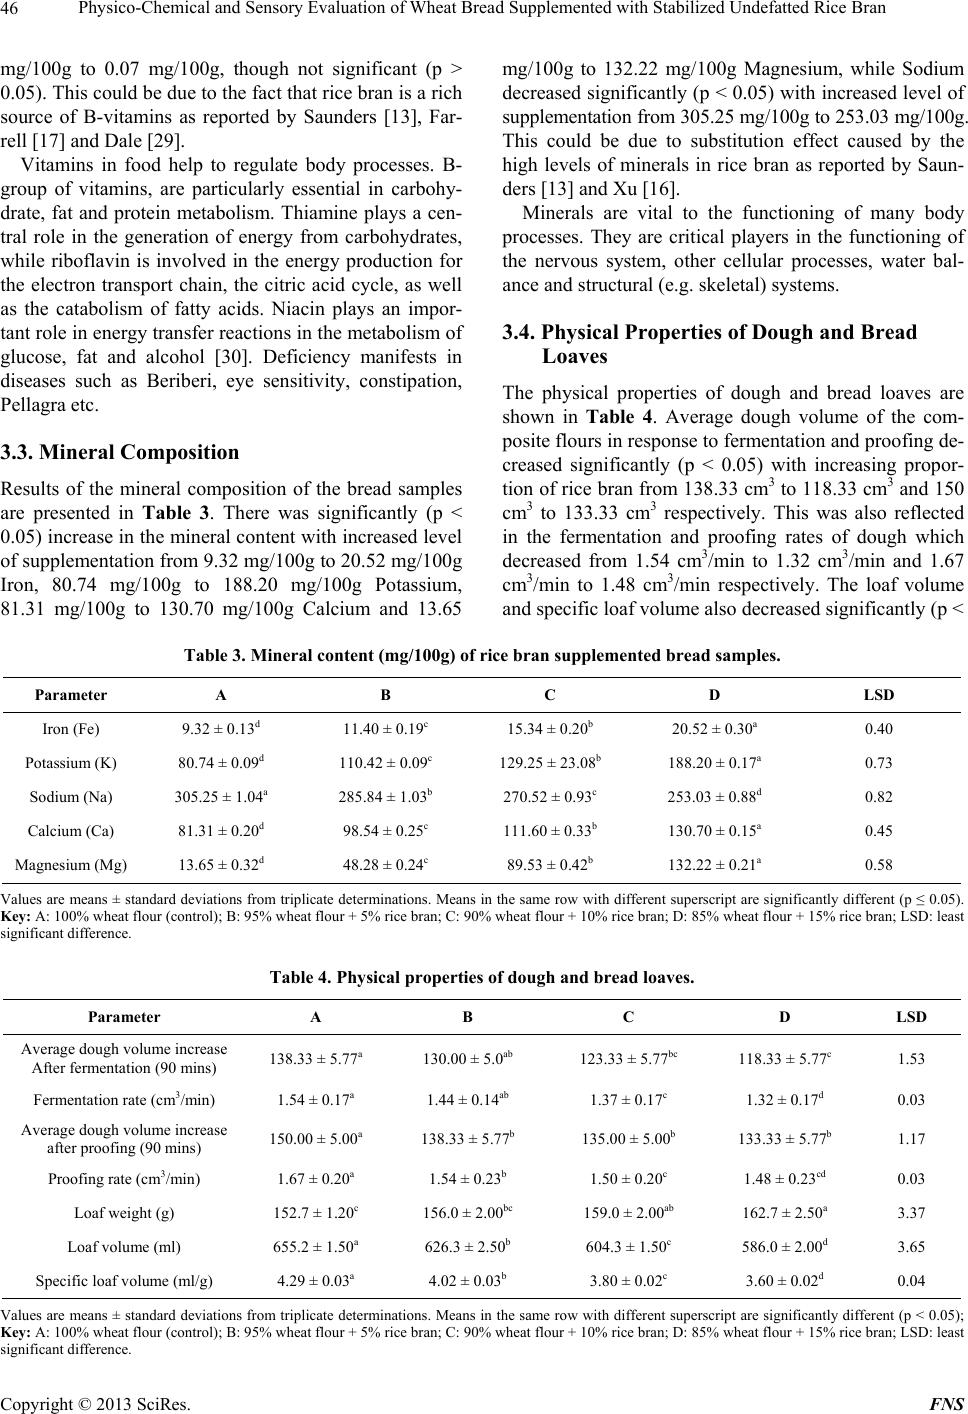 Physico-Chemical and Sensory Evaluation of Wheat Bread Supplemented with Stabilized Undefatted Rice Bran 46 mg/100g to 0.07 mg/100g, though not significant (p > 0.05). This could be due to the fact that rice bran is a rich source of B-vitamins as reported by Saunders [13], Far- rell [17] and Dale [29]. Vitamins in food help to regulate body processes. B- group of vitamins, are particularly essential in carbohy- drate, fat and protein metabolism. Thiamine plays a cen- tral role in the generation of energy from carbohydrates, while riboflavin is involved in the energy production for the electron transport chain, the citric acid cycle, as well as the catabolism of fatty acids. Niacin plays an impor- tant role in energy transfer reactions in the metabolism of glucose, fat and alcohol [30]. Deficiency manifests in diseases such as Beriberi, eye sensitivity, constipation, Pellagra etc. 3.3. Mineral Composition Results of the mineral composition of the bread samples are presented in Table 3. There was significantly (p < 0.05) increase in the mineral content with increased level of supplementation from 9.32 mg/100g to 20.52 mg/100g Iron, 80.74 mg/100g to 188.20 mg/100g Potassium, 81.31 mg/100g to 130.70 mg/100g Calcium and 13.65 mg/100g to 132.22 mg/100g Magnesium, while Sodium decreased significantly (p < 0.05) with increased level of supplementation from 305.25 mg/100g to 253.03 mg/100g. This could be due to substitution effect caused by the high levels of minerals in rice bran as reported by Saun- ders [13] and Xu [16]. Minerals are vital to the functioning of many body processes. They are critical players in the functioning of the nervous system, other cellular processes, water bal- ance and structural (e.g. skeletal) systems. 3.4. Physical Properties of Dough and Bread Loaves The physical properties of dough and bread loaves are shown in Table 4. Average dough volume of the com- posite flours in response to fermentation and proofing de- creased significantly (p < 0.05) with increasing propor- tion of rice bran from 138.33 cm3 to 118.33 cm3 and 150 cm3 to 133.33 cm3 respectively. This was also reflected in the fermentation and proofing rates of dough which decreased from 1.54 cm3/min to 1.32 cm3/min and 1.67 cm3/min to 1.48 cm3/min respectively. The loaf volume and specific loaf volume also decreased significantly (p < Table 3. Mineral content (mg/100g) of rice bran supplemented bread samples. Parameter A B C D LSD Iron (Fe) 9.32 ± 0.13d 11.40 ± 0.19c 15.34 ± 0.20b 20.52 ± 0.30a 0.40 Potassium (K) 80.74 ± 0.09d 110.42 ± 0.09c 129.25 ± 23.08b 188.20 ± 0.17a 0.73 Sodium (Na) 305.25 ± 1.04a 285.84 ± 1.03b 270.52 ± 0.93c 253.03 ± 0.88d 0.82 Calcium (Ca) 81.31 ± 0.20d 98.54 ± 0.25c 111.60 ± 0.33b 130.70 ± 0.15a 0.45 Magnesium (Mg) 13.65 ± 0.32d 48.28 ± 0.24c 89.53 ± 0.42b 132.22 ± 0.21a 0.58 Values are means ± standard deviations from triplicate determinations. Means in the same row with different superscript are significantly different (p ≤ 0.05). Key: A: 100% wheat flour (control); B: 95% wheat flour + 5% rice bran; C: 90% wheat flour + 10% rice bran; D: 85% wheat flour + 15% rice bran; LSD: least significant difference. Table 4. Physical properties of dough and bread loaves. Parameter A B C D LSD Average dough volume increase After fermentation (90 mins) 138.33 ± 5.77a 130.00 ± 5.0ab 123.33 ± 5.77bc 118.33 ± 5.77c 1.53 Fermentation rate (cm3/min) 1.54 ± 0.17a 1.44 ± 0.14ab 1.37 ± 0.17c 1.32 ± 0.17d 0.03 Average dough volume increase after proofing (90 mins) 150.00 ± 5.00a 138.33 ± 5.77b 135.00 ± 5.00b 133.33 ± 5.77b 1.17 Proofing rate (cm3/min) 1.67 ± 0.20a 1.54 ± 0.23b 1.50 ± 0.20c 1.48 ± 0.23cd 0.03 Loaf weight (g) 152.7 ± 1.20c 156.0 ± 2.00bc 159.0 ± 2.00ab 162.7 ± 2.50a 3.37 Loaf volume (ml) 655.2 ± 1.50a 626.3 ± 2.50b 604.3 ± 1.50c 586.0 ± 2.00d 3.65 Specific loaf volume (ml/g) 4.29 ± 0.03a 4.02 ± 0.03b 3.80 ± 0.02c 3.60 ± 0.02d 0.04 Values are means ± standard deviations from triplicate determinations. Means in the same row with different superscript are significantly different (p < 0.05); Key: A: 100% wheat flour (control); B: 95% wheat flour + 5% rice bran; C: 90% wheat flour + 10% rice bran; D: 85% wheat flour + 15% rice bran; LSD: least significant difference. Copyright © 2013 SciRes. FNS  Physico-Chemical and Sensory Evaluation of Wheat Bread Supplemented with Stabilized Undefatted Rice Bran 47 Table 5. Mean sensory scores of bread loaves. Parameter A B C D LSD Taste 7.60a 6.75ab 6.20b 5.80b 1.35 Texture 7.90a 6.65b 6.20bc 5.45c 1.12 Aroma 7.45a 6.40b 5.70b 5.60b 0.94 Crumb color 7.60a 6.45ab 5.75b 5.60b 1.24 Crust color 8.25a 6.55b 5.55bc 5.45c 1.05 Overall acceptability 7.95a 7.20a 5.70b 5.55b 1.27 Values are means ± standard deviations from triplicate determinations. Means in the same row with different superscript are significantly different (p ≤ 0.05). Key: A: 100% wheat flour (control); B: 95% wheat flour + 5% rice bran; C: 90% wheat flour + 10% rice bran; D: 85% wheat flour + 15% rice bran; LSD: least significant different. 0.05) with increased proportion of rice bran from 655.2 ml to 586.0 ml and 4.29 ml/g to 3.60 ml/g respectively. This may be attributed to the higher level of gluten pre- sent in wheat flour compared to composite blends which could not be properly stretched by carbon dioxide (CO2) gas during fermentation and proofing [31]. This also ac- counts for the higher specific loaf volume found in 100% wheat flour bread (control) as compared to composite bread loaves. The loaf weight of composite bread was higher than 100% wheat flour bread (control) and this increased significantly (p < 0.05) with increased propor- tion of rice bran blends from 152.7g to 162.7g. The increase in loaf weight might be due to the high water absorption by the rice bran and the reduced air entrapment, resulting in heavy dough. This was also re- flected in the moisture content of bread loaves, with composite bread loaves giving higher moisture content than 100% wheat flour bread. According to Green and Bovel-Benjamin [32], bulky bread is desirable to hungry consumers because it is stomach filling and satisfying. 3.5. Sensory Scores of Bread Loaves The sensory scores of the bread loaves are shown in Ta- ble 5. There was a significant (p < 0.05) difference be- tween the control and the composite bread in terms of texture, crumb colour, aroma, crust colour and overall acceptability. Overall acceptability was determined on the basis of quality scores obtained from the evaluation of taste, texture, aroma, crumb and crust colour. It is evident from the result that 100% wheat flour bread was more acceptable by the judges followed by composite wheat-rice bran bread with 5%, 10% and 15% level of rice bran supplementation respectively. This could be attributed to the fact that people have been used to the quality attributes in the control food sample (100% wheat bread). 4. Conclusion Acceptable and nutritious bread was produced from com- posite flours of wheat and parboiled (stabilized) rice bran. Though the 100% wheat bread was organoleptically more acceptable, the composite bread samples were more nutritious. Rice bran supplementation significantly im- proved the dietary fiber, mineral, vitamin (B-group) and protein content of the bread. With the present cost of wheat, it is advantageous to seriously explore the possibility of using wheat/rice bran composite flours for commercial production of bread. This will reduce the cost of production (since rice bran is considered a waste product and is virtually free in this part of the world) and help solve the environmental problem of waste disposal. REFERENCES [1] O. C. Adeboye, “Proximate Composition and Nutrient Analysis of Six Selected Leafy Vegetables of South West Nigeria,” Ife Journal of Agriculture, Vol. 18, No. 1-2, 1996, pp. 56-63. [2] J. Young, “Functional Bakery Products: Current Direc- tions and Future Opportunities,” Food Industry Journal, Vol. 4, 2001, pp. 136-144. [3] L. H. McKee and T. A. Latner, “Underutilized Sources of Dietary Fibre: A Review,” Plant Foods for Human Nutri- tion, Vol. 55, No. 4, 2000, pp. 285-304. [4] E. Hallen, S. Ibsnoglu and P. Anisworth, “Effect of Fer- mented/Germinated Cowpea Flour Addition on the Rheo- logical and Baking Properties of Wheat Flour,” Food En- gineering, Vol. 63, No. 2, 2004, pp. 177-184. [5] S. Rehman, A. Paterson, S. Hussain, M. A. Murtaza and S. Mehmood, “Influence of Partial Substitution of Wheat Flour with Vetch (Lathyrus sativus L) Flour on Quality Characteristics of Doughnuts,” Leben Smitted Wissen- chaffund Technologies, Vol. 40, No. 1, 2007, pp. 73-82. [6] R. M. Junqueira, M. L. Cocato, C. Colli and L. A. Castro, “Synergisms between Lipoxygenase-Active Soybean Flour and Ascorbic Acid on Rheology and Bread Quality,” Journal of Science, Food and Agriculture, Vol. 87, 2008, pp. 1172-1175. [7] M. Arshad, F. Anjum and T. Zahoor, “Nutritional Assess- ment of Cookies Supplemented with Deflated Wheat Germ,” Food Chemistry, Vol. 102, No. 1, 2007, pp. 123- 128. doi:10.1016/j.foodchem.2006.04.040 Copyright © 2013 SciRes. FNS  Physico-Chemical and Sensory Evaluation of Wheat Bread Supplemented with Stabilized Undefatted Rice Bran 48 [8] F. Koca and M. Anil, “Effect of Flaxseed and Wheat Flour Blends on Dough Rheology and Bread Quality,” Journal of Science, Food and Agriculture, Vol. 87, No. 6, 2000, pp. 1172-1175. doi:10.1002/jsfa.2739 [9] B. Skrbic and B. Filipcev, “Nutritional and Sensory Eval- uation of Wheat Breads Supplemented with Oleic-Rich Flower Seed,” Food Chemistry, Vol. 180, No. 1, 2008, pp. 119-129. doi:10.1016/j.foodchem.2007.10.052 [10] B. A. Z. Mardiana, “Effects of Partial Substitution of Wheat Flour with Chempedak (Artocarpus integer) Seed Flour on the Physico-Chemical, Organoleptic and Micro- biological Attributes of the Bread,” M.Sc. Thesis, Uni- versity of Sains, Malaysia, 2008. [11] C. Q. Sharp and K. J. Kitchen, “Using Rice Bran in Yeast Bread in a Home Baker,” Cereal Foods World, Vol. 35, No. 10, 1990, pp. 1021-1028. [12] H. R. Sharma and G. S. Chauhan, “Effect of Stabilized Rice Bran-Fenugreek Blends on the Quality of Breads and Cookies,” Journal of Food Science and Nutrition, Vol. 39, No. 3, 2002, pp. 225-233. [13] R. M. Saunders, “The Properties of Rice Bran as a Food Stuff,” Cereal Foods World, Vol. 35, No. 7, 1990, pp. 632-639. [14] N. Deep, K. Yadav-Krishna and R. Singh-Jagbir, “Studies on Fortification of Wheat Flour with Defatted Rice Bran for ‘Chapati’ Making,” Journal of Food Science and Technology, Vol. 49, No. 1, 2010, pp. 96-102. [15] H. Hu, M. Rabinowitz and D. Smith, “Bone Lead as a Biological Marker in Epidemiological Studies of Chronic Toxicity: Conceptual Paradigms,” Environmental Health Perspective, Vol. 106, No. 1, 1998, pp. 1-8. doi:10.1289/ehp.981061 [16] Z. Xu, “Purification and Antioxidant Properties of Rice Bran Y-Oryzanol Components,” Ph.D. Dissertation, Lou- isiana State University, Baton Rouge, 1998. [17] D. J. Farrell, “Utilization of Rice Bran in Diets for Do- mestic Fowls and Ducklings,” World’s Poultry Science Journal, Vol. 50, No. 2, 1994, pp. 115-131. [18] L. E. Carroll, “Functional Properties and Application of Stabilized Rice Bran in Bakery Products,” Journal of Food Technology, Vol. 44, 1990, pp. 74-76. [19] J. Godber, Z. Xu, D. Hegsted and T. Walker, “Rice and Rice Bran Oil in Functional Foods Development,” Lou- isiana Agriculture, Vol. 45, No. 4, 2004, pp. 9-10. [20] K. S. Sekhon, S. S. Dhillon, N. Singh and B. Singh, “Functional Suitability of Commercially Milled Rice Bran in India for Use in Different Food Products,” Plant Foods for Human Nutrition, Vol. 50, No. 2, 1997, pp. 127-140. doi:10.1007/BF02436032 [21] B. Singh, K. S. Sekhon and N. Singh, “Suitability of Full Fat and Defatted Rice Bran Obtained from Indian Rice for Use in Food Products,” Plant Foods for Human Nutri- tion, Vol. 47, No. 3, 1995, pp. 191-200. [22] G. S. Chauhan, R. R. Zilliman and N. A. M. Eskin, “Dough Mixing and Bread Making Properties of Guinea Corn/Wheat Flour Blends,” International Journal of Food Science and Technology, Vol. 27, No. 6, 1992, pp. 701- 705. doi:10.1111/j.1365-2621.1992.tb01241.x [23] Association of Official Analytical Chemist, “Official Me- thods of Analysis,” 18th Edition, Arlington, V.A., 1996, pp. 806-842. [24] A. I. Ihekoronye and P. O. Ngoddy, “Integrated Food Science and Technology for the Tropics,” Macmillan Publishers, New York, 1985, pp. 296-301. [25] G. I. Onwuka, “Food Analysis and Instrumentation,” Nphatali Press, Lagos, 2005, pp. 178-179. [26] S. Y. Giarni, M. N. Adnindu, M. O. Akusu and J. N. T Emenike, “Compositional, Functional and Storage Prop- erties of Flours from Raw and Heat Processed African Bread Fruit (Treculia africana Dence) Seeds,” Plant Foods for Human Nutrition, Vol. 55, 2004, pp. 357-368. [27] M. C. Meilgaard, G. V. Civille and B. T. Carr, “Sensory Evaluation Techniques,” 4th Edition, C.R.C. Press L.L.C., New York, 2007. [28] T. S. Kehlon, F. I. Chow and R. N. Sayre, “Cholesterol Lowering Properties of Rice Bran,” Cereal Foods World, Vol. 39, 1994, pp. 99-103. [29] N. Dale, “Feedstuffs Ingredient Analysis Table. Feed Stuff,” Watt Publication. Co., IL, 1997, pp. 48-52. [30] S. Gropper and J. Smith, “Advanced Nutrition and Hu- man Metabolism,” Cengage Learning Betmont, CA, 2009. [31] O. O. Oladunmoye, R. Akinoso and A. A. Olapade, “Eva- luation of Some Physic-Chemical Propreties of Wheat, Cassava, Maize and Cowpea Flours for Bread Making,” Journal of Food Quality, Vol. 33, No. 6, 2010, pp. 693- 708. doi:10.1111/j.1745-4557.2010.00351.x [32] J. L. Greene and A. C. Bovell-Benjamin, “Macroscopic and Sensory Evaluation of Bread Supplemented with Sweet Potato Flour,” Journal of Food Science, Vol. 69, No. 4, 2004, pp. 167-173. Copyright © 2013 SciRes. FNS |