

Paper Menu >>
Journal Menu >>
 Vol.5, No.9, 1012-1018 (2013) Natural Science http://dx.doi.org/10.4236/ns.2013.59125 Contribution of soil and foliar fertilization of nitrogen and sulfur on physiological and quality assessment of wheat (Triticum aestivum L.) Beena Saeed1*, Hasina Gul2, Farman Ali1, Amir Zaman Khan2, Shazma Anwar2, Nasrullah3, Sadia Alam4, Salma Khalid5, Alia Naz5, Hina Fayyaz7, Azra6 1Department of Agriculture, Abdul Wali Khan University, Mardan, Pakistan; *Corresponding Author: [email protected] 2Department of Agronomy, The University of Agriculture, Peshawar, Pakistan 3Department of Soil Sciences, The University of Agriculture, Peshawar, Pakistan 4Department of Biotechnology, Abdul Wali Khan University, Mardan, Pakistan 5Department of Environmental Sciences, Abdul Wali Khan University, Mardan, Pakistan 6Department of Plant Pathology, The University of Agriculture, Mardan Campus, Pakistan 7Department of Plant Breeding & Genetics, The University of Agriculture, Peshawar, Pakistan Received 10 April 2013; revised 10 May 2013; accepted 18 May 2013 Copyright © 2013 Beena Saeed et al. This is an open access article distributed under the Creative Commons Attribution License, which permits unrestricted use, distribution, and reproduction in any medium, provided the original work is properly cited. ABSTRACT Nitrogen and sulfur supplies have a strong in- fluence on the physical characteristics of crop as well as on the quality and quantity of wheat storage proteins, which play an important role in bread-making process. In order to evaluate the contribution of soil and foliar fertilization of ni- trogen and sulfur on physiological and quality assessment of wheat, a field trail was carried out having randomized complete block design with four replications and eight different treatments of nitrogen and sulfur combinations were allot- ted to plots at different growth stages. Results indicated that highest protein content (12.82%), maximum moisture content (10.9%), maximum crop growth rate and maximum absolute growth rate were recorded when the wheat crop was fertilized with T8 [Nitrogen @ 60 kg·ha−1 at sow- ing + 40 kg·ha−1 at tillering + 10 kg·ha−1 at anthe- sis (spray) + 10 kg·ha−1 after anthesis (spray)] + [Sulfur @ 15 kg·ha−1 at sowing + 10 kg·ha−1 at anthesis (spray) + 5 kg·ha−1 after anthesis (spray)], while control practice resulted low moisture content, low protein, minimum crop growth rate and low absolute growth rate. Among physiological components of wheat cul- tivars, leaf area index was enhanced when fer- tilization was done with T5 (Sulfur @ 15 kg·ha−1 at sowing + 10 kg·ha−1 at anthesis + 5 kg·ha−1 after anthesis). In all the recorded observations, concerning experiment wheat cultivar Pirsabaq- 2005 showed appreciable response as compared with other variety (Khyber-87). Thus it is possi- ble to obtain maximum physiological traits as well as bread-making quality of wheat through soil and foliar application of nitrogen and sulfur. Keywords: Absolute Growth Rate; Crop Growth Rate; Leaf Area Index; Moisture and Protein Contents 1. INTRODUCTION Cereals are an important dietary protein source through- out the world, because they constitute the main protein and energy supply in most countries [1]. Wheat is one of the major cereal crops with a unique protein, which is consumed by the humans and is grown around the world in diverse environments. It has already been known that gluten proteins have a primary role in wheat flour quality. It is recognized that variation in protein contents and composition significantly affects wheat quality with sub- sequent influence on baking quality [2]. Nitrogen and sulfur contents of wheat influence the bread-making qual- ity of wheat flour [3]. Studies have shown that foliar as well as soil application of nitrogen and sulfur on wheat at optimum timings (during and after anthesis) has increased grain protein contents and improved bread-making qual- ity [4]. Nitrogen rate, type and timings of its application are important factors to increase wheat protein contents and Copyright © 2013 SciRes. OPEN ACCESS  B. Saeed et al. / Natural Science 5 (2013) 1012-1018 1013 its yield [5]. In a study, Nitrogen spraying on leaves dur- ing 2 - 3 weeks after flowering has shown a significant increase in grain protein contents [4]. The metabolism of nitrogen and sulfur is closely interrelated and an optimal N/S ratio in grain has been shown to improve bread- making quality. Differences in nitrogen and sulfur uptake and redistribution of nitrogen and sulfur influence pro- tein content and composition as well as grain characteris- tics and dough properties. The current practice of apply- ing large amounts of nitrogen fertilizers to cereal crops without considering sulfur requirements is becoming a concern for crop quality. With the increased use of sul- fur-free fertilizers in modern cropping systems and the decrease of atmospheric sulfur emissions by industry, sulfur has become a major limiting factor for crop pro- duction. Research has also indicated that there is an in- crease of grain protein from 11% to 12% by spraying of 12 kg/ha of ammonium sulphate [4]. Although wheat has a relatively low sulfur requirement, still deficiencies have been observed in many countries of the world [6]. Nitrogen and sulfur fertilization boosts yield compo- nents, phenology and leaf traits. Crop biomass and crop growth rate are dependent on the ability of the canopy to intercept incoming photo synthetically active radiations, which is the function of leaf area index (LAI), leaf area duration and canopy architecture and then converts these radiation into new biomass. Nitrogen availability influ- ences the efficiency of assimilated mobilization to sink during leaf senescence and thus affects leaf viability and activity [7]. Nitrogen addition increases the leaf archi- tecture from 7% to 19% at the lower sulfur rate, but at the highest sulfur supply, these increments range from 20% to 35%, evidencing a clear interaction between both nutrients [4]. Sulfur effects are evident between anthesis and physiological maturity increasing CGR by 51% [4]. An increase in leaf photosynthesis is expected when sul- fur supply is increased. LAI was reduced in crops grown under nitrogen deficiency. Increases in nitrogen and sul- fur contents of soil affect all growth stages of the crops. For example an increase in nitrogen concentration at an- thesis can result in an increase of LAI by as much as 62% and incoming photo synthetically active radiations by up to 20% [8]. The present study was therefore designed to investi- gate about contribution of soil and foliar fertilization of nitrogen and sulfur on physiological and quality assess- ment in two varieties of wheat. 2. MATERIALS AND METHODS 2.1. Site Description and Experimental Design Experiment was conducted at New Developmental Farm of The University of Agriculture Peshawar, Pakistan dur- ing 2008 and 2009. A basal dose of Phosphorus (100 kg/ha) and potassium (60 kg/ha) was applied at sowing. Urea was applied as a source for nitrogen and ammo- nium sulphate as a source for sulfur. Half dose of both urea and ammonium sulphate was applied at the time of sowing and the remaining half dose at different growth stages. The experiment was laid out in randomized com- plete block design having 4 replications. Subplots size was 5 m × 3 m having 10 rows 5 m long & 30 cm apart. Two varieties Pirsabaq-2005 & Khyber-87 were used in the study. 2.2. Fertilizer Treatments Details of the fertilizer treatments are as follows: T1 Control: without fertilization T2 Recommended dose of soil applied Nitrogen (60 kg·N/ha at sowing + 60 kg·N/ha at tillering) T3 Soil applied Nitrogen (60 kg·N/ha at sowing + 40 kg·N/ha at tillering + 10 kg·N/ha anthesis + 10 kg·N/ha after anthesis) T4 Soil + foliar applied Nitrogen [60 kg·N/ha at sow- ing + 40 kg·N/ha at tillering + 10 kg·N/ha at anthesis (foliar) + 10 kg·N/ha after anthesis (foliar)] T5 Soil applied Sulfur (15 kg·S/ha at sowing + 10 kg·S/ha at anthesis + 5 kg·S/ha after anthesis) T6 Soil + foliar applied Sulfur [(15 kg·S/ha at sowing + 10 kg·S/ha at anthesis (foliar) + 5 kg·S/ha after anthesis (foliar)] T7 Soil applied N + soil applied S (combination of soil applied N and soil applied S) T8 Soil and foliar applied N + soil and foliar applied S (combination of soil + foliar applied nitrogen and soil + foliar applied sulfur) The moisture content was determined by taking 5.0 g of thoroughly homogenized sample in a previously dried and weighted china dish. The china dish containing sam- ple was then allowed to dry in oven at 105˚C until a con- stant weight was obtained. Moisture content was calcu- lated by the formula: (Final weight − Initial weight/total weight) × 100. Protein in the sample was determined by Kjeldahl method. The samples were digested by heating with con- centrated sulphuric acid in the presence of digestion mix- ture. The mixture was then made alkaline. Ammonium sulphate thus formed was collected in 2% boric acid so- lution and titrated against standard HCI. Total protein was calculated by multiplying the amount of nitrogen with appropriate factor (5.7) and the amount of protein was calculated. LAI (tiller−1) was calculated by multiplying leaf area tiller−1 over tillers m−2 and divided by 10,000. For calculating CGR, 50 cm long row was harvested in each sub plot. Four samples each on one month inter- val was collected during the crop growing season from Copyright © 2013 SciRes. OPEN ACCESS  B. Saeed et al. / Natural Science 5 (2013) 1012-1018 Copyright © 2013 SciRes. 1014 tillering to physiological maturity. CGR was determined by using the formula: mum LAI (5.1) as compared with the other variety. The interaction effects of variety and fertilizer was also re- corded significant. Similarly the interaction of varieties and year was also found significant. From the means of planned comparison of two varieties it was observed that no fertilizer vs. fertilizers comparison showed significant result for LAI Figure 1(a). Similarly the effects of sulfur alone treatment was also found significant. 21 12 WW 1 CGR TT GA AGR was derived from the CGR. AGR was deter- mined by the formula. 21 21 WW AGR TT It is evident from the data that crude protein contents are significantly affected by fertilizer treatments Table 1. The maximum crude protein contents (12.82%) were found in those plots which were treated with T8 [Nitro- gen @ 60 kg·ha−1 at sowing + 40 kg·ha−1 at tillering + 10 kg·ha−1 at anthesis (spray) and 10 kg·ha−1 after anthesis (spray)] + [Sulfur @ 15 kg·ha−1 at sowing + 10 kg·ha−1 at anthesis (spray) + 5 kg·ha−1 after anthesis (spray)], while control plots showed minimum crude protein contents (9.53%). Results showed that fertilizer treatments and both the varieties of wheat observed non significant af- fect on crude protein contents. Similarly no significant differences were found among the mean values of varie- ties on the concern parameter. However from the results of planned comparison for crude protein it is evident that the comparison of no fertilizer vs. fertilizer treatment gave significant association Figure 1(b). Likewise sig- nificant differences were found among the mean values of recommended fertilizer vs. other fertilizer treatments comparison. The results of planned comparison of the 2.3. Statistical Analysis All data are presented as mean values of four repli- cates. Data were analyzed statistically for analysis of variance following the method of [9]. The significance of differences among means was compared by using Least Significance Difference Test [10]. 3. RESULTS The presented data about LAI revealed that significant differences were found among different treatments of sulfur and nitrogen combinations Ta ble 1 . Data showed that highest LAI (5.01) was observed in T5 (Sulfur @ 15 kg·ha−1 at sowing + 10 kg·ha−1 at anthesis + 5 kg·ha−1 after anthesis), while the lowest LAI (3.5) was found in T6 (Sulfur @ 15 kg·ha−1 at sowing + 10 kg·ha−1 at anthe- sis + 5 kg·ha−1 after anthesis). Pirsabaq-2005 gave maxi Table 1. Effects of various nitrogen and sulfur fertilizer treatments on physiological and quality assessment traits of two varieties of wheat. LAI CP (%) MC (%) Varieties Varieties Varieties Fertilizer Treatments PS-2005 Khyber-87 Mean PS-2005 Khyber-87 Mean PS-2005 Khyber-87 Mean Control (CK) (T1) 6.89a 3.10fg 4.999a9.303 9.767 9.535d8.0 8.0 8.0d Recommended dose (T2) 5.17b 3.97cde 4.577a9.799 10.059 9.929d 8.0 8.0 8.0d Soil applied N (T3) 4.50bc 3.33efg 3.917b11.727 10.374 11.05c8.0 8.0 8.0d Soil and foliar app l ie d N (T4) 3.82cdef 4.10cde 3.969b 12.211 11.181 11.696bc 9.0 8.75 8.9c Soil and foliar app l ie d N (T4) 7.10a 2.92g 5.016a 12.322 11.658 11.99ab 10.0 10.0 10.0b Soil and foliar applied S (T6) 5.19b 1.94h 3.567b12.289 12.201 12.24bc10.0 10.0 10.0b Combination of T3 & T5 (T7) 4.21cd 3.54defg 3.883b12.335 11.825 12.08ab 10.0 10.0 10.0b Combination of T4 & T6 (T8) 3.86cdef 3.65cdefg 3.763b 12.249 13.390 12.82a 11 . 0 10.75 10.9a Mean 5.10 10.9a - 11 . 4 9 11. 30 - 9.25 9.18 - 2008-09 5.2a 3.06c 4.13 11 . 4 9 11.57 11. 56 2009-10 4.99a 3.58b 4.29 11.49 11.03 11.26 9.25 9.18 9.21 LSD F 0.604 0.9058 0.126 V × F 0.855 - - Y × V 0.4273 - - Interactions P-Value P-Value P-Value Y × F 0.3125 0.1000 0.1000 Y × V × F 0.1333 0.4764 0.1000 *Mean of the same category followed by different letters is significantly different (P ≥ 0.05) using LSD test; LAI = Leaf Area Index, CP = Crude Protein, MC = Moisture Content, Y = Year, F = Fertilizer treatments; V = Variety, PS-2005 = Pirsabaq-2005, LSD = Least Significant Difference. OPEN ACCESS 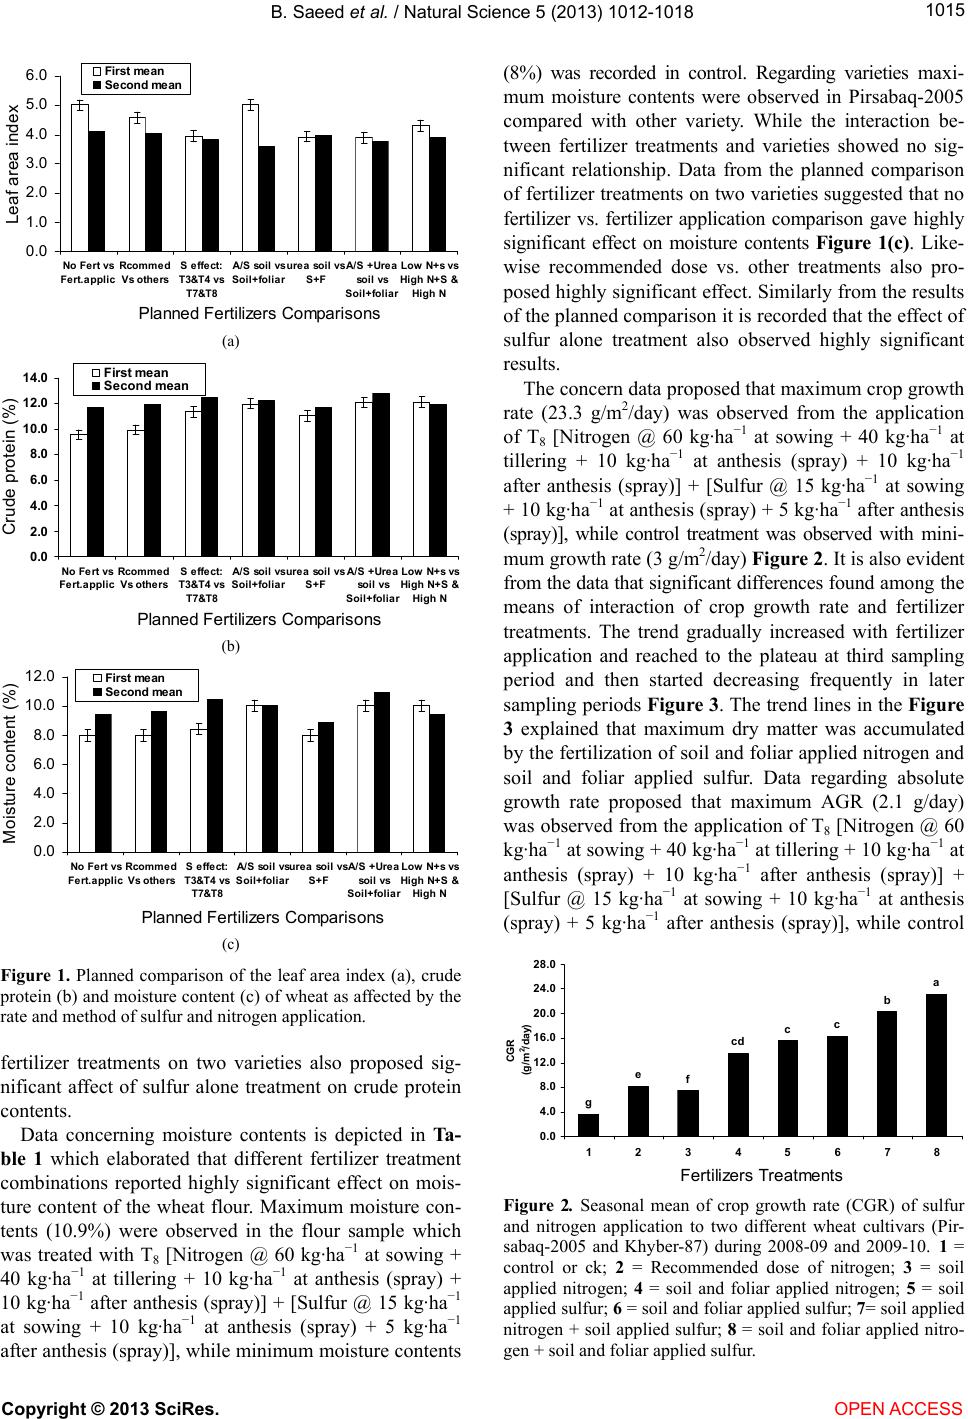 B. Saeed et al. / Natural Science 5 (2013) 1012-1018 1015 0.0 1.0 2.0 3.0 4.0 5.0 6.0 No Fert vs Fert.a pplic Rcommed Vs others S effect: T3&T4 vs T7&T8 A/S soil vs Soil+foliar urea soil vs S+F A/S +Urea soil vs Soil+foliar Low N+s vs High N+S & High N Planned Fertilizers Comparisons Leaf area index First mean Second mean (a) 0.0 2.0 4.0 6.0 8.0 10.0 12.0 14.0 No Fert vs Fert.a pplic Rcommed Vs others S effect: T3&T4 vs T7&T8 A/S soil vs Soil+foliar urea soil vs S+F A/S +Urea soil vs Soil+foliar Low N+s vs High N+S & High N Planned Fertilizers Comparisons Crude protein (% ) First mean Second mean (b) 0.0 2.0 4.0 6.0 8.0 10.0 12.0 No Fert vs Fert.a pplic Rcommed Vs others S effect: T3&T4 vs T7&T8 A/S soil vs Soil+foliar urea soil vs S+F A/S +Urea soil vs Soil+foliar Low N+s vs High N+S & High N P lanned Fertilizers Compariso ns Moi sture co ntent (% ) First mean Second mean (c) Figure 1. Planned comparison of the leaf area index (a), crude protein (b) and moisture content (c) of wheat as affected by the rate and method of sulfur and nitrogen application. fertilizer treatments on two varieties also proposed sig- nificant affect of sulfur alone treatment on crude protein contents. Data concerning moisture contents is depicted in Ta- ble 1 which elaborated that different fertilizer treatment combinations reported highly significant effect on mois- ture content of the wheat flour. Maximum moisture con- tents (10.9%) were observed in the flour sample which was treated with T8 [Nitrogen @ 60 kg·ha−1 at sowing + 40 kg·ha−1 at tillering + 10 kg·ha−1 at anthesis (spray) + 10 kg·ha−1 after anthesis (spray)] + [Sulfur @ 15 kg·ha−1 at sowing + 10 kg·ha−1 at anthesis (spray) + 5 kg·ha−1 after anthesis (spray)], while minimum moisture contents (8%) was recorded in control. Regarding varieties maxi- mum moisture contents were observed in Pirsabaq-2005 compared with other variety. While the interaction be- tween fertilizer treatments and varieties showed no sig- nificant relationship. Data from the planned comparison of fertilizer treatments on two varieties suggested that no fertilizer vs. fertilizer application comparison gave highly significant effect on moisture contents Figure 1(c). Like- wise recommended dose vs. other treatments also pro- posed highly significant effect. Similarly from the results of the planned comparison it is recorded that the effect of sulfur alone treatment also observed highly significant results. The concern data proposed that maximum crop growth rate (23.3 g/m2/day) was observed from the application of T8 [Nitrogen @ 60 kg·ha−1 at sowing + 40 kg·ha−1 at tillering + 10 kg·ha−1 at anthesis (spray) + 10 kg·ha−1 after anthesis (spray)] + [Sulfur @ 15 kg·ha−1 at sowing + 10 kg·ha−1 at anthesis (spray) + 5 kg·ha−1 after anthesis (spray)], while control treatment was observed with mini- mum growth rate (3 g/m2/day) Figure 2. It is also evident from the data that significant differences found among the means of interaction of crop growth rate and fertilizer treatments. The trend gradually increased with fertilizer application and reached to the plateau at third sampling period and then started decreasing frequently in later sampling periods Figure 3. The trend lines in the Figure 3 explained that maximum dry matter was accumulated by the fertilization of soil and foliar applied nitrogen and soil and foliar applied sulfur. Data regarding absolute growth rate proposed that maximum AGR (2.1 g/day) was observed from the application of T8 [Nitrogen @ 60 kg·ha−1 at sowing + 40 kg·ha−1 at tillering + 10 kg·ha−1 at anthesis (spray) + 10 kg·ha−1 after anthesis (spray)] + [Sulfur @ 15 kg·ha−1 at sowing + 10 kg·ha−1 at anthesis (spray) + 5 kg·ha−1 after anthesis (spray)], while control g f e cd cc b a 0.0 4.0 8.0 12.0 16.0 20.0 24.0 28.0 12345678 Fertilizers Treatments CGR (g/m 2 / d ay) Figure 2. Seasonal mean of crop growth rate (CGR) of sulfur and nitrogen application to two different wheat cultivars (Pir- sabaq-2005 and Khyber-87) during 2008-09 and 2009-10. 1 = control or ck; 2 = Recommended dose of nitrogen; 3 = soil applied nitrogen; 4 = soil and foliar applied nitrogen; 5 = soil applied sulfur; 6 = soil and foliar applied sulfur; 7= soil applied nitrogen + soil applied sulfur; 8 = soil and foliar applied nitro- gen + soil and foliar applied sulfur. Copyright © 2013 SciRes. OPEN ACCESS 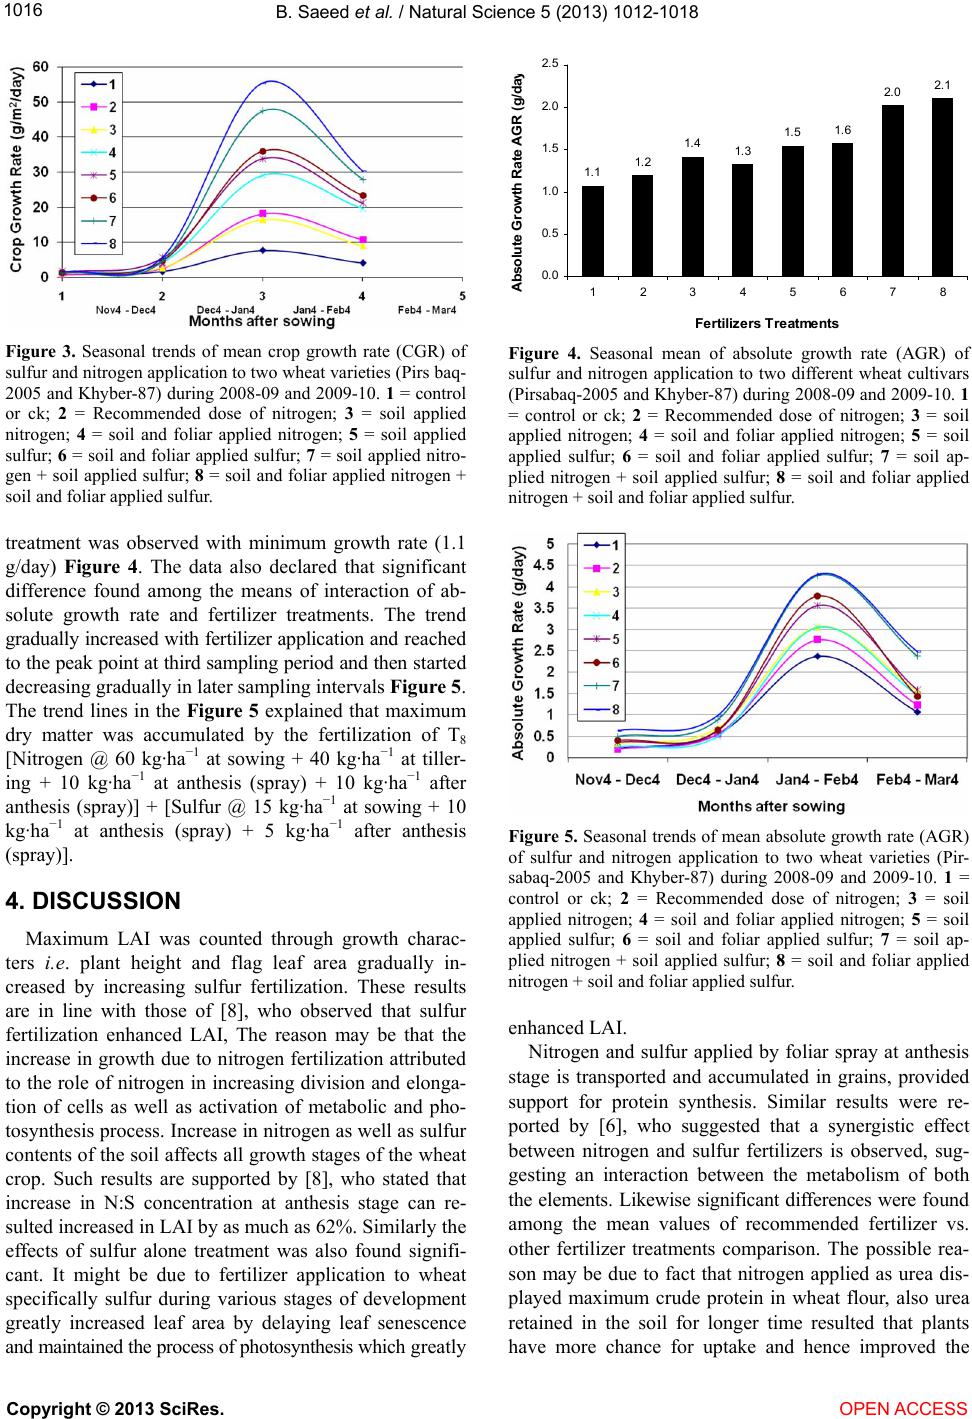 B. Saeed et al. / Natural Science 5 (2013) 1012-1018 1016 Figure 3. Seasonal trends of mean crop growth rate (CGR) of sulfur and nitrogen application to two wheat varieties (Pirs baq- 2005 and Khyber-87) during 2008-09 and 2009-10. 1 = control or ck; 2 = Recommended dose of nitrogen; 3 = soil applied nitrogen; 4 = soil and foliar applied nitrogen; 5 = soil applied sulfur; 6 = soil and foliar applied sulfur; 7 = soil applied nitro- gen + soil applied sulfur; 8 = soil and foliar applied nitrogen + soil and foliar applied sulfur. treatment was observed with minimum growth rate (1.1 g/day) Figure 4. The data also declared that significant difference found among the means of interaction of ab- solute growth rate and fertilizer treatments. The trend gradually increased with fertilizer application and reached to the peak point at third sampling period and then started decreasing gradually in later sampling intervals Figure 5. The trend lines in the Figure 5 explained that maximum dry matter was accumulated by the fertilization of T8 [Nitrogen @ 60 kg·ha−1 at sowing + 40 kg·ha−1 at tiller- ing + 10 kg·ha−1 at anthesis (spray) + 10 kg·ha−1 after anthesis (spray)] + [Sulfur @ 15 kg·ha−1 at sowing + 10 kg·ha−1 at anthesis (spray) + 5 kg·ha−1 after anthesis (spray)]. 4. DISCUSSION Maximum LAI was counted through growth charac- ters i.e. plant height and flag leaf area gradually in- creased by increasing sulfur fertilization. These results are in line with those of [8], who observed that sulfur fertilization enhanced LAI, The reason may be that the increase in growth due to nitrogen fertilization attributed to the role of nitrogen in increasing division and elonga- tion of cells as well as activation of metabolic and pho- tosynthesis process. Increase in nitrogen as well as sulfur contents of the soil affects all growth stages of the wheat crop. Such results are supported by [8], who stated that increase in N:S concentration at anthesis stage can re- sulted increased in LAI by as much as 62%. Similarly the effects of sulfur alone treatment was also found signifi- cant. It might be due to fertilizer application to wheat specifically sulfur during various stages of development greatly increased leaf area by delaying leaf senescence and maintained the process of photosynthesis which greatly 1.1 1.2 1.4 1.3 1.5 1. 6 2.0 2. 1 0.0 0.5 1.0 1.5 2.0 2.5 12345678 Fertilizers Treatments Absolute Growth Rate AGR (g/da y Figure 4. Seasonal mean of absolute growth rate (AGR) of sulfur and nitrogen application to two different wheat cultivars (Pirsabaq-2005 and Khyber-87) during 2008-09 and 2009-10. 1 = control or ck; 2 = Recommended dose of nitrogen; 3 = soil applied nitrogen; 4 = soil and foliar applied nitrogen; 5 = soil applied sulfur; 6 = soil and foliar applied sulfur; 7 = soil ap- plied nitrogen + soil applied sulfur; 8 = soil and foliar applied nitrogen + soil and foliar applied sulfur. Figure 5. Seasonal trends of mean absolute growth rate (AGR) of sulfur and nitrogen application to two wheat varieties (Pir- sabaq-2005 and Khyber-87) during 2008-09 and 2009-10. 1 = control or ck; 2 = Recommended dose of nitrogen; 3 = soil applied nitrogen; 4 = soil and foliar applied nitrogen; 5 = soil applied sulfur; 6 = soil and foliar applied sulfur; 7 = soil ap- plied nitrogen + soil applied sulfur; 8 = soil and foliar applied nitrogen + soil and foliar applied sulfur. enhanced LAI. Nitrogen and sulfur applied by foliar spray at anthesis stage is transported and accumulated in grains, provided support for protein synthesis. Similar results were re- ported by [6], who suggested that a synergistic effect between nitrogen and sulfur fertilizers is observed, sug- gesting an interaction between the metabolism of both the elements. Likewise significant differences were found among the mean values of recommended fertilizer vs. other fertilizer treatments comparison. The possible rea- son may be due to fact that nitrogen applied as urea dis- played maximum crude protein in wheat flour, also urea retained in the soil for longer time resulted that plants have more chance for uptake and hence improved the Copyright © 2013 SciRes. OPEN ACCESS 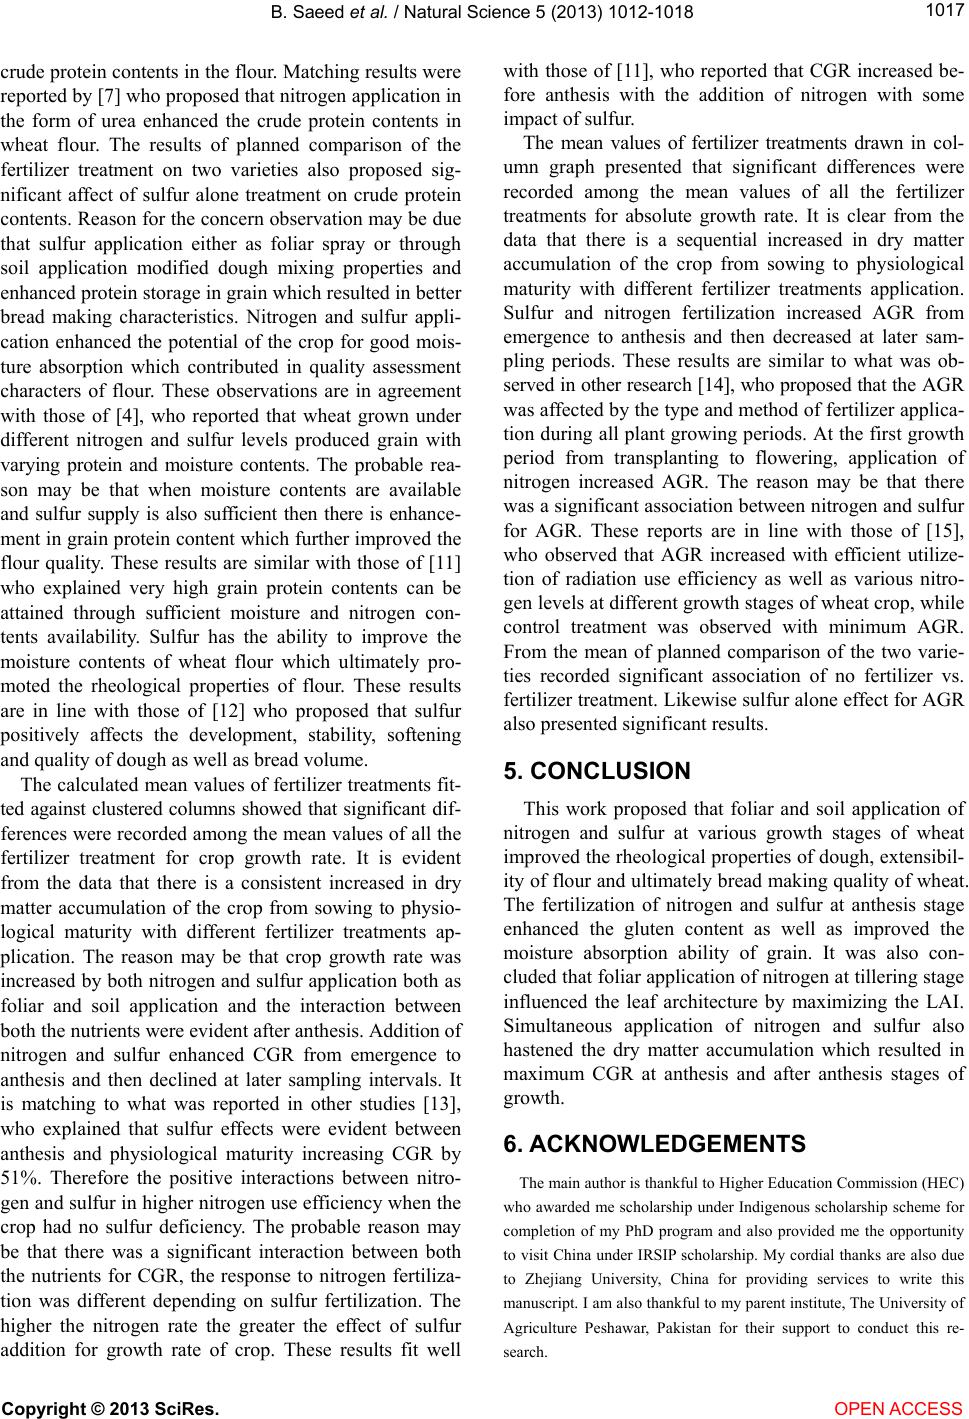 B. Saeed et al. / Natural Science 5 (2013) 1012-1018 1017 crude protein contents in the flour. Matching results were reported by [7] who proposed that nitrogen application in the form of urea enhanced the crude protein contents in wheat flour. The results of planned comparison of the fertilizer treatment on two varieties also proposed sig- nificant affect of sulfur alone treatment on crude protein contents. Reason for the concern observation may be due that sulfur application either as foliar spray or through soil application modified dough mixing properties and enhanced protein storage in grain which resulted in better bread making characteristics. Nitrogen and sulfur appli- cation enhanced the potential of the crop for good mois- ture absorption which contributed in quality assessment characters of flour. These observations are in agreement with those of [4], who reported that wheat grown under different nitrogen and sulfur levels produced grain with varying protein and moisture contents. The probable rea- son may be that when moisture contents are available and sulfur supply is also sufficient then there is enhance- ment in grain protein content which further improved the flour quality. These results are similar with those of [11] who explained very high grain protein contents can be attained through sufficient moisture and nitrogen con- tents availability. Sulfur has the ability to improve the moisture contents of wheat flour which ultimately pro- moted the rheological properties of flour. These results are in line with those of [12] who proposed that sulfur positively affects the development, stability, softening and quality of dough as well as bread volume. The calculated mean values of fertilizer treatments fit- ted against clustered columns showed that significant dif- ferences were recorded among the mean values of all the fertilizer treatment for crop growth rate. It is evident from the data that there is a consistent increased in dry matter accumulation of the crop from sowing to physio- logical maturity with different fertilizer treatments ap- plication. The reason may be that crop growth rate was increased by both nitrogen and sulfur application both as foliar and soil application and the interaction between both the nutrients were evident after anthesis. Addition of nitrogen and sulfur enhanced CGR from emergence to anthesis and then declined at later sampling intervals. It is matching to what was reported in other studies [13], who explained that sulfur effects were evident between anthesis and physiological maturity increasing CGR by 51%. Therefore the positive interactions between nitro- gen and sulfur in higher nitrogen use efficiency when the crop had no sulfur deficiency. The probable reason may be that there was a significant interaction between both the nutrients for CGR, the response to nitrogen fertiliza- tion was different depending on sulfur fertilization. The higher the nitrogen rate the greater the effect of sulfur addition for growth rate of crop. These results fit well with those of [11], who reported that CGR increased be- fore anthesis with the addition of nitrogen with some impact of sulfur. The mean values of fertilizer treatments drawn in col- umn graph presented that significant differences were recorded among the mean values of all the fertilizer treatments for absolute growth rate. It is clear from the data that there is a sequential increased in dry matter accumulation of the crop from sowing to physiological maturity with different fertilizer treatments application. Sulfur and nitrogen fertilization increased AGR from emergence to anthesis and then decreased at later sam- pling periods. These results are similar to what was ob- served in other research [14], who proposed that the AGR was affected by the type and method of fertilizer applica- tion during all plant growing periods. At the first growth period from transplanting to flowering, application of nitrogen increased AGR. The reason may be that there was a significant association between nitrogen and sulfur for AGR. These reports are in line with those of [15], who observed that AGR increased with efficient utilize- tion of radiation use efficiency as well as various nitro- gen levels at different growth stages of wheat crop, while control treatment was observed with minimum AGR. From the mean of planned comparison of the two varie- ties recorded significant association of no fertilizer vs. fertilizer treatment. Likewise sulfur alone effect for AGR also presented significant results. 5. CONCLUSION This work proposed that foliar and soil application of nitrogen and sulfur at various growth stages of wheat improved the rheological properties of dough, extensibil- ity of flour and ultimately bread making quality of wheat. The fertilization of nitrogen and sulfur at anthesis stage enhanced the gluten content as well as improved the moisture absorption ability of grain. It was also con- cluded that foliar application of nitrogen at tillering stage influenced the leaf architecture by maximizing the LAI. Simultaneous application of nitrogen and sulfur also hastened the dry matter accumulation which resulted in maximum CGR at anthesis and after anthesis stages of growth. 6. ACKNOWLEDGEMENTS The main author is thankful to Higher Education Commission (HEC) who awarded me scholarship under Indigenous scholarship scheme for completion of my PhD program and also provided me the opportunity to visit China under IRSIP scholarship. My cordial thanks are also due to Zhejiang University, China for providing services to write this manuscript. I am also thankful to my parent institute, The University of Agriculture Peshawar, Pakistan for their support to conduct this re- search. Copyright © 2013 SciRes. OPEN ACCESS 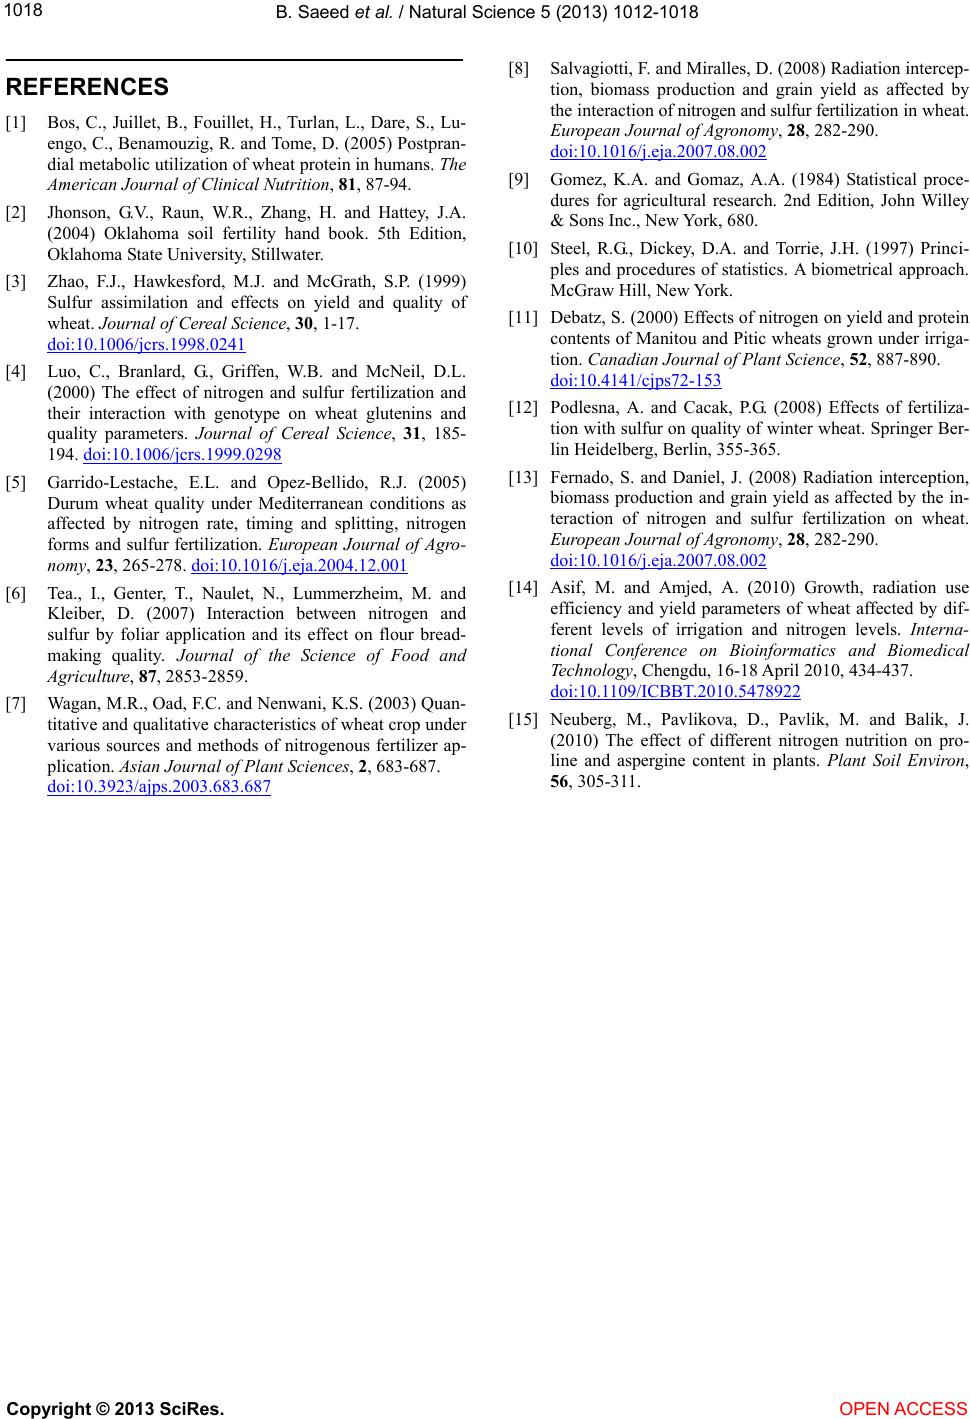 B. Saeed et al. / Natural Science 5 (2013) 1012-1018 Copyright © 2013 SciRes. 1018 [8] Salvagiotti, F. and Miralles, D. (2008) Radiation intercep- tion, biomass production and grain yield as affected by the interaction of nitrogen and sulfur fertilization in wheat. European Journal of Agronomy, 28, 282-290. doi:10.1016/j.eja.2007.08.002 REFERENCES [1] Bos, C., Juillet, B., Fouillet, H., Turlan, L., Dare, S., Lu- engo, C., Benamouzig, R. and Tome, D. (2005) Postpran- dial metabolic utilization of wheat protein in humans. The American Journal of Clinical Nutrition, 81, 87-94. [9] Gomez, K.A. and Gomaz, A.A. (1984) Statistical proce- dures for agricultural research. 2nd Edition, John Willey & Sons Inc., New York, 680. [2] Jhonson, G.V., Raun, W.R., Zhang, H. and Hattey, J.A. (2004) Oklahoma soil fertility hand book. 5th Edition, Oklahoma State University, Stillwater. [10] Steel, R.G., Dickey, D.A. and Torrie, J.H. (1997) Princi- ples and procedures of statistics. A biometrical approach. McGraw Hill, New York. [3] Zhao, F.J., Hawkesford, M.J. and McGrath, S.P. (1999) Sulfur assimilation and effects on yield and quality of wheat. Journal of Cereal Science, 30, 1-17. doi:10.1006/jcrs.1998.0241 [11] Debatz, S. (2000) Effects of nitrogen on yield and protein contents of Manitou and Pitic wheats grown under irriga- tion. Canadian Journal of Plant Scie nce, 52, 887-890. doi:10.4141/cjps72-153 [4] Luo, C., Branlard, G., Griffen, W.B. and McNeil, D.L. (2000) The effect of nitrogen and sulfur fertilization and their interaction with genotype on wheat glutenins and quality parameters. Journal of Cereal Science, 31, 185- 194. doi:10.1006/jcrs.1999.0298 [12] Podlesna, A. and Cacak, P.G. (2008) Effects of fertiliza- tion with sulfur on quality of winter wheat. Springer Ber- lin Heidelberg, Berlin, 355-365. [13] Fernado, S. and Daniel, J. (2008) Radiation interception, biomass production and grain yield as affected by the in- teraction of nitrogen and sulfur fertilization on wheat. European Journal of Agronomy, 28, 282-290. doi:10.1016/j.eja.2007.08.002 [5] Garrido-Lestache, E.L. and Opez-Bellido, R.J. (2005) Durum wheat quality under Mediterranean conditions as affected by nitrogen rate, timing and splitting, nitrogen forms and sulfur fertilization. European Journal of Agro- nomy, 23, 265-278. doi:10.1016/j.eja.2004.12.001 [14] Asif, M. and Amjed, A. (2010) Growth, radiation use efficiency and yield parameters of wheat affected by dif- ferent levels of irrigation and nitrogen levels. Interna- tional Conference on Bioinformatics and Biomedical Technology, Chengdu, 16-18 April 2010, 434-437. doi:10.1109/ICBBT.2010.5478922 [6] Tea., I., Genter, T., Naulet, N., Lummerzheim, M. and Kleiber, D. (2007) Interaction between nitrogen and sulfur by foliar application and its effect on flour bread- making quality. Journal of the Science of Food and Agriculture, 87, 2853-2859. [7] Wagan, M.R., Oad, F.C. and Nenwani, K.S. (2003) Quan- titative and qualitative characteristics of wheat crop under various sources and methods of nitrogenous fertilizer ap- plication. Asian Journal of Plant Sciences, 2, 683-687. doi:10.3923/ajps.2003.683.687 [15] Neuberg, M., Pavlikova, D., Pavlik, M. and Balik, J. (2010) The effect of different nitrogen nutrition on pro- line and aspergine content in plants. Plant Soil Environ, 56, 305-311. OPEN ACCESS |