

Paper Menu >>
Journal Menu >>
 World Journal of Cardiovascular Diseases, 2013, 3, 380-388 WJCD http://dx.doi.org/10.4236/wjcd.2013.35059 Published Online August 2013 (http://www.scirp.org/journal/wjcd/) Magnetocardiography capabilities in myocardium injuries diagnosis V. Sosnytskyy1, I. Chaikovsky2*, L. Stadnyuk3, G. Miasnykov2, A. Kazmirchyk2, T. Sosnytska2, O. Gurjeva1 1National Scientific Center, M. D. Strajesko Institute of Cardiology, Academy of Medical Sciences of Ukraine, Kiev, Ukraine 2General Military-Medical Clinical Center, Kiev, Ukraine 3P. L. Shupik National Medical Academy of Postgraduate Education, Kiev, Ukraine Email: *[email protected] Received 9 May 2013; revised 28 June 2013; accepted 15 July 2013 Copyright © 2013 V. Sosnytskyy et al. This is an open access article distributed under the Creative Commons Attribution License, which permits unrestricted use, distribution, and reproduction in any medium, provided the original work is properly cited. ABSTRACT Objective: The electrophysiological properties of the myocardium are extremely heterogeneous. Verifica- tion of new magnetocardiography (MCG) signs ap- pears an important aspect for severity assessment of ischemic myocardium damage, ischemic heart disease (IHD) course prognosis, determining of indications for preventive “aggressive” therapy and estimation of its efficacy in patients with IHD. The objective of this research was the investigation of magnetocardiogra- phy (MCG) capabilities in diagnosis of ischemic and inflammatory myocardial injuries using new MCG markers of the spatiotemporal organization of myo- cardium excitation. Methods and results: There were 128 patients examined in three groups. Group 1 con- tained 34 healthy volunteers. Group 2 contained 62 patients with IHD diagnosis. Group 3 included 32 comparatively young patients with acute myocarditis diagnosis. MCG-mapping of patients was performed at rest on the 7-channel MCG-scanners “Cardiomag- scan” V 3.1 (Company KMG, Ukraine) in non-shiel- ded MCG laboratory. 11 MCG markers were deter- mined for selected time intervals of the cardiac cycle. Obtained data provided evidences about significant differences in values of proposed MCG markers for various groups. In patients with AMI, rate of pa- rameters change is higher than without AMI (Sub-groups 2.1 and 2.2 differ by 8 MCG markers). Patients of 2nd and 3rd groups are different from healthy patients by 8 of 11 markers. Analysis of the obtained data has demonstrated good capabilities of MCG in differential diagnostics. Application of dis- criminatory analysis allowed us to get classification functions, which could be used (with 82% accuracy) to qualify the just examined patient to the investi- gated categories. Conclusion: Based on the new me- thodological approach during the studies, the most informative MCG-criteria of space-temporal organi- zation of myocardium excitation in patients with IHD has been proposed. The method is able to distinguish healthy subjects and myocarditis patients and pa- tients with IHD without previous MI with high sensi- tivity and specificity. Keywords: Transmural Electric Heterogeneity; Magnetocardiography; Myocardial Ischemia; Myocarditis; Differential Diagnostics 1. INTRODUCTION Nowadays routine clinic-functional diagnostic methods of ischemic heart disease (IHD) are mostly based on clinical signs of disease and ECG ST segment shift in rest and during functional tests. It is well known that changes of ST segment and T wave could be aroused not only from IHD, but also from many other diseases. Di- agnostic difficulties are frequently caused by abnormal clinical implication of IHD, including painless myocar- dial ischemia. Coronary angiography (CAG) still remains the basic method for IHD diagnosis. CAG is usually used for patients with IHD symptoms and with positive or controversial results of screening tests (stress ECG, stress echocardiography) in order to confirm availability and expansion of vascular injuries, for estimation of revas- cularization feasibility and adequacy, coronary athero- sclerosis progression or regression. At the same time, in being dependent of the population distinctions of the examined series, 19% to 57% of the examined patients may not have significant coronary artery stenosis [1]. *Corresponding author. Search and verification of new electrophysiological OPEN ACCESS  V. Sosnytskyy et al. / World Journal of Cardiovascular Diseases 3 (2013) 380-388 381 signs appears important aspects for severity assessment of ischemic myocardium damage, IHD course prognosis, determining of indications for preventive “aggressive” therapy and estimation of its efficacy in patients with IHD. Magnetocardiography (MCG) is a noninvasive measurement technology for magnetic signals generated by the heart’s electrical activity sources [2]. As compared to ECG, advantages of MCG are determined by its ex- treme sensitivity to tangential components of myocardial currents and lover (as opposed to ECG) dependency of monitored magnetic field parameters against the influ- ence of multilayer anisotropic conductive medium, sur- rounding the current source. Furthermore, MCG is sensi- tive to vortex flows (circular currents, injury currents), which couldn’t be registered with ECG at all. Thereby, MCG is able to detect activation disorders caused by myocardial ischemia more accurately and at an earlier stage than ECG [5]. During investigations of limitations of the IHD diagnosis at rest, it was determined that MCG exceeds ECG with diagnosis accuracy 60% - 90% for different examined populations [6-10]. Analysis of the current density distribution maps allowed to distinguish IHD-patients with and without haemodynamically sig- nificant stenosis with 62.8% sensitivity and 61.3% speci- ficity [7]. K. Toltstrup in his investigation of 75 patients with acute retrosternal pain notes that while stress EchoCG possesses sensitivity 91.3% and specificity 75%, MCG in rest possesses sensitivity 87.1% and specificity 85.7% [9]. As a result of investigation of the patients’ group with stable exertional angina before carrying out the coronary arteriography, Chen, et al. [10] have dem- onstrated the specificity of MCG scanning up to 97% and sensitivity—80% to 85%. During retrosternal pain in patients with complete block of the left bundle-branch, it is important to perform early diagnosis of acute coronary syndrome. Park, et al. [11] have identified high sensiti- vity and specificity of MCG as compared to Troponin I investigation. Non-coronary myocardial diseases, particularly myo- carditis, are often accompanied by expressed pain syn- drome, but clinically available practical methods of dif- ferential diagnostics are insufficiently informative. Objective of this research was to investigate MCG ca- pabilities in diagnosis of ischemic and inflammatory myocardial injuries using new MCG markers of the spa- tiotemporal organization of myocardium excitation. 2. MATERIALS AND METHODS 2.1. Basic Characteristics of Examined Patients There were 128 patients examined in three groups. Group 1 contained 34 healthy volunteers aged from 27 to 40 years (mean age 36 ± 6.4 years), passed through the comprehensive laboratory and instrumental research, including ECG at rest and post-exercise ECG, Echo-CG. Group 2 contained 62 patients with the diagnosis of IHD. The following criteria were used to exclude pa- tients from examination: complete block of the left bun- dle-branch on the ECG, Stage IIB-III of chronic heart failure, severe diabetes, Stage III of hypertensive disease, renal and hepatic failure, obstructive respiratory diseases, locomotorium diseases preventing exercise testing. Pa- tients of the Group 2 were divided into 2 Sub-groups (2.1 and 2.2). Sub-group 2.1 was composed on the base of random retrospective study of data obtained in examina- tion of 183 patients during 2001-2002 years in the Kath. Krankenhaus, Department of Medicine, Philippusstift (Essen, Germany). MCG examinations were performed using MCG system MCG-7 (SQUIG AG, Germany) with participation of authors of this paper as MCG-7 system developers. 30 patients with low-grade indications of IHD resulted from the clinical and instrumental research were selected from the common examined group. Se- lected patients had slightly changed ECG, neither myo- cardial infarction (MI) anamnesis, nor signs of myocar- dial hypertrophy according to Echo-CG results; thereat, according to the angiographic study data, stenosis of one, two or three vessels or of trunk of the left coronary artery with diameter less than 50% were detected in all of these patients. Mean age of examined patients was 55 ± 10 years. Sub-group 2.2. In order to estimate informative value of new MCG markers at rest in patients with acute MI (AMI) dependent on myocardial ischemia signs avail- ability, detected during exercise test, we have analyzed examination results of 32 patients with Q-wave AMI (30 man and 1 women) 31 - 70 years old (mean age 54.2 ± 1.8 years), which underwent medical treatment in the intensive care unit of the NSC “M. D. Strajesko Institute of Cardiology”, NAS of Ukraine. AMI diagnosis was determined on the base of standard criteria [12]. On the 10th - 12th day of AMI, patients were subjected to exer- cise examination (treadmill test under modified Bruce protocol using treadmill “Cardioperfect”, USA), and to MCG. During exercise test myocardial ischemia signs were detected in 21 patients (Sub-group 2.2A); in 11 patients (Sub-group 2.2B), test findings were negative. Sub-groups were comparable both by clinical-anamnesis data and by medical treatment. Group 3 included 32 comparatively young patients (17 to 29 years, mean age 23 ± 2.4 years), which underwent medical treatment in the non-coronary heart diseases and clinical rheumatology unit of NSC “M. D. Strajesko In- stitute of Cardiology”, NAS of Ukraine, and in the rheu- matology unit of General Military-Medical Clinical Center DM of Ukraine with acute myocarditis. “Myocar- ditis” was diagnosed on the base of disease relation with recently previous virus infection or presence of the chronic infection nidus in the body, results of clinical instrumental and laboratory researches and with account Copyright © 2013 SciRes. OPEN ACCESS  V. Sosnytskyy et al. / World Journal of Cardiovascular Diseases 3 (2013) 380-388 382 of diagnostic criteria, recommended by New York Heart Association. Young ages of patients make it possible to decrease significantly the IHD probability. 2.2. Magnetocardiography MCG-mapping of patients was performed at rest on the 7-channel MCG-scanners “Cardiomagscan” V 3.1 (Com- pany KMG, Ukraine) in non-shielded MCG laboratory premise of the NSC “M. D. Strajesko Institute of Cardi- ology”, NAS of Ukraine and in MCG laboratory of the General Military-Medical Clinical Center DM of Uk- raine. Magnetic field of the heart was registered in 36 points of the 8 cm pitch rectangular grid 3 × 3 with simultane- ous recording of the second standard ECG lead. On the base of 36 synchronous averaged MCG-curves momen- tary, equi-induction maps of magnetic field distribution were plotted using 2D interpolation algorithms. In con- trary to the previous MCG investigations using “inverse solution” algorithm, equi-induction maps of magnetic field distribution were transformed into current density vectors (CDV) distribution maps, followed-up by appli- cation of original indicants. Each CDV distribution map was used for calculation of single-step magnitudes of the maximal and global current density, and then curves were plotted represent- ing variations of these values during the overall cardiac cycle or its separate segments. Duration of the maximum CDV was used as the maximum density value (Max). Arithmetic sum of duration values of all CDV for given single-step map was used as the global current density magnitude (Sum). Every following point of the curves (separate single-step map) was plotted with 4 ms interval for ventricular depolarization and 10 ms for ventricular repolarization. Then cardio-cycle intervals durations were sequentionally calculated using current density variation curves. Time points when variation curves of maximum or global current density values reached zero line were considered as start and end of the time interval. More detailed description of this magnetic mapping technology and basic data interpretation concept is re- viewed in [13]. In order to estimate temporal organization of ventricu- lar depolarization, we have chosen the following MCG markers: 1) time interval duration from the start of the QRS complex to the R-wave peak—t1; 2) magnitude of the maximum (MaxR) and global (SumR) current densities at the R-wave peak; 3) depolarization interval duration—QRS; 4) angle difference between directions of the maxi- mum CDV at the R and T peaks—Delta RT In order to estimate disturbance ratio of the temporal organization of ventricular repolarization, we have cho- sen the following time intervals: 1) interval of the regional electric heterogeneity (be- ginning——of ST- Ta), which characterize the regional electric heterogene- ity of myocardium in the “ischemia window”; this interval was divided onto two sub-intervals D1 and D2, where deviation (displacement) of the maximum current density vector was estimated compared to its original value. In addition, at the moment of 80 ms from the J-point we have registered direction angle of the maximum current density vector and esti- mated its deviation from the normal direction limits (Delta 80); 2) myocardium transmural electric heterogeneity in- terval (Ta-e) was also splitted onto two equal sub-in- tervals D3 and D4, where deviation of the maximum cur- rent density vector was also estimated. 11 MCG markers {designations in tables} were deter- mined for selected time intervals of the cardiac cycle: {N1}—QRS—duration of the QRS complex (ms); {N2}— Delta 80—maximum current density vector deviation from the normal direction at 80 ms moment from the J-point; {N3}—D1; {N4}—D2; {N5}—D3; {N6}—D4 (D1, D2, D3, D4—maximum current density vector devia- tion at 4 ST-T sub-intervals (starting at 60 ms from the J-point)); {N7}—Ta-e—time interval duration from the peak to the end of Т-wave; {N8}—Delta RT—difference between direction angles of the maximum current density vector at R and T peaks; {N9}—SumR/SumТ—ratio of the global current density at the R-peak to the global current density at the T-peak; {N10}—MaxR/MaxТ— ratio of the global maximum current density at the R- peak to the maximum current density at the T-peak; {N11} —(QRS—t1)/t1—symmetry factor of the QRS complex. Obtained results were processed with variation and non-parametric statistics methods using applied statistics software packages “Microsoft Excel” and “Statistica” for Windows by calculation of arithmetic mean (M) and standard error of mean (m) values for each variation se- ries. Deviations validity was determined using Student’s t-criterion. Deviations were assumed valid for P < 0.05. Discriminatory analysis has been performed in order to determine possibility of results prognostication by MCG- data. The “model” was applied allowing prediction con- cerning the set particular patient would belong to. For this purpose we used step-by-step discriminatory analy- sis with inclusion of the variable with maximum contri- bution into differences between data sets at each analysis step. 2.3. Results Results of the primary data procession are listed in Ta- bles 1(a) and (b) and 2(a) and (b). Obtained data evidence about significant differences in values of proposed MCG markers for various groups. Thus, patients of Groups 2 and 3 differ from healthy pa- Copyright © 2013 SciRes. OPEN ACCESS 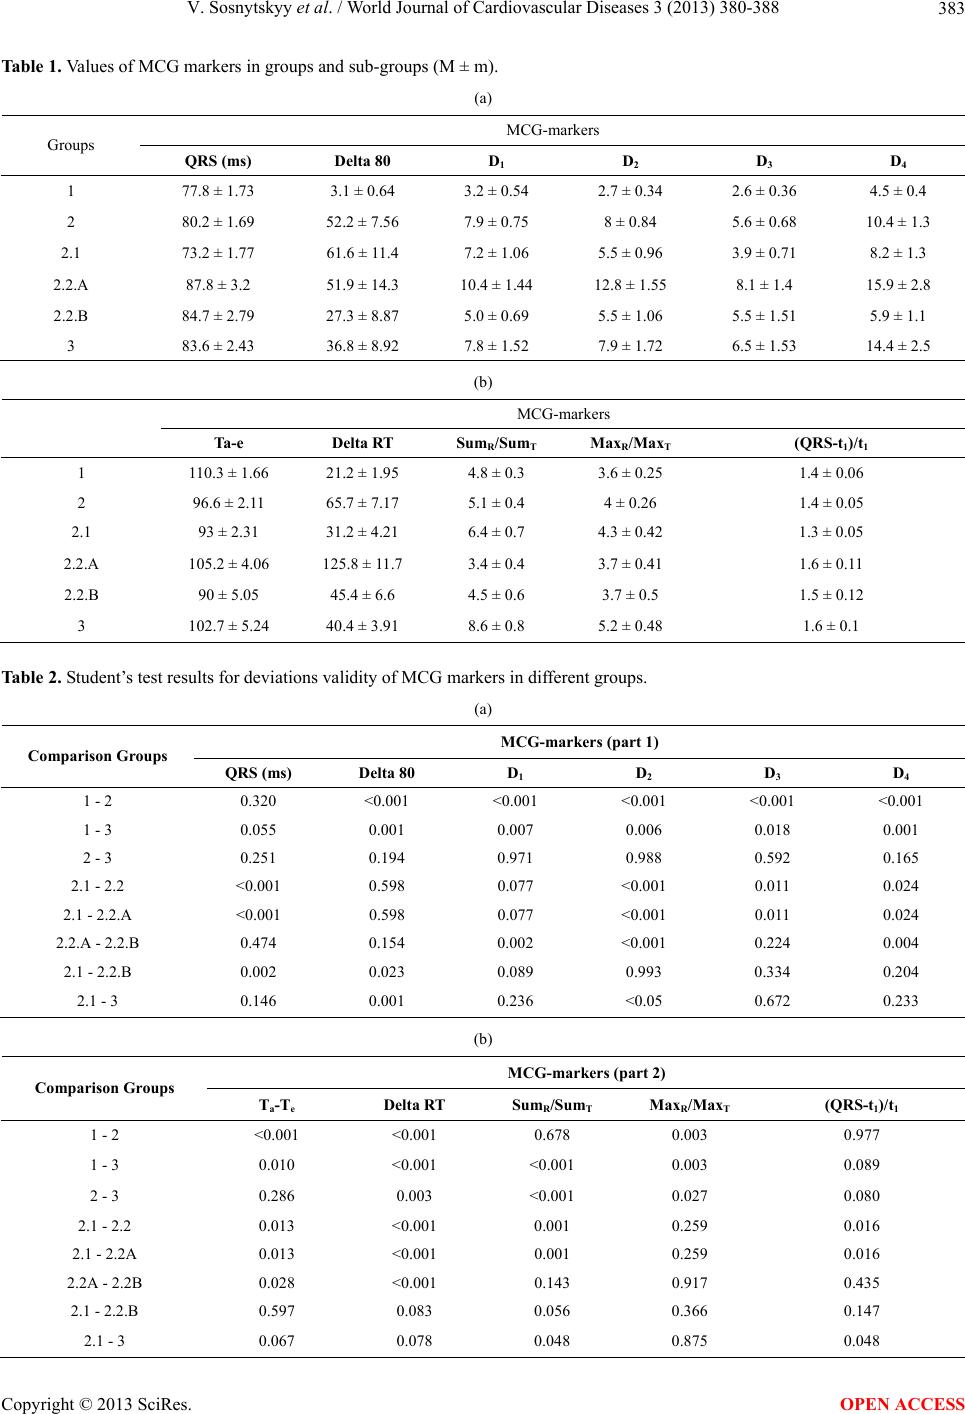 V. Sosnytskyy et al. / World Journal of Cardiovascular Diseases 3 (2013) 380-388 Copyright © 2013 SciRes. 383 OPEN ACCESS Table 1. Values of MCG markers in groups and sub-groups (M ± m). (a) MCG-markers Groups QRS (ms) Delta 80 D1 D 2 D 3 D 4 1 77.8 ± 1.73 3.1 ± 0.64 3.2 ± 0.54 2.7 ± 0.34 2.6 ± 0.36 4.5 ± 0.4 2 80.2 ± 1.69 52.2 ± 7.56 7.9 ± 0.75 8 ± 0.84 5.6 ± 0.68 10.4 ± 1.3 2.1 73.2 ± 1.77 61.6 ± 11.4 7.2 ± 1.06 5.5 ± 0.96 3.9 ± 0.71 8.2 ± 1.3 2.2.A 87.8 ± 3.2 51.9 ± 14.3 10.4 ± 1.44 12.8 ± 1.55 8.1 ± 1.4 15.9 ± 2.8 2.2.B 84.7 ± 2.79 27.3 ± 8.87 5.0 ± 0.69 5.5 ± 1.06 5.5 ± 1.51 5.9 ± 1.1 3 83.6 ± 2.43 36.8 ± 8.92 7.8 ± 1.52 7.9 ± 1.72 6.5 ± 1.53 14.4 ± 2.5 (b) MCG-markers Ta-e Delta RT SumR/SumT MaxR/MaxT (QRS-t1)/t1 1 110.3 ± 1.66 21.2 ± 1.95 4.8 ± 0.3 3.6 ± 0.25 1.4 ± 0.06 2 96.6 ± 2.11 65.7 ± 7.17 5.1 ± 0.4 4 ± 0.26 1.4 ± 0.05 2.1 93 ± 2.31 31.2 ± 4.21 6.4 ± 0.7 4.3 ± 0.42 1.3 ± 0.05 2.2.A 105.2 ± 4.06 125.8 ± 11.7 3.4 ± 0.4 3.7 ± 0.41 1.6 ± 0.11 2.2.B 90 ± 5.05 45.4 ± 6.6 4.5 ± 0.6 3.7 ± 0.5 1.5 ± 0.12 3 102.7 ± 5.24 40.4 ± 3.91 8.6 ± 0.8 5.2 ± 0.48 1.6 ± 0.1 Table 2. Student’s test results for deviations validity of MCG markers in different groups. (a) MCG-markers (part 1) Comparison Groups QRS (ms) Delta 80 D1 D 2 D 3 D 4 1 - 2 0.320 <0.001 <0.001 <0.001 <0.001 <0.001 1 - 3 0.055 0.001 0.007 0.006 0.018 0.001 2 - 3 0.251 0.194 0.971 0.988 0.592 0.165 2.1 - 2.2 <0.001 0.598 0.077 <0.001 0.011 0.024 2.1 - 2.2.A <0.001 0.598 0.077 <0.001 0.011 0.024 2.2.А - 2.2.B 0.474 0.154 0.002 <0.001 0.224 0.004 2.1 - 2.2.B 0.002 0.023 0.089 0.993 0.334 0.204 2.1 - 3 0.146 0.001 0.236 <0.05 0.672 0.233 (b) MCG-markers (part 2) Comparison Groups Ta-Te Delta RT SumR/SumT MaxR/MaxT (QRS-t1)/t1 1 - 2 <0.001 <0.001 0.678 0.003 0.977 1 - 3 0.010 <0.001 <0.001 0.003 0.089 2 - 3 0.286 0.003 <0.001 0.027 0.080 2.1 - 2.2 0.013 <0.001 0.001 0.259 0.016 2.1 - 2.2A 0.013 <0.001 0.001 0.259 0.016 2.2А - 2.2B 0.028 <0.001 0.143 0.917 0.435 2.1 - 2.2.B 0.597 0.083 0.056 0.366 0.147 2.1 - 3 0.067 0.078 0.048 0.875 0.048 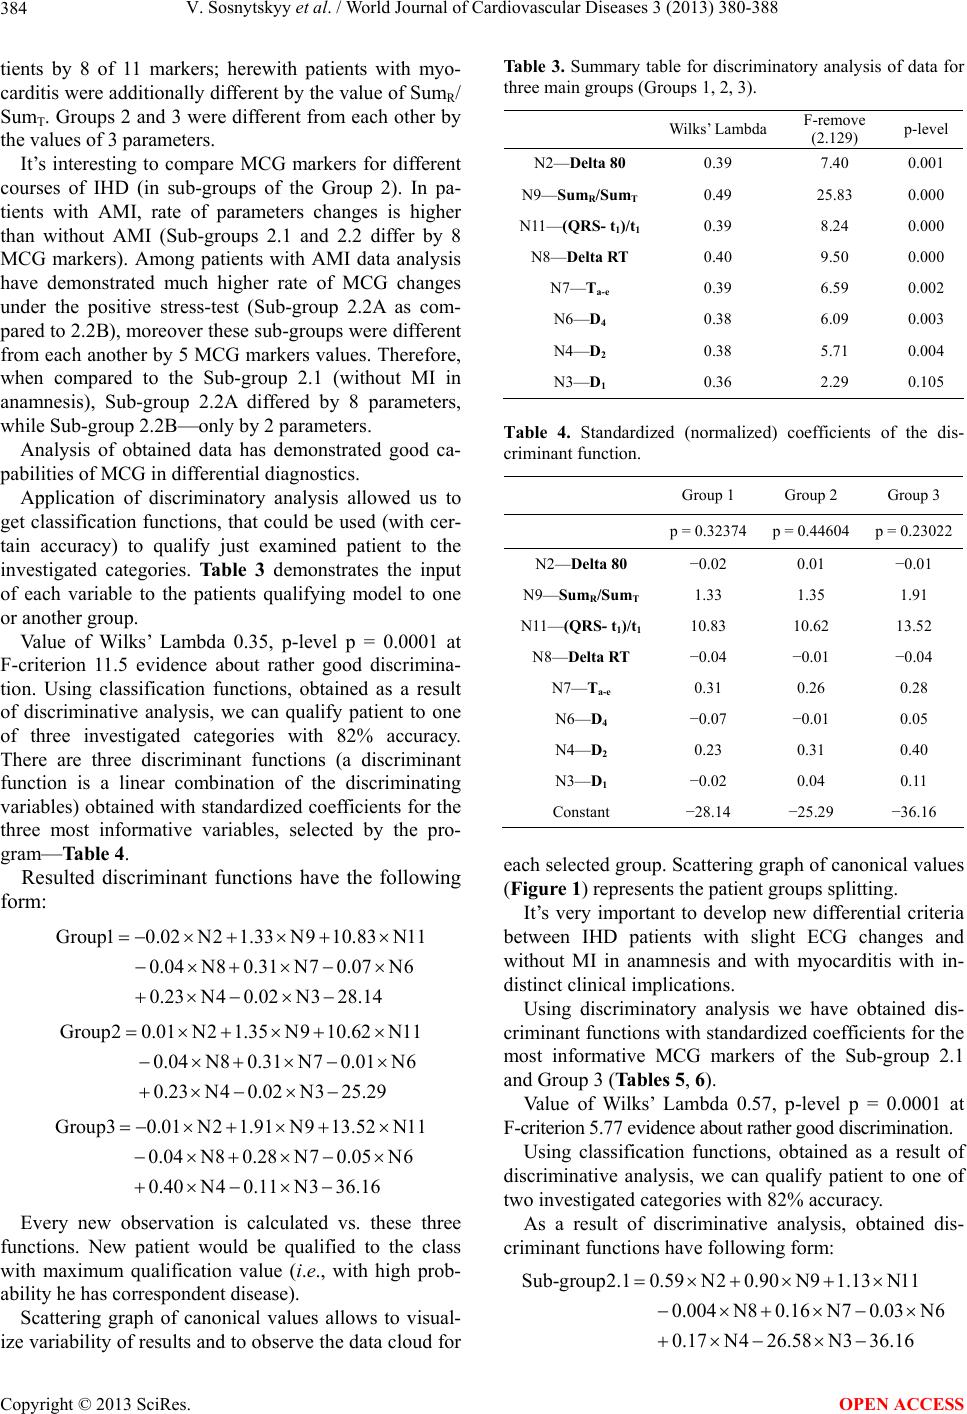 V. Sosnytskyy et al. / World Journal of Cardiovascular Diseases 3 (2013) 380-388 384 tients by 8 of 11 markers; herewith patients with myo- carditis were additionally different by the value of SumR/ SumT. Groups 2 and 3 were different from each other by the values of 3 parameters. It’s interesting to compare MCG markers for different courses of IHD (in sub-groups of the Group 2). In pa- tients with AMI, rate of parameters changes is higher than without AMI (Sub-groups 2.1 and 2.2 differ by 8 MCG markers). Among patients with AMI data analysis have demonstrated much higher rate of MCG changes under the positive stress-test (Sub-group 2.2A as com- pared to 2.2B), moreover these sub-groups were different from each another by 5 MCG markers values. Therefore, when compared to the Sub-group 2.1 (without MI in anamnesis), Sub-group 2.2A differed by 8 parameters, while Sub-group 2.2B—only by 2 parameters. Analysis of obtained data has demonstrated good ca- pabilities of MCG in differential diagnostics. Application of discriminatory analysis allowed us to get classification functions, that could be used (with cer- tain accuracy) to qualify just examined patient to the investigated categories. Table 3 demonstrates the input of each variable to the patients qualifying model to one or another group. Value of Wilks’ Lambda 0.35, p-level p = 0.0001 at F-criterion 11.5 evidence about rather good discrimina- tion. Using classification functions, obtained as a result of discriminative analysis, we can qualify patient to one of three investigated categories with 82% accuracy. There are three discriminant functions (a discriminant function is a linear combination of the discriminating variables) obtained with standardized coefficients for the three most informative variables, selected by the pro- gram—Table 4. Resulted discriminant functions have the following form: Group10.02N21.33 N9 10.83 N11 0.04 N80.31N70.07 N6 0.23 N40.02N328.14 Group20.01N2 1.35 N9 10.62N11 0.04N80.31N70.01 N6 0.23 N40.02N325.29 Group30.01 N2 1.91 N9 13.52N11 0.04N80.28 N70.05 N6 0.40N40.11 N336.16 Every new observation is calculated vs. these three functions. New patient would be qualified to the class with maximum qualification value (i.e., with high prob- ability he has correspondent disease). Scattering graph of canonical values allows to visual- ize variability of results and to observe the data cloud for Table 3. Summary table for discriminatory analysis of data for three main groups (Groups 1, 2, 3). Wilks’ Lambda F-remove (2.129) p-level N2—Delta 80 0.39 7.40 0.001 N9—SumR/SumТ 0.49 25.83 0.000 N11—(QRS- t1)/t10.39 8.24 0.000 N8—Delta RT 0.40 9.50 0.000 N7—Ta-e 0.39 6.59 0.002 N6—D4 0.38 6.09 0.003 N4—D2 0.38 5.71 0.004 N3—D1 0.36 2.29 0.105 Table 4. Standardized (normalized) coefficients of the dis- criminant function. Group 1 Group 2 Group 3 p = 0.32374 p = 0.44604 p = 0.23022 N2—Delta 80 −0.02 0.01 −0.01 N9—SumR/SumТ 1.33 1.35 1.91 N11—(QRS- t1)/t1 10.83 10.62 13.52 N8—Delta RT −0.04 −0.01 −0.04 N7—Ta-e 0.31 0.26 0.28 N6—D4 −0.07 −0.01 0.05 N4—D2 0.23 0.31 0.40 N3—D1 −0.02 0.04 0.11 Constant −28.14 −25.29 −36.16 each selected group. Scattering graph of canonical values (Figure 1) represents the patient groups splitting. It’s very important to develop new differential criteria between IHD patients with slight ECG changes and without MI in anamnesis and with myocarditis with in- distinct clinical implications. Using discriminatory analysis we have obtained dis- criminant functions with standardized coefficients for the most informative MCG markers of the Sub-group 2.1 and Group 3 (Tables 5, 6). Value of Wilks’ Lambda 0.57, p-level p = 0.0001 at F-criterion 5.77 evidence about rather good discrimination. Using classification functions, obtained as a result of discriminative analysis, we can qualify patient to one of two investigated categories with 82% accuracy. As a result of discriminative analysis, obtained dis- criminant functions have following form: Sub-group2.10.59N20.90N9 1.13 N11 0.004 N8 0.16 N70.03N6 0.17 N426.58 N3 36.16 Copyright © 2013 SciRes. OPEN ACCESS 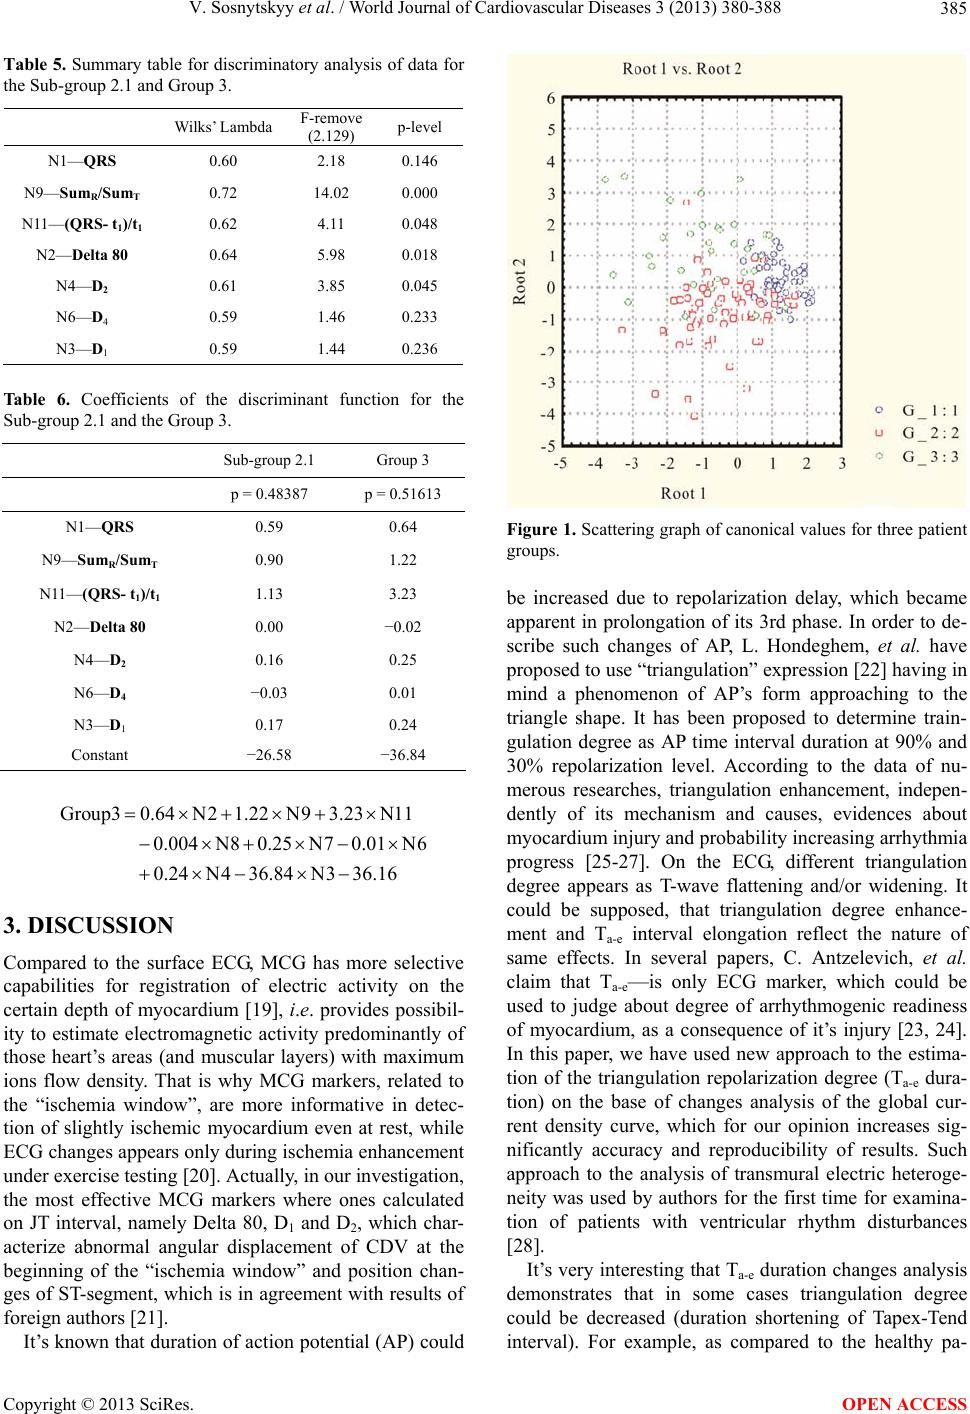 V. Sosnytskyy et al. / World Journal of Cardiovascular Diseases 3 (2013) 380-388 385 Table 5. Summary table for discriminatory analysis of data for the Sub-group 2.1 and Group 3. Wilks’ Lambda F-remove (2.129) p-level N1—QRS 0.60 2.18 0.146 N9—SumR/SumТ 0.72 14.02 0.000 N11—(QRS- t1)/t1 0.62 4.11 0.048 N2—Delta 80 0.64 5.98 0.018 N4—D2 0.61 3.85 0.045 N6—D4 0.59 1.46 0.233 N3—D1 0.59 1.44 0.236 Table 6. Coefficients of the discriminant function for the Sub-group 2.1 and the Group 3. Sub-group 2.1 Group 3 p = 0.48387 p = 0.51613 N1—QRS 0.59 0.64 N9—SumR/SumТ 0.90 1.22 N11—(QRS- t1)/t1 1.13 3.23 N2—Delta 80 0.00 −0.02 N4—D2 0.16 0.25 N6—D4 −0.03 0.01 N3—D1 0.17 0.24 Constant −26.58 −36.84 Group30.64 N21.22 N93.23N11 0.004N80.25 N70.01 N6 0.24 N4 36.84 N336.16 3. DISCUSSION Compared to the surface ECG, MCG has more selective capabilities for registration of electric activity on the certain depth of myocardium [19], i.e. provides possibil- ity to estimate electromagnetic activity predominantly of those heart’s areas (and muscular layers) with maximum ions flow density. That is why MCG markers, related to the “ischemia window”, are more informative in detec- tion of slightly ischemic myocardium even at rest, while ECG changes appears only during ischemia enhancement under exercise testing [20]. Actually, in our investigation, the most effective MCG markers where ones calculated on JT interval, namely Delta 80, D1 and D2, which char- acterize abnormal angular displacement of CDV at the beginning of the “ischemia window” and position chan- ges of ST-segment, which is in agreement with results of foreign authors [21]. It’s known that duration of action potential (AP) could Figure 1. Scattering graph of canonical values for three patient groups. be increased due to repolarization delay, which became apparent in prolongation of its 3rd phase. In order to de- scribe such changes of AP, L. Hondeghem, et al. have proposed to use “triangulation” expression [22] having in mind a phenomenon of AP’s form approaching to the triangle shape. It has been proposed to determine train- gulation degree as AP time interval duration at 90% and 30% repolarization level. According to the data of nu- merous researches, triangulation enhancement, indepen- dently of its mechanism and causes, evidences about myocardium injury and probability increasing arrhythmia progress [25-27]. On the ECG, different triangulation degree appears as T-wave flattening and/or widening. It could be supposed, that triangulation degree enhance- ment and Ta-e interval elongation reflect the nature of same effects. In several papers, C. Antzelevich, et al. claim that Ta-e—is only ECG marker, which could be used to judge about degree of arrhythmogenic readiness of myocardium, as a consequence of it’s injury [23, 24]. In this paper, we have used new approach to the estima- tion of the triangulation repolarization degree (Ta-e dura- tion) on the base of changes analysis of the global cur- rent density curve, which for our opinion increases sig- nificantly accuracy and reproducibility of results. Such approach to the analysis of transmural electric heteroge- neity was used by authors for the first time for examina- tion of patients with ventricular rhythm disturbances [28]. It’s very interesting that Ta-e duration changes analysis demonstrates that in some cases triangulation degree could be decreased (duration shortening of Tapex-Tend interval). For example, as compared to the healthy pa- Copyright © 2013 SciRes. OPEN ACCESS 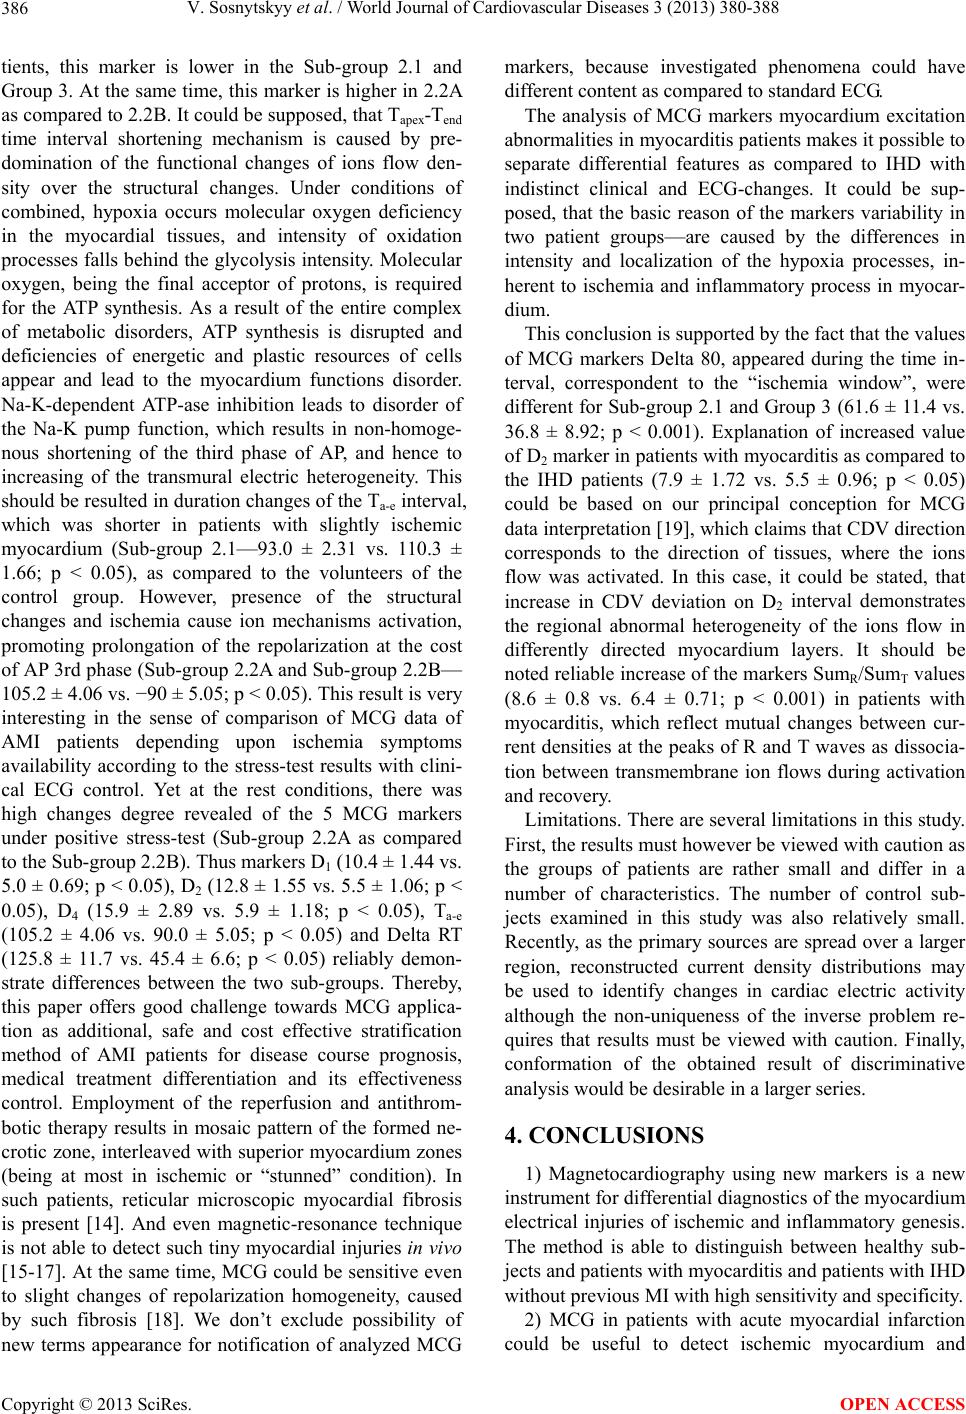 V. Sosnytskyy et al. / World Journal of Cardiovascular Diseases 3 (2013) 380-388 386 tients, this marker is lower in the Sub-group 2.1 and Group 3. At the same time, this marker is higher in 2.2A as compared to 2.2B. It could be supposed, that Tapex-Tend time interval shortening mechanism is caused by pre- domination of the functional changes of ions flow den- sity over the structural changes. Under conditions of combined, hypoxia occurs molecular oxygen deficiency in the myocardial tissues, and intensity of oxidation processes falls behind the glycolysis intensity. Molecular oxygen, being the final acceptor of protons, is required for the ATP synthesis. As a result of the entire complex of metabolic disorders, ATP synthesis is disrupted and deficiencies of energetic and plastic resources of cells appear and lead to the myocardium functions disorder. Na-K-dependent ATP-ase inhibition leads to disorder of the Na-K pump function, which results in non-homoge- nous shortening of the third phase of AP, and hence to increasing of the transmural electric heterogeneity. This should be resulted in duration changes of the Ta-e interval, which was shorter in patients with slightly ischemic myocardium (Sub-group 2.1—93.0 ± 2.31 vs. 110.3 ± 1.66; p < 0.05), as compared to the volunteers of the control group. However, presence of the structural changes and ischemia cause ion mechanisms activation, promoting prolongation of the repolarization at the cost of AP 3rd phase (Sub-group 2.2A and Sub-group 2.2B— 105.2 ± 4.06 vs. −90 ± 5.05; p < 0.05). This result is very interesting in the sense of comparison of MCG data of AMI patients depending upon ischemia symptoms availability according to the stress-test results with clini- cal ECG control. Yet at the rest conditions, there was high changes degree revealed of the 5 MCG markers under positive stress-test (Sub-group 2.2A as compared to the Sub-group 2.2B). Thus markers D1 (10.4 ± 1.44 vs. 5.0 ± 0.69; p < 0.05), D2 (12.8 ± 1.55 vs. 5.5 ± 1.06; p < 0.05), D4 (15.9 ± 2.89 vs. 5.9 ± 1.18; p < 0.05), Ta-e (105.2 ± 4.06 vs. 90.0 ± 5.05; p < 0.05) and Delta RT (125.8 ± 11.7 vs. 45.4 ± 6.6; p < 0.05) reliably demon- strate differences between the two sub-groups. Thereby, this paper offers good challenge towards MCG applica- tion as additional, safe and cost effective stratification method of AMI patients for disease course prognosis, medical treatment differentiation and its effectiveness control. Employment of the reperfusion and antithrom- botic therapy results in mosaic pattern of the formed ne- crotic zone, interleaved with superior myocardium zones (being at most in ischemic or “stunned” condition). In such patients, reticular microscopic myocardial fibrosis is present [14]. And even magnetic-resonance technique is not able to detect such tiny myocardial injuries in vivo [15-17]. At the same time, MCG could be sensitive even to slight changes of repolarization homogeneity, caused by such fibrosis [18]. We don’t exclude possibility of new terms appearance for notification of analyzed MCG markers, because investigated phenomena could have different content as compared to standard ECG. The analysis of MCG markers myocardium excitation abnormalities in myocarditis patients makes it possible to separate differential features as compared to IHD with indistinct clinical and ECG-changes. It could be sup- posed, that the basic reason of the markers variability in two patient groups—are caused by the differences in intensity and localization of the hypoxia processes, in- herent to ischemia and inflammatory process in myocar- dium. This conclusion is supported by the fact that the values of MCG markers Delta 80, appeared during the time in- terval, correspondent to the “ischemia window”, were different for Sub-group 2.1 and Group 3 (61.6 ± 11.4 vs. 36.8 ± 8.92; p < 0.001). Explanation of increased value of D2 marker in patients with myocarditis as compared to the IHD patients (7.9 ± 1.72 vs. 5.5 ± 0.96; p < 0.05) could be based on our principal conception for MCG data interpretation [19], which claims that CDV direction corresponds to the direction of tissues, where the ions flow was activated. In this case, it could be stated, that increase in CDV deviation on D2 interval demonstrates the regional abnormal heterogeneity of the ions flow in differently directed myocardium layers. It should be noted reliable increase of the markers SumR/SumT values (8.6 ± 0.8 vs. 6.4 ± 0.71; p < 0.001) in patients with myocarditis, which reflect mutual changes between cur- rent densities at the peaks of R and T waves as dissocia- tion between transmembrane ion flows during activation and recovery. Limitations. There are several limitations in this study. First, the results must however be viewed with caution as the groups of patients are rather small and differ in a number of characteristics. The number of control sub- jects examined in this study was also relatively small. Recently, as the primary sources are spread over a larger region, reconstructed current density distributions may be used to identify changes in cardiac electric activity although the non-uniqueness of the inverse problem re- quires that results must be viewed with caution. Finally, conformation of the obtained result of discriminative analysis would be desirable in a larger series. 4. CONCLUSIONS 1) Magnetocardiography using new markers is a new instrument for differential diagnostics of the myocardium electrical injuries of ischemic and inflammatory genesis. The method is able to distinguish between healthy sub- jects and patients with myocarditis and patients with IHD without previous MI with high sensitivity and specificity. 2) MCG in patients with acute myocardial infarction could be useful to detect ischemic myocardium and Copyright © 2013 SciRes. OPEN ACCESS  V. Sosnytskyy et al. / World Journal of Cardiovascular Diseases 3 (2013) 380-388 387 hence, to determine revasculization feasibility. REFERENCES [1] Kemp, H.G., Kronmal, R.A., Vietstra, R.E. and Frye, R.L. (1986) Seven year survival of patients with normal coro- nary arteriograms: A CASS registry study. Journal of the American College of Cardiology, 7, 479-483. doi:10.1016/S0735-1097(86)80456-9 [2] Malmivuo, J. and Plonsey, R. (1995) Bioelectromagnet- ism: Principles and applications of bioelectric and bio- magnetic fields. New York: Oxford University Press. doi:10.1093/acprof:oso/9780195058239.001.0001 [3] Stroink, G., Moshage, W. and Achenbach, S. (1998) Car- diomagnetism. In: Andr. W. and Nowak, H., Eds., Mag- netism in Medicine, Wiley-VCH, Berlin, 136-189. [4] Tavarozzi, I., Comani, S., Del Gratta, C., Di Luzio, S., Romani, G.L., Gallina, S., et al. (2002) Magneto-cardio- graphy: Current status and perspectives. Part II: Clinical applications. Italian Heart Journal, 3, 151-165. [5] Fenici, R., Brisinda, D. and Meloni, A.M. (2005) Clinical application of magnetocardiography. Expert Review of Molecular Diagnostics, 5, 291-313. doi:10.1586/14737159.5.3.291 [6] Van Leeuwen, P., Hailer, B., Lange, S. and Grцnemeyer, D. (2003) Spatial distribution of repolarization times in patients with coronary artery disease. Pacing and Clinical Electrophysiology, 26, 1706-1714. doi:10.1046/j.1460-9592.2003.t01-1-00256.x [7] Hailer, B., Chaikovsky, I., Auth-Eisernitz, S., Schafer, H. and Van Leeuwen, P. (2005) The value of magnetocar- diography in patients with and without relevant stenoses of the coronary arteries using an unshielded system. Pac- ing and Clinical Electrophysiology, 28, 8-11. d oi:10.1111/j.15 40-8159.2005.09318.x [8] Park, J.W., Hill, P.M., Chung, N., Hugenholtz, P.G. and Jung, F. (2005) Magnetocardiography predicts coronary artery disease in patients with acute chest pain. Annals of Noninvasive Electrocardiology, 10, 312-323. d oi:10.1111/j.15 42-474X.2005.00634.x [9] Tolstrup, K., Madsen, B.E., Ruiz, J.A., Greenwood, S.D, Camacho, J., Siegel, R.J., et al. (2006) Non-invasive rest- ing magnetocardiographic imaging for the rapid detection of ischemia in subjects presenting with chest pain. Cardi- ology, 106, 270-276. doi:10.1159/000093490 [10] Chen, Y. (2005) Resting magnetocardiographic imaging can accurately detect obstructive coronary artery disease in patient with chronic ischaemia. Journal of the Ameri- can College of Cardiology, 45, 27-69. [11] Park, J.W. et al. (2005) Magnetocardiography predicts coronary artery disease in bundle brunch block patients with acute chest pain. Journal of Electrocardiology, 40, S53. [12] Van de Werf, F., Ardissino, D., Betriu, A. et al. (2003) Management of acute myocardial infarction in patients presenting with ST-segment elevation: The task force on the management of acute myocardial infarction of the european society of cardiology. European Heart Jour- nal, 24, 28-66. doi:10.1016/S0195-668X(02)00618-8 [13] Sosnytskyy, V.M., Vojtovich, I.D., Bojchak, M.P., My- asnikov, G.V., Chaikovsky, I.A. and Sosnitskaya, T.V. (2011) Magnetic mapping of the heart-new information technology of noninvasive electrophysiology. Reports of the National Academy of Sciences of Ukraine, 1, 166-171. [14] Ertl, G. and Frantz, S. (2005) Healing after myocardial infarction. Cardiovascular Research, 66, 22-32, doi:10.1016/j.cardiores.2005.01.011 [15] Casolo G., Minneci S., Manta R., et al. (2006) Identifica- tion of the ischemic etiology of heart failure by cardio- vascular magnetic resonance imaging: Diagnostic accu- racy of late gadolinium enhancement. American Heart Journal, 151, 101-108. doi:10.1016/j.ahj.2005.03.068 [16] Ibrahim, T., Bulow, H.P., Hackl, T., et al. (2006) Diag- nostic value of contrast-enhanced magnetic resonance imaging and single-photon emission computed tomo- gramphy for detection of myocardial necrosis early after acute myocardial infarction. Journal of the American College of Cardiology, 49, 208-216. [17] Kaandorp, T.A., Lamb, H.J., Viergever, E.P., et al. (2007) Scar tissue on contrast-enhanced MRI predicts left ven- tricular remodelling after acute infarction. Heart, 93, 375- 376. doi:10.1136/hrt.2006.097675 [18] Goerning, M., Liehr, M., Tute, C., Schlosser, M., Haueisen, J., Figulla, H. and Leder, U. (2009) Magneto- cardiography based spatiotemporal correlation analysis is superior to conventional ECG analysis for identifying myocardial injury. Annals of Biomedical Engineering, 37, 107-111. doi:10.1007/s10439-008-9598-5 [19] Sosnitskiy, V.N., Stadnyuk, L.A. and Sosnitskaya, T.V. (2004) Magnetocardiography: New insights onto old ideas. Heart and Vessels, 4, 73-78. [20] Ikefuji, H., Nomura, M., Nakaya, Y. et al. (2007) Visu- alization of cardiac dipole using a current density map: Detection of cardiac current undetectable by electrocar- diography using magnetocardiography. Journal of Inves- tigative Medicine, 54, 116-123. doi:10.2152/jmi.54.116 [21] Jarusevicius, G., Navickas, R., Vainoras, A. et al.( 2004) JT interval changes in acute myocardial infarction fol- lowing coronary angioplasty, Medicina (Kaunas), 40, 90- 93. [22] Hondeghem, L.M., Carlsson, L., Duker, G. (2001) Insta- bility and triangulation of the action potential predict se- rious proarrhythmia, but action potential duration pro- longation is antiarrhythmic. Circulation, 103, 2004-2013. doi:10.1161/01.CIR.103.15.2004 [23] Antzelevitch, С. (2005) Modulation of transmural repo- larization. Annals of the New York Academy of Sciences, 1047, 314-323 [24] Emori, T. and Antzelevitch, C. (2001) Cellular basis for complex T wave and arrhythmic activity following com- bined I (kr) and I (ks) block. Journal of Cardiovascular Electrophysiology, 12, 1369-1378. doi:10.1046/j.1540-8167.2001.01369.x [25] Lu, H.R., Vlaminckx, E., Van Ammel, K., De Clerck, F. (2002) Drug—induced long QT in isolated rabbit Pur- kinje fibers: Importance of action potential duration, tri- Copyright © 2013 SciRes. OPEN ACCESS  V. Sosnytskyy et al. / World Journal of Cardiovascular Diseases 3 (2013) 380-388 Copyright © 2013 SciRes. 388 OPEN ACCESS angulation and early after depolarization. European Jour- nal of Pharmacology, 452, 183-152. doi:10.1016/S0014-2999(02)02246-X [26] Milberg, P., Hilker, E., Ramtin, S., et al. (2007) Proar- rhythmia as a class effect of quinolones: Increased dis- persion of repolarization and triangulation of action po- tential predict torsades de points. Journal of Cardiovas- cular Electrophysiology, 18, 647-654. d oi:10.1111/j.15 40-8167.2007.00793.x [27] Kuzmin, V.S. and Rozenshtraukh, L.V. (2010) Ionic me- chanisms as action of the III class antiarrhythmic drugs. Cardiology, 7, 49-61. [28] Sosnytskyy, V.M., Stadnyuk, L.A. and Sosnytska, T.V. (2010) Detection of the Ca2+ overload in patients pre- senting with delayed aftedepolarization using cardiac magnetic field mapping at rest. European Heart Journal, 31(Abstract Supplement), 264. |