

Paper Menu >>
Journal Menu >>
 International Journal of Geosciences, 2013, 4, 1003-1008 http://dx.doi.org/10.4236/ijg.2013.47093 Published Online September 2013 (http://www.scirp.org/journal/ijg) Retrospective Analysis of Land Cover and Use Dynamics in Gilgel Abbay Watershed by Using GIS and Remote Sensing Techniques, Northwestern Ethiopia Amare Sewnet Minale Department of Geography and Environmental Studies, Bahir Dar University, Bahir Dar, Ethiopia Email: [email protected] Received June 1, 2013; revised July 5, 2013; accepted August 2, 2013 Copyright © 2013 Amare Sewnet Minale. This is an open access article distributed under the Creative Commons Attribution License, which permits unrestricted use, distribution, and reproduction in any medium, provided the original work is properly cited. ABSTRACT This study was aimed at examining land cover changes for the last 35 years and its causative factors in Gilgel Abbay watershed by using GIS and remote sensing, survey and population data. The land use and cover changes study will help to apply the appropriate land use. The land cover/use status for the years 1973, 1986, 1995 and 2008 were exam- ined using land sat images. The changes in different land cover units such as forest, wood and bush lands, grass, wet- lands and water bod ies, and farm and settlements were analyzed. Population change, tenure, poverty and lack of market and credit facilities in the watershed area were analyzed as causes of land cover changes. The results of the study have shown that during the last 35 years forest, grass lands, wetlands and lake areas were converted to farm and settlement areas. There was rapid increase of population with growth rates of 4.9% and 3.5% (1984-1994 and 1994-2007), respec- tively per annum which caused more land cover changes. Keywords: Gilgel Abbay Catchment; Land Conversion; Causes of Land Cover Change; Population Increase; Socio-Economic Factors 1. Introduction Interpreting and conceptualizing the land cover/use changes contribute to complex dynamics of land cover and is important for policy and planning actions [1,2]. Land use changes are caused by both natural and socio- economic factors [3]. Land use land/cover (LULC) is perhaps the most prominent form of global environ- mental change phenomenon occurring at spatial and temporal scales. Land cover is the physical and biologi- cal cover of the surface of land, whereas land use is the syndromes of human activities such as agriculture, forestry and building construction that alter land surface processes [4]. The conversion of natural land to cropland, pasture, urban area, reservoirs, and other anthropogenic landscapes represents the form of human impact on the environment [5]. Roughly 40% of earth’s land surface is under agriculture, and 85% has some level of anthro- pogenic influence [6]. Therefore, large-scale land cover change is largely a rural phenomenon, but many of its drivers can be traced to the consumption demands of the swelling urban population [7]. Deforestation, wetland drainage, and grassland degradation have all amounted to a globally significant alteration of the land co ver changes. Large scale environmental phenomena like land degra- dation and desertificatio n, biodiversity loss, habitat des- truction and species transfer are consequences of land use by converting natural land covers [8]. The relationship between land cover and use change and its causative factors is complex and dynamic. The land cover and use change is mainly manipulated by both natural and socio-economic factors. Some studies sug- gested that demographic dynamics contribute more than any other process to land cover changes [9] while others suggested the superiority of economic factors [10]. Other socio-economic factors of land cover change include poverty, tenure security, and availability of market and credit facilities. Each of th e above causes was associated with one or more ultimate causes for land cover change, if remedied would solve the problem. These factors have become apparent between, as well as within, individual regions and countries. Thus, the diversity of causative factors of land cover change must be considered within the regional variati o ns [11]. In Ethiopia, different micro studies from aerial photo and satellite images have revealed that agricultural land C opyright © 2013 SciRes. IJG 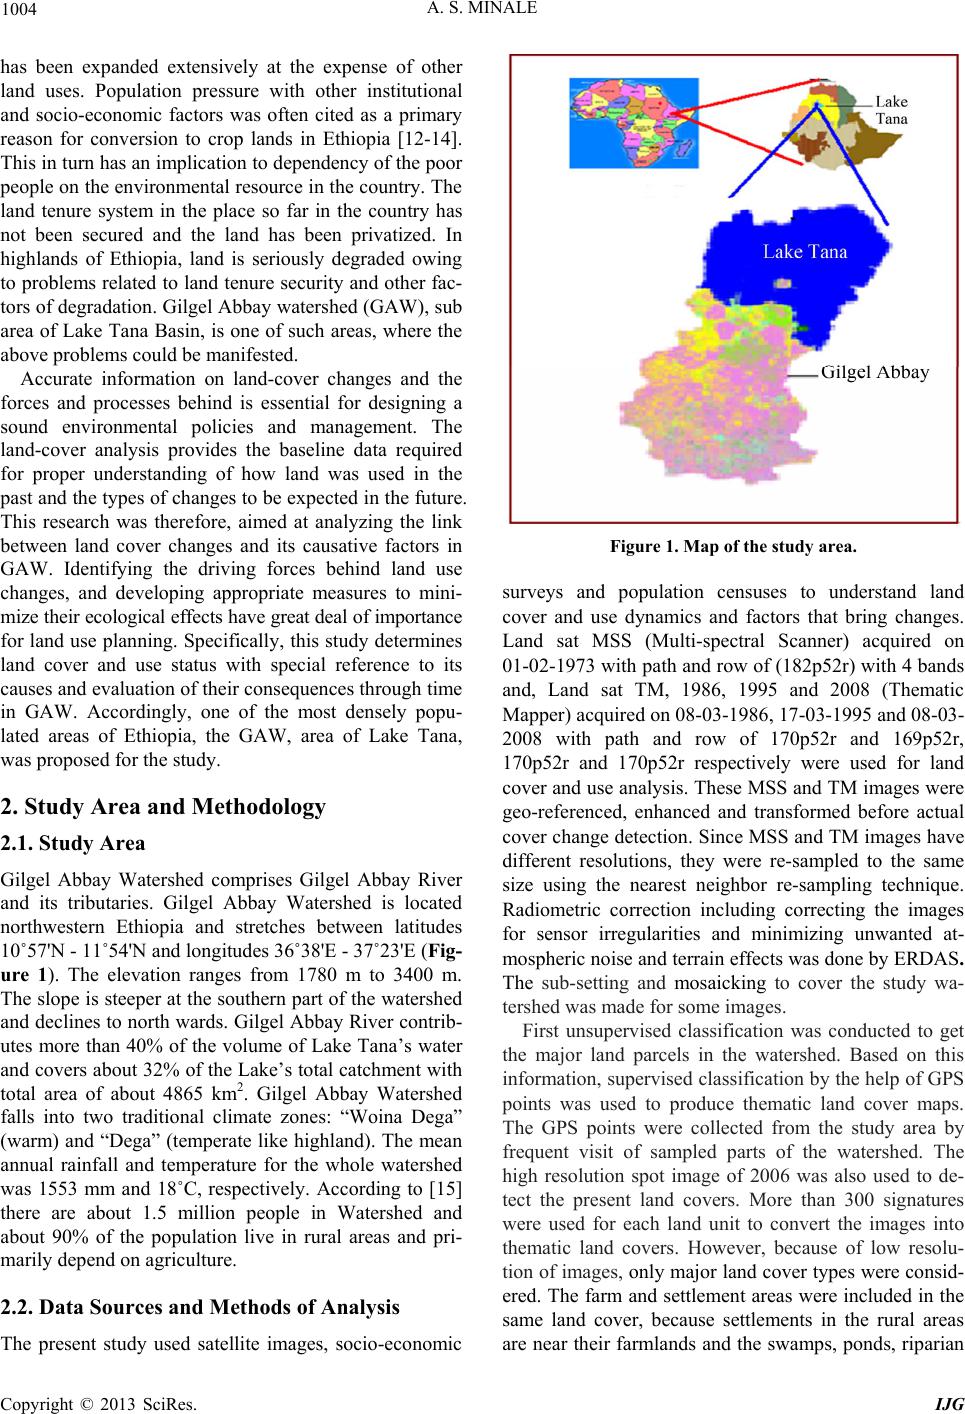 A. S. MINALE 1004 has been expanded extensively at the expense of other land uses. Population pressure with other institutional and socio-economic factors was often cited as a primary reason for conversion to crop lands in Ethiopia [12-14]. This in turn has an implication to dependency of the poor people on the environmental resource in the coun try. The land tenure system in the place so far in the country has not been secured and the land has been privatized. In highlands of Ethiopia, land is seriously degraded owing to problems related to land tenure security and other fac- tors of degradation. Gilgel Abbay watershed (GAW), sub area of Lake Tana Basin, is one of such areas, where the above problems could be manifested. Accurate information on land-cover changes and the forces and processes behind is essential for designing a sound environmental policies and management. The land-cover analysis provides the baseline data required for proper understanding of how land was used in the past and the types of changes to be expected in the future. This research was therefore, aimed at analyzing the link between land cover changes and its causative factors in GAW. Identifying the driving forces behind land use changes, and developing appropriate measures to mini- mize their ecological effec ts have great deal of importance for land use planning. Specifically, this study determines land cover and use status with special reference to its causes and evaluation of their consequences through time in GAW. Accordingly, one of the most densely popu- lated areas of Ethiopia, the GAW, area of Lake Tana, was proposed for the study. 2. Study Area and Methodology 2.1. Study Area Gilgel Abbay Watershed comprises Gilgel Abbay River and its tributaries. Gilgel Abbay Watershed is located northwestern Ethiopia and stretches between latitudes 10˚57'N - 11˚54'N and longitudes 36˚38'E - 37˚23'E (Fig- ure 1). The elevation ranges from 1780 m to 3400 m. The slope is steeper at the southern part of the watershed and declines to north wards. Gilgel Abbay River contrib- utes more than 40% of the volume of Lake Tana’s water and covers abou t 32% of the Lake’s total catchment with total area of about 4865 km2. Gilgel Abbay Watershed falls into two traditional climate zones: “Woina Dega” (warm) and “Dega” (temperate like highland). The mean annual rainfall and temperature for the whole watershed was 1553 mm and 18˚C, respectively. According to [15] there are about 1.5 million people in Watershed and about 90% of the population live in rural areas and pri- marily depend on agriculture. 2.2. Data Sources and Methods of Analysis The present study used satellite images, socio-economic Figure 1. Map of the study area. surveys and population censuses to understand land cover and use dynamics and factors that bring changes. Land sat MSS (Multi-spectral Scanner) acquired on 01-02-1973 with path and row of (182p52r) with 4 bands and, Land sat TM, 1986, 1995 and 2008 (Thematic Mapper) acquired on 08-03-1 98 6, 1 7- 03 - 19 95 a n d 08- 0 3- 2008 with path and row of 170p52r and 169p52r, 170p52r and 170p52r respectively were used for land cover and use analysis. These MSS and TM images wer e geo-referenced, enhanced and transformed before actual cover change detection. Since MSS and TM images have different resolutions, they were re-sampled to the same size using the nearest neighbor re-sampling technique. Radiometric correction including correcting the images for sensor irregularities and minimizing unwanted at- mospheric noise and terrain effects was done by ERDAS. The sub-setting and mos a i c k i n g to cover the study wa- tershed was made for some images. First unsupervised classification was conducted to get the major land parcels in the watershed. Based on this information, supervised classification by the help of GPS points was used to produce thematic land cover maps. The GPS points were collected from the study area by frequent visit of sampled parts of the watershed. The high resolution spot image of 2006 was also used to de- tect the present land covers. More than 300 signatures were used for each land unit to convert the images into thematic land covers. However, because of low resolu- tion of images, only major land cover types were consid- ered. The farm and settlement areas were included in the same land cover, because settlements in the rural areas are near their farmlands and the swamps, ponds, riparian Copyright © 2013 SciRes. IJG  A. S. MINALE Copyright © 2013 SciRes. IJG 1005 vegetation and marsh areas were also categorized under wetlands. The major land cover classes were: forest; ag- riculture and settlement; wood and bush lands; grass lands; water bodies and wetlands (Table 1). After classification, calculation of the area in hectare, comparison of the land use land cover statistics within and between land class units and years was made and the trend was determined. Percentage change to determine the trend of change then is calculated by 211 100 ttt CA AA , where At1 is the area of one type of land use in t1 ti me; At2 is the area of the same type in t2 time. C is a simple and effective method of weighing relative change of area of one type of land use. Survey data using structured questions, interview and focus group techniques were included to substantiate the image analysis. Population data about districts which covers about 75% of total watershed from three censuses were obtained from central statistics office and were used for change detection in catchment’s population size, growth and spatial variation. 3. Results and Discussion 3.1. Land Cover and Use Dynamics in GAW The forest cover includes natural densely grown trees found in some pocket areas of the watershed. It was con- stituted only 1.2% of the total watershed in 1973, and had shown rapid declining during the study time. Its per- centage share was 0.6%, 0.4% and 0.3% respectively over the specified years (Table 2 and Figure 2). There was 73.3% forest cover loss from 1973-2008 from wa- tershed. The trend was mainly related to rapid population growth and demand for farming land and construction as well as fuel wood. Wood and bush land covers have shown increment from 3.1% in 1973 to 5.1%, 7.6% and 7.7% respectively during the last 35 years (Table 2 and Figure 2). This shows that, although the proportion was small, wood and bush land covers have shown continu- ous increment. Within the specified years grass land has shown continuous declining change from 20.6% in 1973 to 13.9%, 11.6% and 9.3 % respectively, with very fast and rapid conversion rate (Table 2 and Figure 2). This was related to easy accessibility of farming activities and redistribution of grass lands to landless farmers. This land cover has shown increasing change during the specified years. The percentage change was 26.1% in 1973 and 34 .9%, 36.3% and 41.2% r espectively on tho se years (Table 2 and Figure 2). This was the larger expan- sion and share than other land use types. This implies that agriculture and settlement areas have been exten- Table 1. Land classification and their descriptions. No. Land class Description 1 Forest Tree-covered land where the trees cover density is greater than 10%. 2 Wood and bush lands Areas with sparse trees mixed with short bushes, grasses and open areas; less dense than the forest with little useful wood, mixed with some grasses 3 Grass lands Land predominately covered with gra sses, forbs, grassy areas used for communal grazing. 4 Agriculture and settlement Areas used for crop cultivation, both annuals and perennials, and the scattered rural settlements that are closely associated with the cultiv a ted fields. 5 Water b o dies Areas covered by La k e , Rivers and stream s in the catchment permanently 6 Wet lands Wetlands include areas that waterlogged and swampy in the wet season, and dry in the dry season, perennial marshy areas and riparian vegetations. Source: Amare and Kameswara, 2011. Table 2. Land cover and use changes in GAW from 1973 to 2008. Land cover classes Year 1973 Year 1986 Year 1995 Year 2008 1973-2008 Area in ha*. % Area in ha. % Area in ha. % Area in ha. % Total loss or gain Forest 9328 1.2 4527 0.6 3298 0.4 2581 0.3 −6747 Wood and bush lands 24,645 3.1 39,980 5.1 60,148 7.6 60,863 7.7 36,218 Grass land 162,481 20.6 109,550 13.9 91,748 11.6 73,026 9.3 −89,455 Farm and settlement land 205,993 26.1 274,947 34.9 286,261 36.3 324,536 41.2 118543 Lake Tana 301,899 38.3 302,946 38.4 301,082 38.1 282,990 35.9 −18,909 Wet lands 84,069 10.7 56,465 7.2 45,878 5.8 44,419 5.6 −39,650 Total 788,415 100 788,415 100 788,415 100 788,415 100 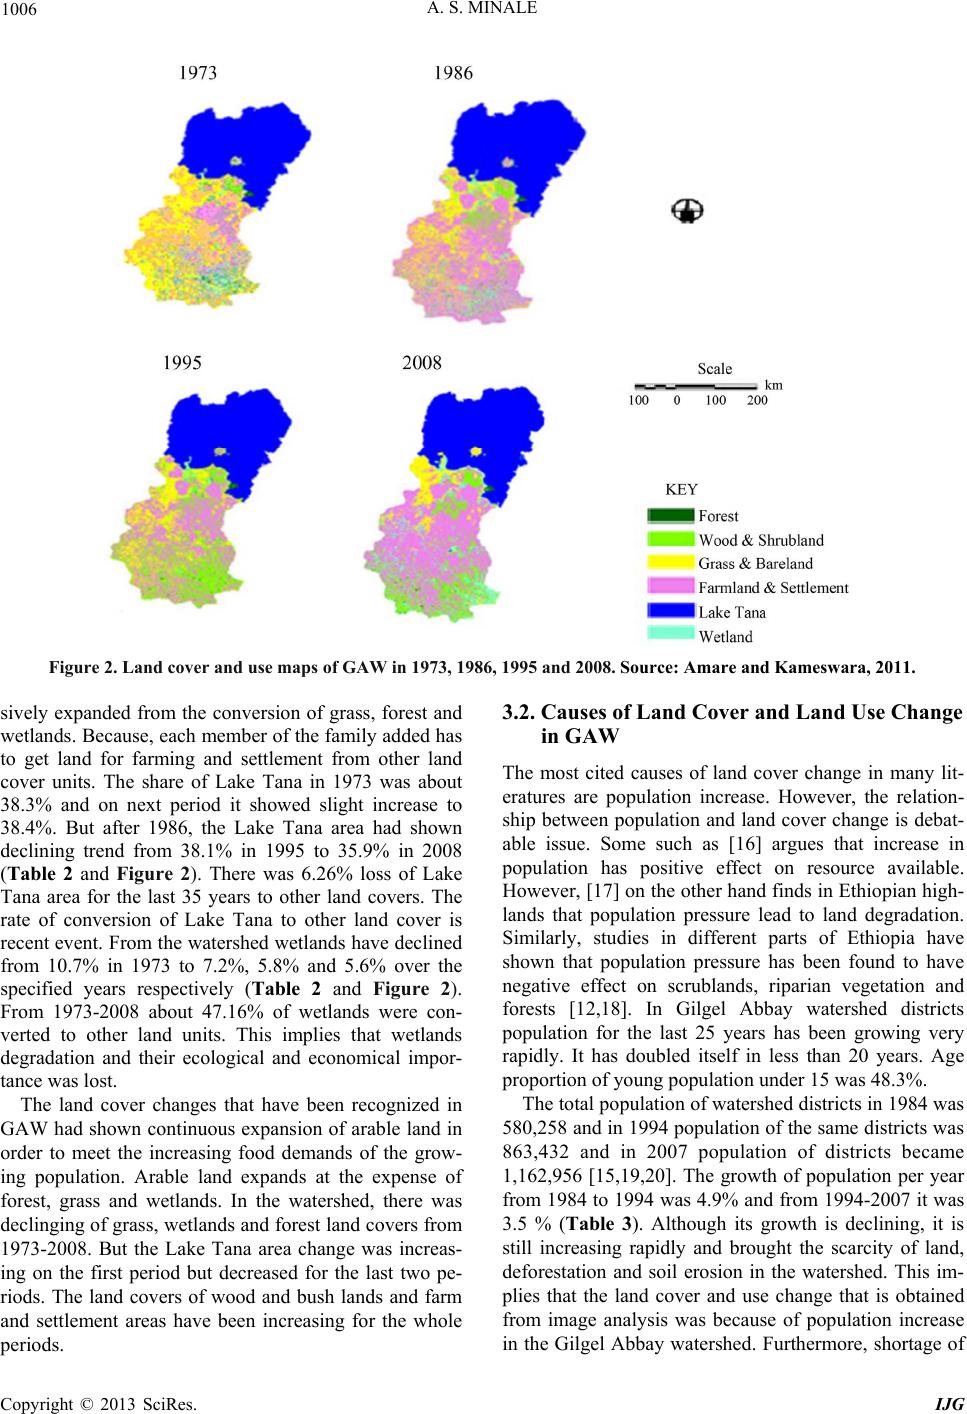 A. S. MINALE 1006 Figure 2. Land cover and use maps of GAW in 1973, 1986, 1995 and 2008. Source: Amare and Kameswara, 2011. sively expanded from the conversion of grass, forest and wetlands. Because, each member of the family added has to get land for farming and settlement from other land cover units. The share of Lake Tana in 1973 was about 38.3% and on next period it showed slight increase to 38.4%. But after 1986, the Lake Tana area had shown declining trend from 38.1% in 1995 to 35.9% in 2008 (Table 2 and Figure 2). There was 6.26% loss of Lake Tana area for the last 35 years to other land covers. The rate of conversion of Lake Tana to other land cover is recent event. From the watershed wetlands have declined from 10.7% in 1973 to 7.2%, 5.8% and 5.6% over the specified years respectively (Table 2 and Figure 2). From 1973-2008 about 47.16% of wetlands were con- verted to other land units. This implies that wetlands degradation and their ecological and economical impor- tance was lost. The land cover changes that have been recognized in GAW had shown continuous expansion of arable land in order to meet the increasing food demands of the grow- ing population. Arable land expands at the expense of forest, grass and wetlands. In the watershed, there was declinging of grass, wetlands and forest land covers from 1973-2008. But the Lake Tana area change was increas- ing on the first period but decreased for the last two pe- riods. The land covers of wood and bush lands and farm and settlement areas have been increasing for the whole periods. 3.2. Causes of Land Cover and Land Use Change in GAW The most cited causes of land cover change in many lit- eratures are population increase. However, the relation- ship between population and land cover change is debat- able issue. Some such as [16] argues that increase in population has positive effect on resource available. However, [17] on the other hand finds in Ethiopian high- lands that population pressure lead to land degradation. Similarly, studies in different parts of Ethiopia have shown that population pressure has been found to have negative effect on scrublands, riparian vegetation and forests [12,18]. In Gilgel Abbay watershed districts population for the last 25 years has been growing very rapidly. It has doubled itself in less than 20 years. Age proportion of young population under 15 was 48.3%. The total population of water shed districts in 1984 was 580,258 and in 1994 popu lation of the same districts was 863,432 and in 2007 population of districts became 1,162,956 [15,19,20]. The growth of population per year from 1984 to 1994 was 4.9% and from 1994-2007 it was 3.5 % (Table 3). Although its growth is declining, it is still increasing rapidly and brought the scarcity of land, deforestation and soil erosion in the watershed. This im- plies that the land cover and use change that is obtained from image analysis was because of population increase in the Gilgel Abbay watershed. Furthermore, shortage of Copyright © 2013 SciRes. IJG 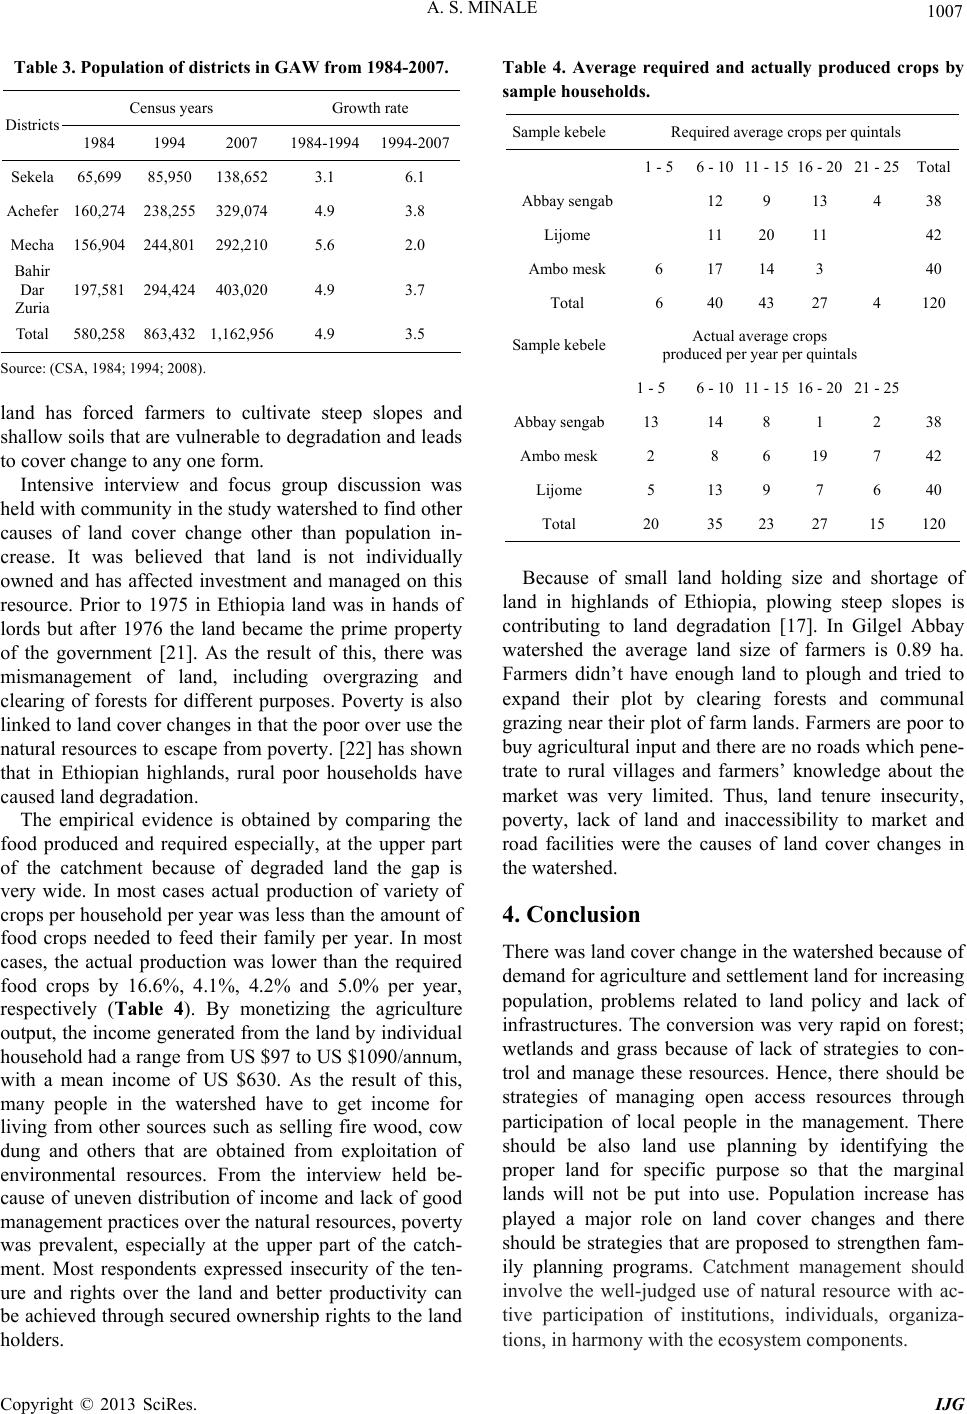 A. S. MINALE 1007 Table 3. Population of districts in GAW from 1984-2007. Census years Growth rate Districts 1984 1994 2007 1984-1994 1994-2007 Sekela 65,699 85,950 138,652 3.1 6.1 Achefer 160,274 238,255 329,074 4.9 3.8 Mecha 156,904 244,801 292,210 5.6 2.0 Bahir Dar Zuria 197,581 294,424 403,020 4.9 3.7 Total 580,258 863,432 1,162,956 4.9 3.5 Source: (CSA, 1984; 1994; 2008). land has forced farmers to cultivate steep slopes and shallow soils that are vuln erable to degrad ation and leads to cover change to any one form. Intensive interview and focus group discussion was held with community in the stu dy watershed to find other causes of land cover change other than population in- crease. It was believed that land is not individually owned and has affected investment and managed on this resource. Prior to 1975 in Ethiopia land was in hands of lords but after 1976 the land became the prime property of the government [21]. As the result of this, there was mismanagement of land, including overgrazing and clearing of forests for different purposes. Poverty is also linked to land cov er changes in that the poor over use the natural resources to escape from poverty. [22] has shown that in Ethiopian highlands, rural poor households have caused land degradation. The empirical evidence is obtained by comparing the food produced and required especially, at the upper part of the catchment because of degraded land the gap is very wide. In most cases actual production of variety of crops per household per year was less than the amount of food crops needed to feed their family per year. In most cases, the actual production was lower than the required food crops by 16.6%, 4.1%, 4.2% and 5.0% per year, respectively (Table 4). By monetizing the agriculture output, the income generated from the land by individual household had a range from US $97 to US $1090/annum, with a mean income of US $630. As the result of this, many people in the watershed have to get income for living from other sources such as selling fire wood, cow dung and others that are obtained from exploitation of environmental resources. From the interview held be- cause of uneven distribution of income and lack of good management practices over the natural resources, poverty was prevalent, especially at the upper part of the catch- ment. Most respondents expressed insecurity of the ten- ure and rights over the land and better productivity can be achieved thr ough secured ownership rights to the land holders. Table 4. Average required and actually produced crops by sample households. Sample kebeleRequired average crops per quintals 1 - 5 6 - 10 11 - 15 16 - 20 21 - 25Total Abbay sengab 12 9 13 4 38 Lijome 11 20 11 42 Ambo mesk 6 17 14 3 40 Total 6 40 43 27 4 120 Sample kebeleActual average crops produced per ye ar per quintals 1 - 5 6 - 10 11 - 15 16 - 20 21 - 25 Abbay sengab13 14 8 1 2 38 Ambo mesk2 8 6 19 7 42 Lijome 5 13 9 7 6 40 Total 20 35 23 27 15 120 Because of small land holding size and shortage of land in highlands of Ethiopia, plowing steep slopes is contributing to land degradation [17]. In Gilgel Abbay watershed the average land size of farmers is 0.89 ha. Farmers didn’t have enough land to plough and tried to expand their plot by clearing forests and communal grazing near their plot of farm lands. Farmers are poor to buy agricultural input and there are no roads which pene- trate to rural villages and farmers’ knowledge about the market was very limited. Thus, land tenure insecurity, poverty, lack of land and inaccessibility to market and road facilities were the causes of land cover changes in the watershed. 4. Conclusion There was land cover change in the watershed because of demand for agriculture and settlement land for increasing population, problems related to land policy and lack of infrastructures. The conversion was very rapid on forest; wetlands and grass because of lack of strategies to con- trol and manage these resources. Hence, there should be strategies of managing open access resources through participation of local people in the management. There should be also land use planning by identifying the proper land for specific purpose so that the marginal lands will not be put into use. Population increase has played a major role on land cover changes and there should be strategies that are proposed to strengthen fam- ily planning programs. Catchment management should involve the well-judged use of natural resource with ac- tive participation of institutions, individuals, organiza- tions, in harmony with the ecosystem components. Copyright © 2013 SciRes. IJG 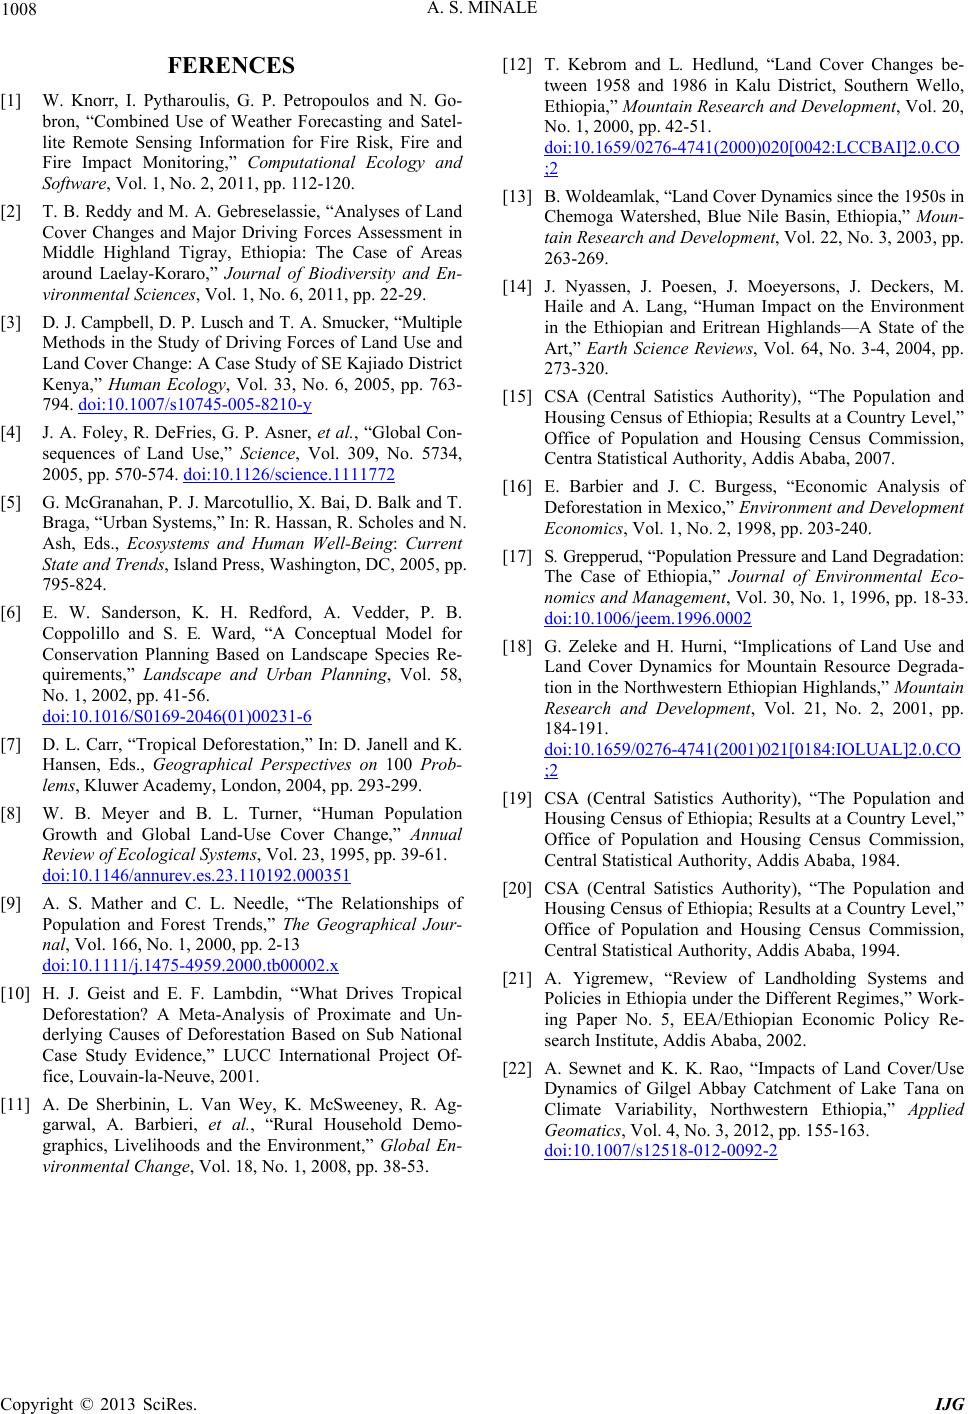 A. S. MINALE Copyright © 2013 SciRes. IJG 1008 FERENCES [1] W. Knorr, I. Pytharoulis, G. P. Petropoulos and N. Go- bron, “Combined Use of Weather Forecasting and Satel- lite Remote Sensing Information for Fire Risk, Fire and Fire Impact Monitoring,” Computational Ecology and Software, Vol. 1, No. 2, 2011, pp. 112-120. [2] T. B. Reddy and M. A. Gebreselassie, “Analyses of Land Cover Changes and Major Driving Forces Assessment in Middle Highland Tigray, Ethiopia: The Case of Areas around Laelay-Koraro,” Journal of Biodiversity and En- vironmental Sciences, Vol. 1, No. 6, 2011, pp. 22-29. [3] D. J. Campbell, D. P. Lusch and T. A. Smucker, “Multiple Methods in the Study of Driving Forces of Land Use and Land Cover Change: A Case Study of SE Kajiado District Kenya,” Human Ecology, Vol. 33, No. 6, 2005, pp. 763- 794. doi:10.1007/s10745-005-8210-y [4] J. A. Foley, R. DeFries, G. P. Asner, et al. , “Global Con- sequences of Land Use,” Science, Vol. 309, No. 5734, 2005, pp. 570-574. doi:10.1126/science.1111772 [5] G. McGranahan, P. J. Marcotullio, X. Bai, D. Balk and T. Braga, “Urban Systems,” In: R. Hassan, R. Scholes and N. Ash, Eds., Ecosystems and Human Well-Being: Current State and Trends, Island Press, Washington, DC, 2005, pp. 795-824. [6] E. W. Sanderson, K. H. Redford, A. Vedder, P. B. Coppolillo and S. E. Ward, “A Conceptual Model for Conservation Planning Based on Landscape Species Re- quirements,” Landscape and Urban Planning, Vol. 58, No. 1, 2002, pp. 41-56. doi:10.1016/S0169-2046(01)00231-6 [7] D. L. Carr, “Tropical Deforestation,” In: D. Janell and K. Hansen, Eds., Geographical Perspectives on 100 Prob- lems, Kluwer Academy, London, 2004, pp. 293-299. [8] W. B. Meyer and B. L. Turner, “Human Population Growth and Global Land-Use Cover Change,” Annual Review of Ecological Systems, Vol. 23, 1995, pp. 39-61. doi:10.1146/annurev.es.23.110192.000351 [9] A. S. Mather and C. L. Needle, “The Relationships of Population and Forest Trends,” The Geographical Jour- nal, Vol. 166, No. 1, 2000, pp. 2-13 doi:10.1111/j.1475-4959.2000.tb00002.x [10] H. J. Geist and E. F. Lambdin, “What Drives Tropical Deforestation? A Meta-Analysis of Proximate and Un- derlying Causes of Deforestation Based on Sub National Case Study Evidence,” LUCC International Project Of- fice, Louvain-la- Neu ve , 2001. [11] A. De Sherbinin, L. Van Wey, K. McSweeney, R. Ag- garwal, A. Barbieri, et al., “Rural Household Demo- graphics, Livelihoods and the Environment,” Global En- vironmental Change, Vol. 18, No. 1, 2008, pp. 38-53. [12] T. Kebrom and L. Hedlund, “Land Cover Changes be- tween 1958 and 1986 in Kalu District, Southern Wello, Ethiopia,” Mountain Research and Development, Vol. 20, No. 1, 2000, pp. 42-51. doi:10.1659/0276-4741(2000)020[0042:LCCBAI]2.0.CO ;2 [13] B. Woldeamlak, “Land Cover Dynamic s since the 1950s i n Chemoga Watershed, Blue Nile Basin, Ethiopia,” Moun- tain Research and Development, Vol. 22, No. 3, 2003, pp. 263-269. [14] J. Nyassen, J. Poesen, J. Moeyersons, J. Deckers, M. Haile and A. Lang, “Human Impact on the Environment in the Ethiopian and Eritrean Highlands—A State of the Art,” Earth Science Reviews, Vol. 64, No. 3-4, 2004, pp. 273-320. [15] CSA (Central Satistics Authority), “The Population and Housing Census of Ethiopia; Results at a Country Level,” Office of Population and Housing Census Commission, Centra Statistical Authority, Addis Ababa, 2007. [16] E. Barbier and J. C. Burgess, “Economic Analysis of Deforestation in Mexico,” Environment and Development Economics, Vol. 1, No. 2, 1998, pp. 203-240. [17] S. Grepperud, “Population Pressure and Land Degradation: The Case of Ethiopia,” Journal of Environmental Eco- nomics and Management, Vol. 30, No. 1, 1996, pp. 18-33. doi:10.1006/jeem.1996.0002 [18] G. Zeleke and H. Hurni, “Implications of Land Use and Land Cover Dynamics for Mountain Resource Degrada- tion in the Northwestern Ethiopian Highlands,” Mountain Research and Development, Vol. 21, No. 2, 2001, pp. 184-191. doi:10.1659/0276-4741(2001)021[0184:IOLUAL]2.0.CO ;2 [19] CSA (Central Satistics Authority), “The Population and Housing Census of Ethiopia; Results at a Country Level,” Office of Population and Housing Census Commission, Central Statistical Authority, Addis Ababa, 1984. [20] CSA (Central Satistics Authority), “The Population and Housing Census of Ethiopia; Results at a Country Level,” Office of Population and Housing Census Commission, Central Statistical Authority, Addis Ababa, 1994. [21] A. Yigremew, “Review of Landholding Systems and Policies in Ethiopia under the Different Regimes,” Work- ing Paper No. 5, EEA/Ethiopian Economic Policy Re- search Institute, A dd is Ababa, 2002. [22] A. Sewnet and K. K. Rao, “Impacts of Land Cover/Use Dynamics of Gilgel Abbay Catchment of Lake Tana on Climate Variability, Northwestern Ethiopia,” Applied Geomatics, Vol. 4, No. 3, 2012, pp. 155-163. doi:10.1007/s12518-012-0092-2 |