

Paper Menu >>
Journal Menu >>
 Vol.5, No.8A1, 72-77 (2013) Natural Science http://dx.doi.org/10.4236/ns.2013.58A1009 Spatial variation of coda wave attenuation using aftershocks of the Al Hoceima earthquake of 24 February, 2004, Morocco Abderrahim Boulanouar1*, Lahcen El Moudnib1,2, Mimoun Harnafi2, Taj-Eddine Cherkaoui2, Abdelaali Rahmouni1, Mohamed Boukalouch1, Jamal Sebbani1 1Physics Department, Faculty of Science, Mohammed V University-Agdal, Rabat, Morocco; *Corresponding Author: [email protected] 2Earth Science Department, Scientific Institute, Mohammed V University-Agdal, Rabat, Morocco Received 6 July 2013; revised 6 August 2013; accepted 13 August 2013 Copyright © 2013 Abderrahim Boulanouar et al. This is an open access article distributed under the Creative Commons Attribution License, which permits unrestricted use, distribution, and reproduction in any medium, provided the original work is properly cited. ABSTRACT On 24th February 2004 a significant earthquake (Md = 6.4) occurred in the north of Morocco causing great damage in the vicinity of Al Ho- ceima region. This area is characterized by a complex faulting system as a result of com- pressional tectonic forces. Three short period seismic stations are set in this area of interest and recordings from these stations were used in this study. In order to complete our knowledge of attenuation, 60 local earthquakes are re- corded a few days after the great earthquake with magnitude Ml 2.6 - 5.0 to estimate seismic attenuation. For this purpose, we applied the single backscattering model of Aki & Chouet 1975 in the frequency range for 1 to 8 Hz. The study of coda waves was limited to a relatively short lapse time (20 Seco nds) in order to sample the earth’s crust only. The values of Qc esti- mated for all the three stations show a strong frequency dependent relationship of the form Qc = Q0fn, where Q0 is Qc at 1 Hz , and n represents the degree of frequency dependence, and re- flects the level of crustal heterogeneities to varying degrees. The average frequency de- pendent attenuation relationship has been ob- tained which indicates that the attenuation is high in this region. Finally to conclude our work, the values of Q0 suggest that Al Hoceima area is highly heterogeneous and the n parameter in- dicates a meaning frequency dependence of Qc. Keywords: Attenuation; Coda Waves; Single Backscattering Model; Al Hoceima; Morocco; Seismic; Earthquak e 1. INTRODUCTION Al Hoceima is located among the most active seismic zones in Morocco between the African and Eurasian plates [1]. During the last 10 years, Al Hoceima has been affected by two strong earthquakes [1,2], the first on May 26th, 1994 (Mw = 6.0) and the later on February 24th, 2004 (Mw = 6.4). That’s why, the study of its seis- micity is very important in order to establish the seismic hazard assessment for this important area. Although this is a very active seismic zone, little is known about the seismic attenuation. Attenuation, inverse of quality factor, is one of the most fundamental proprieties of seismic waves from which a lot of information about the earth can be de- duced [3]. This parameter is an important factor for un- derstanding the physical mechanism of seismic wave attenuation in relation to the composition and physical condition of the Earth’s interior and it is also an essen- tial parameter for the quantitative prediction of strong ground motion for the viewpoint of engineering seis- mology [4]. This is also important for seismic hazard measurement [4]. The attenuation can be described as the decay of the seismic waves’ amplitude [5]. The single backscattering model given by Aki and Chouet [5], has been used in this study. This method is widely applied to studies in the crustal structures in different parts in the world [3,6-11]. In the present study, the seismic attenuation was inves- tigated in Al Hoceima region by analyzing a large num- ber of short period local seismograms and comparing it with other regions of the world [8]. The results of this study are discussed and compared with previous results Copyright © 2013 SciRes. OPEN ACCESS 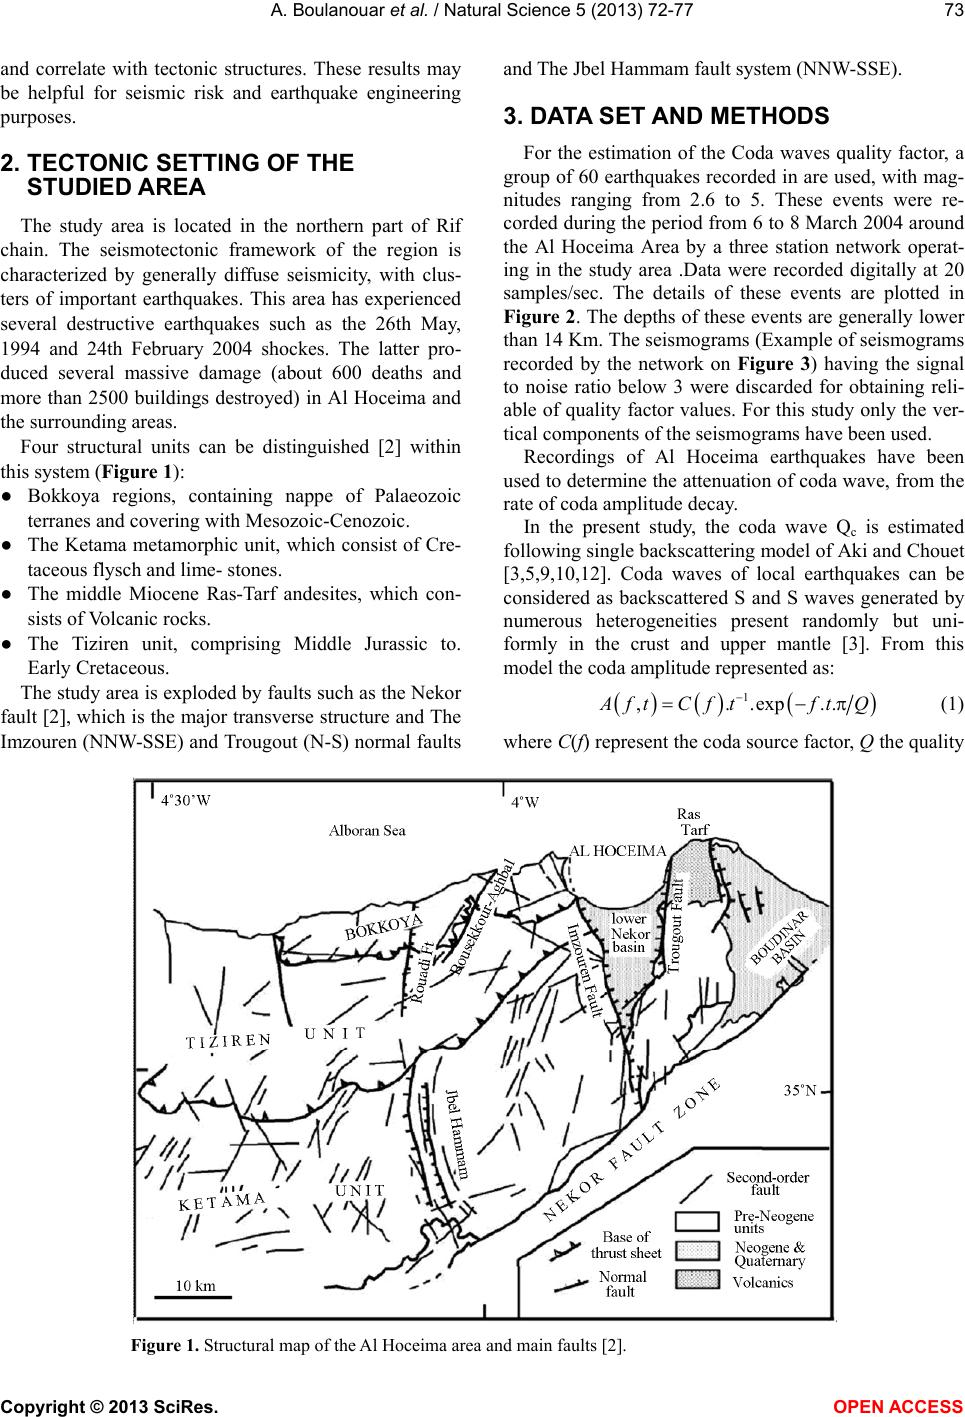 A. Boulanouar et al. / Natural Science 5 (201 3) 72-7 7 73 and correlate with tectonic structures. These results may be helpful for seismic risk and earthquake engineering purposes. 2. TECTONIC SETTING OF THE STUDIED AREA The study area is located in the northern part of Rif chain. The seismotectonic framework of the region is characterized by generally diffuse seismicity, with clus- ters of important earthquakes. This area has experienced several destructive earthquakes such as the 26th May, 1994 and 24th February 2004 shockes. The latter pro- duced several massive damage (about 600 deaths and more than 2500 buildings destroyed) in Al Hoceima and the surrounding areas. Four structural units can be distinguished [2] within this system (Figur e 1): ● Bokkoya regions, containing nappe of Palaeozoic terranes and covering with Mesozoic-Cenozoic. ● The Ketama metamorphic unit, which consist of Cre- taceous flysch and lime- stones. ● The middle Miocene Ras-Tarf andesites, which con- sists of Volcanic rocks. ● The Tiziren unit, comprising Middle Jurassic to. Early Cretaceous. The study area is exploded by faults such as the Nekor fault [2], which is the major transverse structure and The Imzouren (NNW-SSE) and Trougout (N-S) normal faults and The Jbel Hammam fault system (NNW-SSE). 3. DATA SET AND METHODS For the estimation of the Coda waves quality factor, a group of 60 earthquakes recorded in are used, with mag- nitudes ranging from 2.6 to 5. These events were re- corded during the period from 6 to 8 March 2004 around the Al Hoceima Area by a three station network operat- ing in the study area .Data were recorded digitally at 20 samples/sec. The details of these events are plotted in Figure 2. The depths of these events are generally lower than 14 Km. The seismograms (Example of seismograms recorded by the network on Figure 3) having the signal to noise ratio below 3 were discarded for obtaining reli- able of quality factor values. For this study only the ver- tical components of the seismograms have been used. Recordings of Al Hoceima earthquakes have been used to determine the attenuation of coda wave, from the rate of coda amplitude decay. In the present study, the coda wave Qc is estimated following single backscattering model of Aki and Chouet [3,5,9,10,12]. Coda waves of local earthquakes can be considered as backscattered S and S waves generated by numerous heterogeneities present randomly but uni- formly in the crust and upper mantle [3]. From this model the coda amplitude represented as: 1 ,..exp.. A ftC ftftQ (1) where C(f) represent the coda source factor, Q the quality Figure 1. Structural map of the Al Hoceima area and main faults [2]. Copyright © 2013 SciRes. OPEN ACCESS 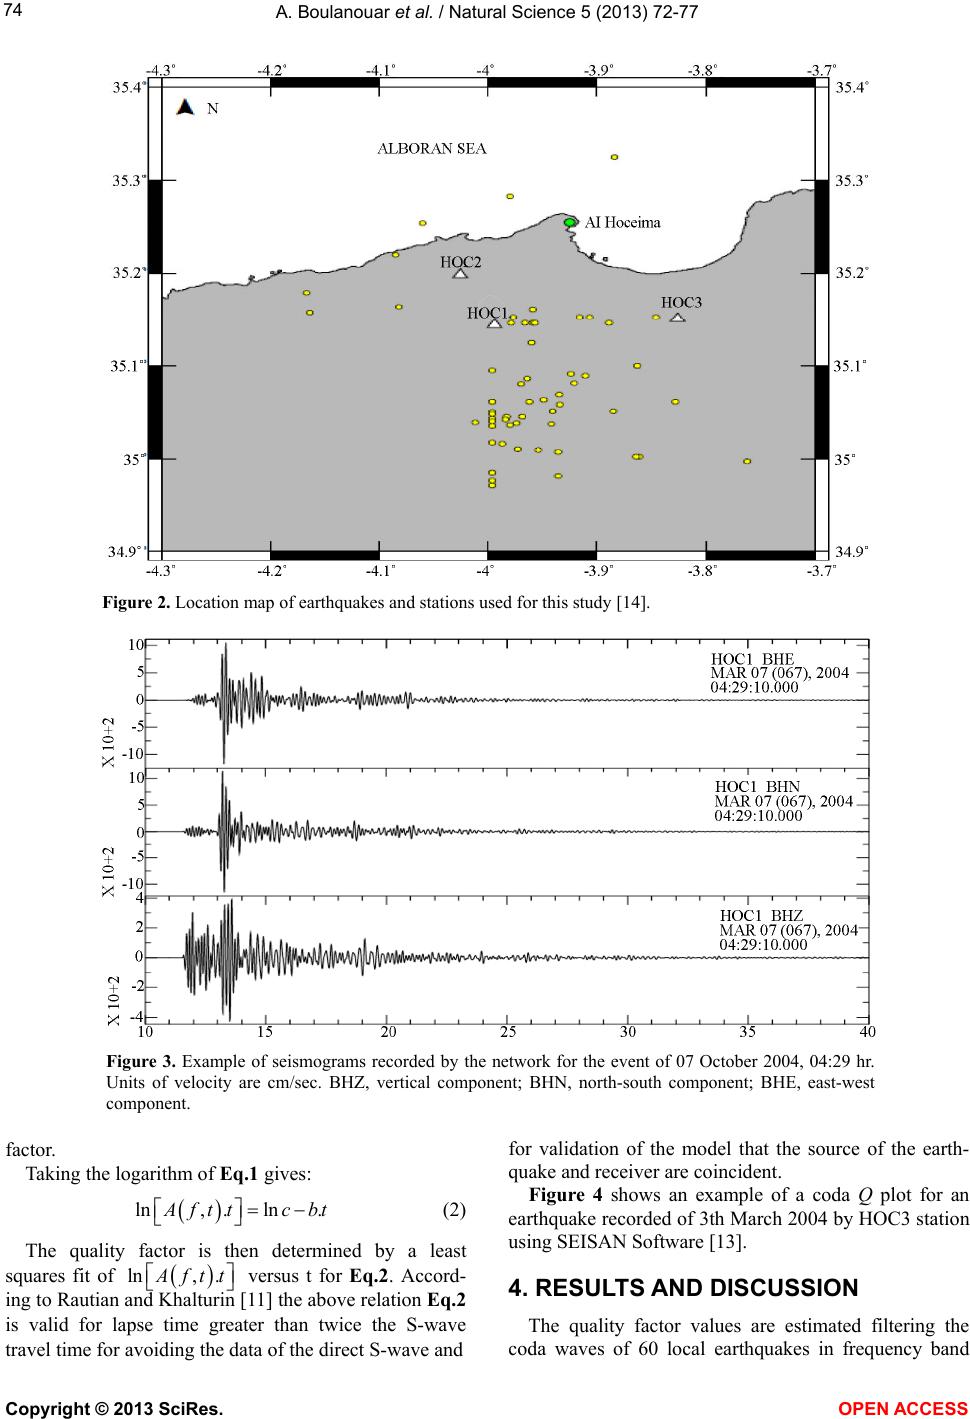 A. Boulanouar et al. / Natural Science 5 (201 3) 72-7 7 74 Figure 2. Location map of earthquakes and stations used for this study [14]. Figure 3. Example of seismograms recorded by the network for the event of 07 October 2004, 04:29 hr. Units of velocity are cm/sec. BHZ, vertical component; BHN, north-south component; BHE, east-west component. factor. Taking the logarithm of Eq.1 gives: ln, .ln. A fttc bt (2) The quality factor is then determined by a least squares fit of ln, . A ftt for validation of the model that the source of the earth- quake and receiver are coincident. Figure 4 shows an example of a coda Q plot for an earthquake recorded of 3th March 2004 by HOC3 station using SEISAN Software [13]. versus t for Eq.2. Accord- ing to Rautian and Khalturin [11] the above relation Eq.2 is valid for lapse time greater than twice the S-wave travel time for avoiding the data of the direct S-wave and 4. RESULTS AND DISCUSSION The quality factor values are estimated filtering the coda waves of 60 local earthquakes in frequency band Copyright © 2013 SciRes. OPEN ACCESS 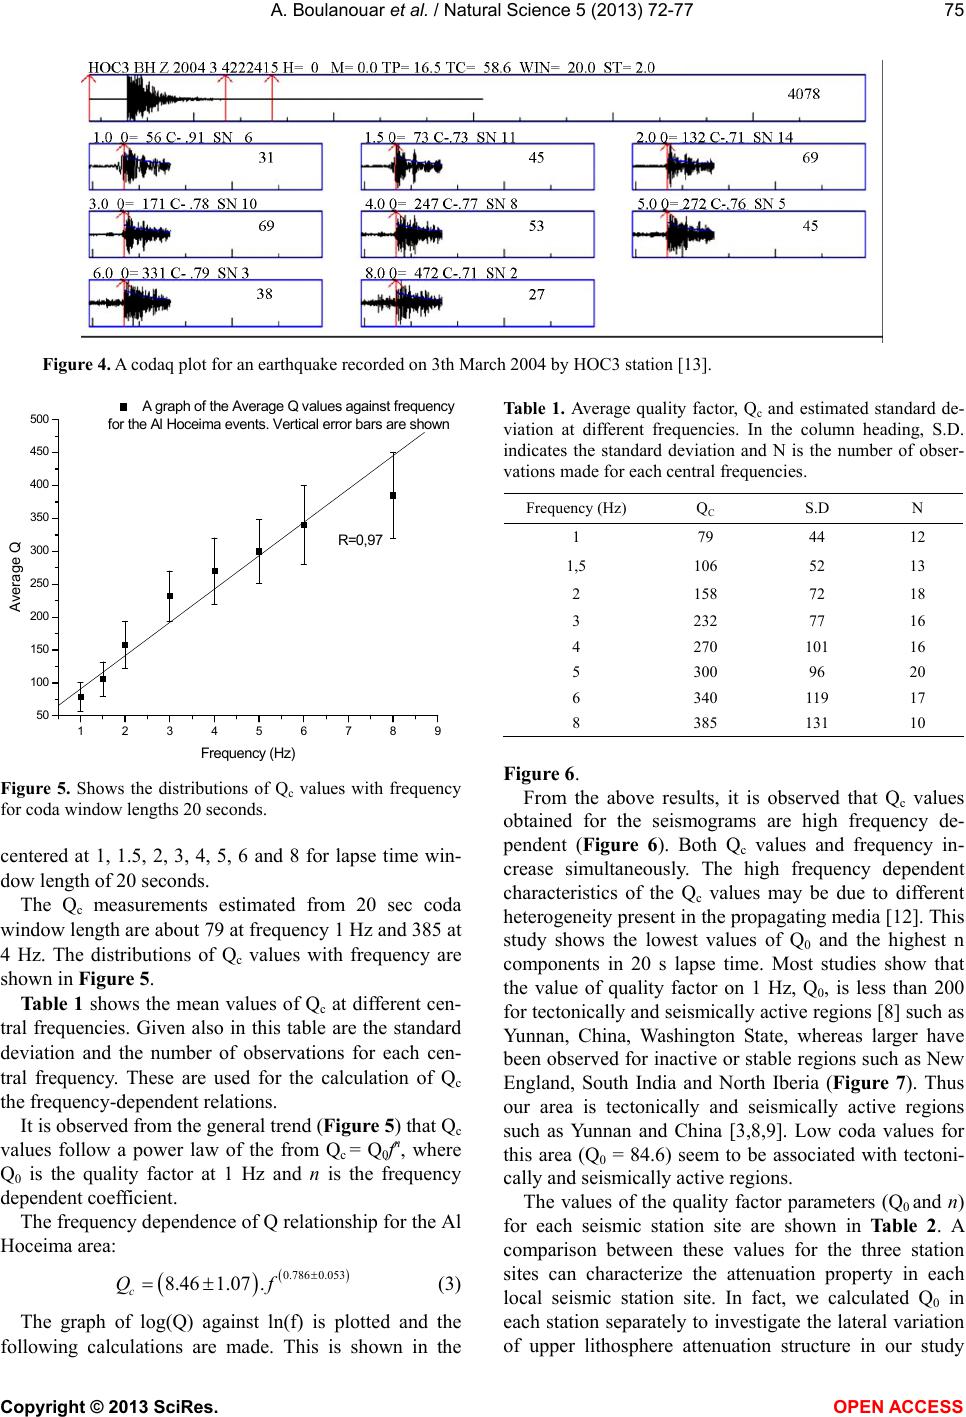 A. Boulanouar et al. / Natural Science 5 (201 3) 72-7 7 75 Figure 4. A codaq plot for an earthquake recorded on 3th March 2004 by HOC3 station [13]. 123456789 50 100 150 200 250 300 350 400 450 500 A graph of the Average Q values against frequency for the Al Hoceima events. Vertical error bars are shown R=0,97 Average Q Frequency (Hz) Figure 5. Shows the distributions of Qc values with frequency for coda window lengths 20 seconds. centered at 1, 1.5, 2, 3, 4, 5, 6 and 8 for lapse time win- dow length of 20 seconds. The Qc measurements estimated from 20 sec coda window length are about 79 at frequency 1 Hz and 385 at 4 Hz. The distributions of Qc values with frequency are shown in Figure 5. Tab le 1 shows the mean values of Qc at different cen- tral frequencies. Given also in this table are the standard deviation and the number of observations for each cen- tral frequency. These are used for the calculation of Qc the frequency-dependent relations. It is observed from the general trend (Figure 5) that Qc values follow a power law of the from Qc = Q0fn, where Q0 is the quality factor at 1 Hz and n is the frequency dependent coefficient. The frequency dependence of Q relationship for the Al Hoceima area: 0.786 0.053 8.461.07 . c Qf (3) The graph of log(Q) against ln(f) is plotted and the following calculations are made. This is shown in the Ta bl e 1 . Average quality factor, Qc and estimated standard de- viation at different frequencies. In the column heading, S.D. indicates the standard deviation and N is the number of obser- vations made for each central frequencies. Frequency (Hz) QC S.D N 1 79 44 12 1,5 106 52 13 2 158 72 18 3 232 77 16 4 270 101 16 5 300 96 20 6 340 119 17 8 385 131 10 Figure 6. From the above results, it is observed that Qc values obtained for the seismograms are high frequency de- pendent (Figure 6). Both Qc values and frequency in- crease simultaneously. The high frequency dependent characteristics of the Qc values may be due to different heterogeneity present in the propagating media [12]. This study shows the lowest values of Q0 and the highest n components in 20 s lapse time. Most studies show that the value of quality factor on 1 Hz, Q0, is less than 200 for tectonically and seismically active regions [8] such as Yunnan, China, Washington State, whereas larger have been observed for inactive or stable regions such as New England, South India and North Iberia (Figure 7). Thus our area is tectonically and seismically active regions such as Yunnan and China [3,8,9]. Low coda values for this area (Q0 = 84.6) seem to be associated with tectoni- cally and seismically active regions. The values of the quality factor parameters (Q0 and n) for each seismic station site are shown in Table 2. A comparison between these values for the three station sites can characterize the attenuation property in each local seismic station site. In fact, we calculated Q0 in each station separately to investigate the lateral variation of upper lithosphere attenuation structure in our study Copyright © 2013 SciRes. OPEN ACCESS 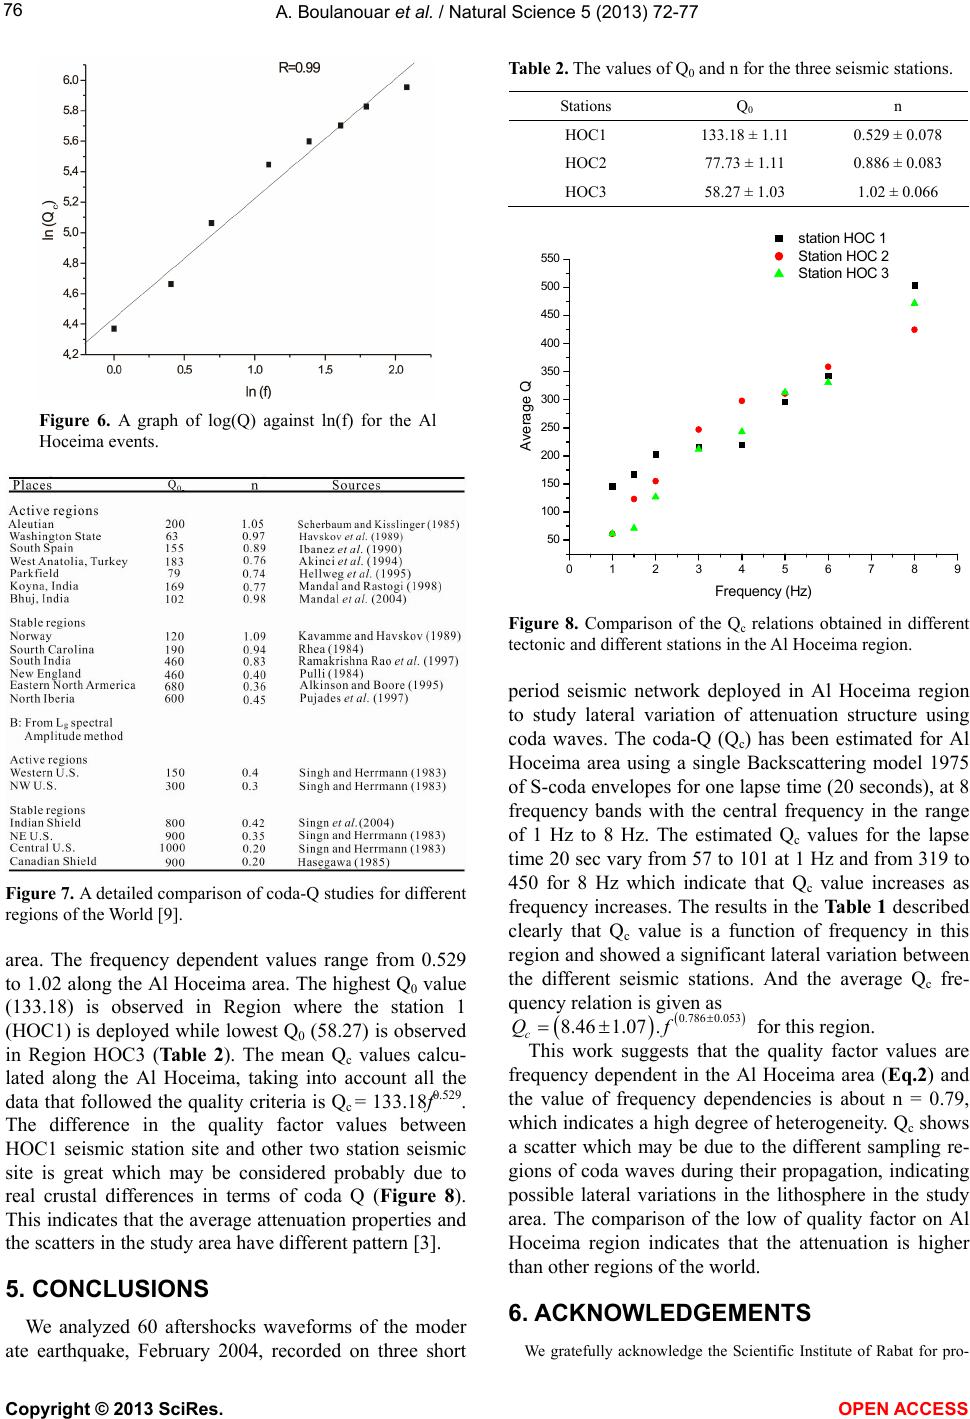 A. Boulanouar et al. / Natural Science 5 (201 3) 72-7 7 76 Figure 6. A graph of log(Q) against ln(f) for the Al Hoceima events. Figure 7. A detailed comparison of coda-Q studies for different regions of the World [9]. area. The frequency dependent values range from 0.529 to 1.02 along the Al Hoceima area. The highest Q0 value (133.18) is observed in Region where the station 1 (HOC1) is deployed while lowest Q0 (58.27) is observed in Region HOC3 (Tab le 2). The mean Qc values calcu- lated along the Al Hoceima, taking into account all the data that followed the quality criteria is Qc = 133.18f0.529. The difference in the quality factor values between HOC1 seismic station site and other two station seismic site is great which may be considered probably due to real crustal differences in terms of coda Q (Figure 8). This indicates that the average attenuation properties and the scatters in the study area have different pattern [3]. 5. CONCLUSIONS We analyzed 60 aftershocks waveforms of the moder ate earthquake, February 2004, recorded on three short Table 2. The values of Q0 and n for the three seismic stations. Stations Q0 n HOC1 133.18 ± 1.11 0.529 ± 0.078 HOC2 77.73 ± 1.11 0.886 ± 0.083 HOC3 58.27 ± 1.03 1.02 ± 0.066 0123456789 50 100 150 200 250 300 350 400 450 500 550 Average Q Frequency (Hz) station HOC 1 Station H O C 2 Station H O C 3 Figure 8. Comparison of the Qc relations obtained in different tectonic and different stations in the Al Hoceima region. period seismic network deployed in Al Hoceima region to study lateral variation of attenuation structure using coda waves. The coda-Q (Qc) has been estimated for Al Hoceima area using a single Backscattering model 1975 of S-coda envelopes for one lapse time (20 seconds), at 8 frequency bands with the central frequency in the range of 1 Hz to 8 Hz. The estimated Qc values for the lapse time 20 sec vary from 57 to 101 at 1 Hz and from 319 to 450 for 8 Hz which indicate that Qc value increases as frequency increases. The results in the Table 1 described clearly that Qc value is a function of frequency in this region and showed a significant lateral variation between the different seismic stations. And the average Qc fre- quency relation is given as for this region. 0.786 0.053 8.461.07 . c Qf This work suggests that the quality factor values are frequency dependent in the Al Hoceima area (Eq.2) and the value of frequency dependencies is about n = 0.79, which indicates a high degree of heterogeneity. Qc shows a scatter which may be due to the different sampling re- gions of coda waves during their propagation, indicating possible lateral variations in the lithosphere in the study area. The comparison of the low of quality factor on Al Hoceima region indicates that the attenuation is higher than other regions of the world. 6. ACKNOWLEDGEMENTS We gratefully acknowledge the Scientific Institute of Rabat for pro- Copyright © 2013 SciRes. OPEN ACCESS 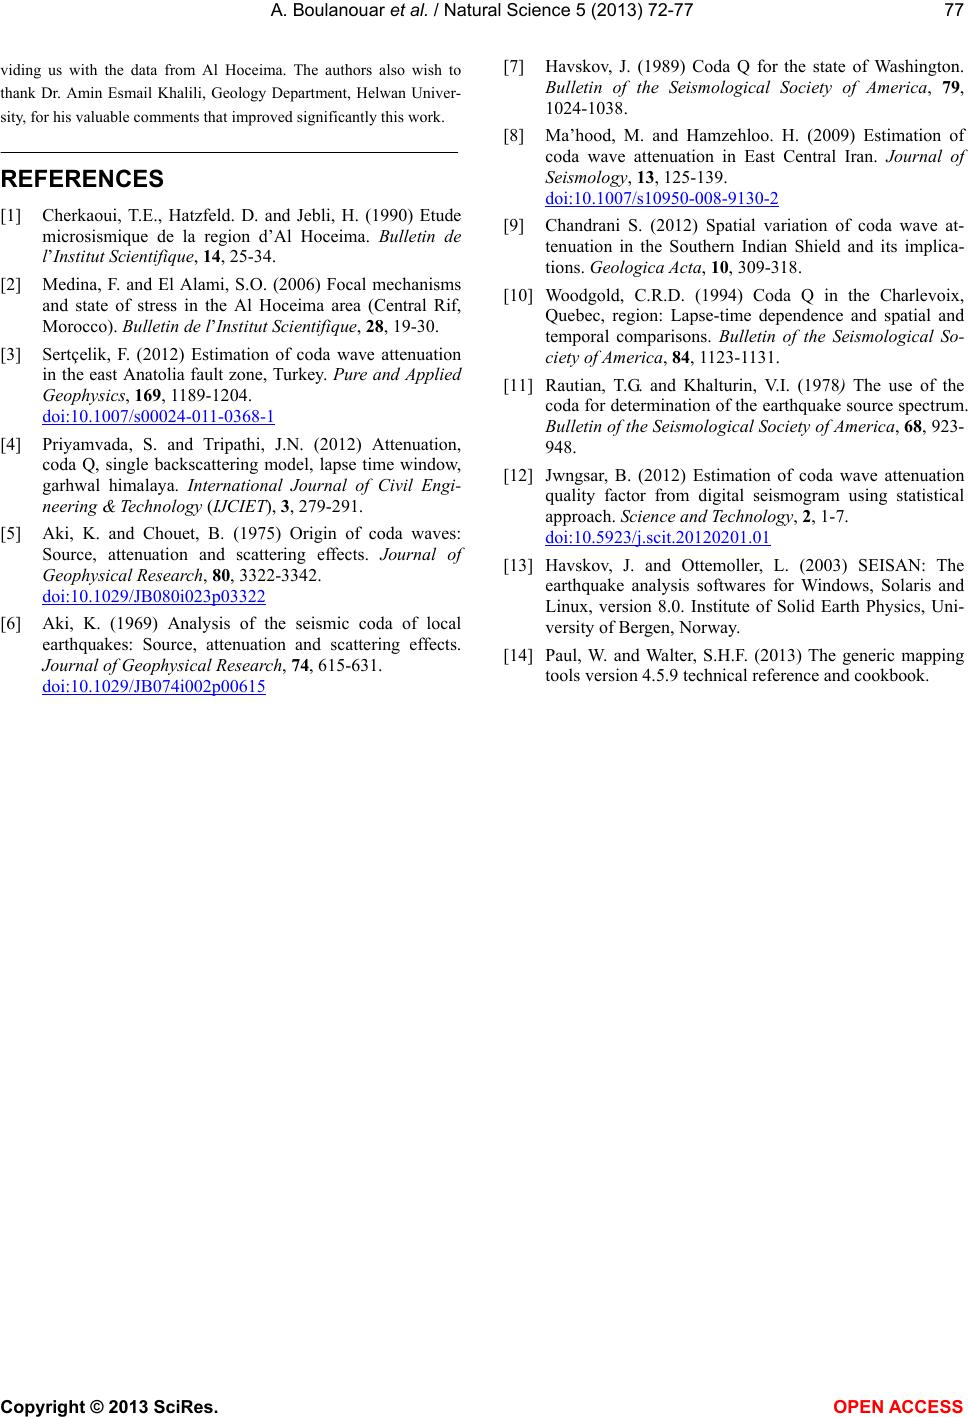 A. Boulanouar et al. / Natural Science 5 (201 3) 72-7 7 Copyright © 2013 SciRes. 77 [7] Havskov, J. (1989) Coda Q for the state of Washington. Bulletin of the Seismological Society of America, 79, 1024-1038. viding us with the data from Al Hoceima. The authors also wish to thank Dr. Amin Esmail Khalili, Geology Department, Helwan Univer- sity, for his valuable comments that improved significantly this work. [8] Ma’hood, M. and Hamzehloo. H. (2009) Estimation of coda wave attenuation in East Central Iran. Journal of Seismology, 13, 125-139. doi:10.1007/s10950-008-9130-2 REFERENCES [1] Cherkaoui, T.E., Hatzfeld. D. and Jebli, H. (1990) Etude microsismique de la region d’Al Hoceima. Bulletin de l’Institut Scientifique, 14, 25-34. [9] Chandrani S. (2012) Spatial variation of coda wave at- tenuation in the Southern Indian Shield and its implica- tions. Geologica Acta , 10, 309-318. [2] Medina, F. and El Alami, S.O. (2006) Focal mechanisms and state of stress in the Al Hoceima area (Central Rif, Morocco). Bulletin de l’Institut Scientifique, 28, 19-30. [10] Woodgold, C.R.D. (1994) Coda Q in the Charlevoix, Quebec, region: Lapse-time dependence and spatial and temporal comparisons. Bulletin of the Seismological So- ciety of America, 84, 1123-1131. [3] Sertçelik, F. (2012) Estimation of coda wave attenuation in the east Anatolia fault zone, Turkey. Pure and Applied Geophysics, 169, 1189-1204. doi:10.1007/s00024-011-0368-1 [11] Rautian, T.G. and Khalturin, V.I. (1978) The use of the coda for determination of the earthquake source spectrum. Bulletin of the Seismological Society of America, 68, 923- 948. [4] Priyamvada, S. and Tripathi, J.N. (2012) Attenuation, coda Q, single backscattering model, lapse time window, garhwal himalaya. International Journal of Civil Engi- neering & Technology (IJCIET), 3, 279-291. [12] Jwngsar, B. (2012) Estimation of coda wave attenuation quality factor from digital seismogram using statistical approach. Science and Technology, 2, 1-7. doi:10.5923/j.scit.20120201.01 [5] Aki, K. and Chouet, B. (1975) Origin of coda waves: Source, attenuation and scattering effects. Journal of Geophysical Research, 80, 3322-3342. doi:10.1029/JB080i023p03322 [13] Havskov, J. and Ottemoller, L. (2003) SEISAN: The earthquake analysis softwares for Windows, Solaris and Linux, version 8.0. Institute of Solid Earth Physics, Uni- versity of Bergen, Norway. [6] Aki, K. (1969) Analysis of the seismic coda of local earthquakes: Source, attenuation and scattering effects. Journal of Geophysical Research, 74, 615-631. doi:10.1029/JB074i002p00615 [14] Paul, W. and Walter, S.H.F. (2013) The generic mapping tools version 4.5.9 technical reference and cookbook. OPEN ACCESS |