

Paper Menu >>
Journal Menu >>
 Journal of Environmental Protection, 2013, 4, 16-26 http://dx.doi.org/10.4236/jep.2013.48A2003 Published Online August 2013 (http://www.scirp.org/journal/jep) Changes in Regional Potential Vegetation in Response to an Ambitious Mitigation Scenario Heike Huebener1, Janina Körper2 1Hessian Agency for Environment and Geology, Wiesbaden, Germany; 2Freie Universität Berlin, Institut für Meteorolgie, Berlin, Germany. Email: [email protected] Received May 25th, 2013; revised June 3rd, 2013; accepted July 26th, 2013 Copyright © 2013 Heike Huebener, Janina Körper. This is an open access article distributed under the Creative Commons Attribution License, which permits unrestricted use, distribution, and reproduction in any medium, provided the original work is properly cited. ABSTRACT Climate change impacts on the potential vegetation (biomes) are compared for an ambitious emissions-reduction sce- nario (E1) and a medium-high emissions scenario with no mitigation policy (A1B). The E1 scenario aims at limiting global mean warming to 2˚C or less above pre-industrial temperatures and is closely related to the RCP2.6 sued in the CMIP5. A multi-model ensemble of ten state-of-the-art coupled atmosphere-ocean general circulation models (GCMs) is analyzed. A simple biome model is used to assess the response of potential vegetation to the different forcing in the two scenarios. Changes in biomes in response to the simulated climate change are less pronounced in E1 than in the A1B scenario. Most biomes shift polewards, with biomes adapted to colder climates being replaced by biomes adapted to warmer climates. In some regions cold biomes (e.g. Tundra, Taiga) nearly disappear in the A1B scenario but are also significantly reduced under the E1 scenario. Keywords: Climate Change; Mitigation Scenario; Potential Vegetation 1. Introduction The new socio-economic scenarios used in the fifth as- sessment report of the Intergovernmental Panel on Cli- mate Change (IPCC), the “Representative Concentration Pathway” (RCP)-Scenarios [1] now include explicit miti- gation policies. Thus, for the preparation of adaptation actions, an assessment of anticipated changes under strong mitigation scenarios compared to scenarios without miti- gation is necessary. In the EU-funded project ENSEMBLES [2] a mitiga- tion scenario was developed that aims at keeping the 2˚-target: the E1 scenario [3]. E1 starts from an emission path corresponding to the “Special Report on Emission Scenarios” (SRES) A1B scenario, projecting greenhouse gas (GHG) concentrations to stabilize at 450 ppmv CO2- equivalent (CO2-e) in the 22nd century after an overshoot to 530 ppmv in the mid 21st century ([3,4]). Current aerosol trends indicate that the increasing aerosol levels in the SRES A1B scenario are overesti- mated (e.g. [5,6]). The E1 scenario generates a lower aerosol loading than A1B. This leads to a stronger tem- perature increase in the E1 scenario compared to the SRES A1B scenario in the first half of the 21st century, despite the reduced greenhouse gas forcing. [4] highlights a non-linear precipitation versus temperature response in some models, possibly related to the balance of surface net radiation induced by the aerosol forcing. Thus, the global mean precipitation increase per degree warming is stronger in the E1 scenario than in the A1B scenario. This effect was already noted in the comparison between the A1B and the “Commit” experiment of the CMIP3 simulations [7] but it is even stronger in E1 compared with A1B [4]. [8] underscores the stronger precipitation response per degree warming in the regional analyses in the E1 scenario compared to the A1B scenario. Simulations using the A1B and E1 scenarios are ana- lyzed. Model descriptions for the contributing coupled atmosphere-ocean general circulation models (GCMs) and global mean results for temperature, precipitation and carbon cycle fluxes are given in [4]. An analysis of regional precipitation, cloud cover and evapotranspira- tion is given in [8]. Sea ice and sea level changes are as- sessed in [9]. The terrestrial biosphere is especially vulnerable to cli- matic changes [10]. Since anthropogenic land-use change is expected to have the largest effect [11] it is explicitly used as an anthropogenic driver in both of the scenarios Copyright © 2013 SciRes. JEP 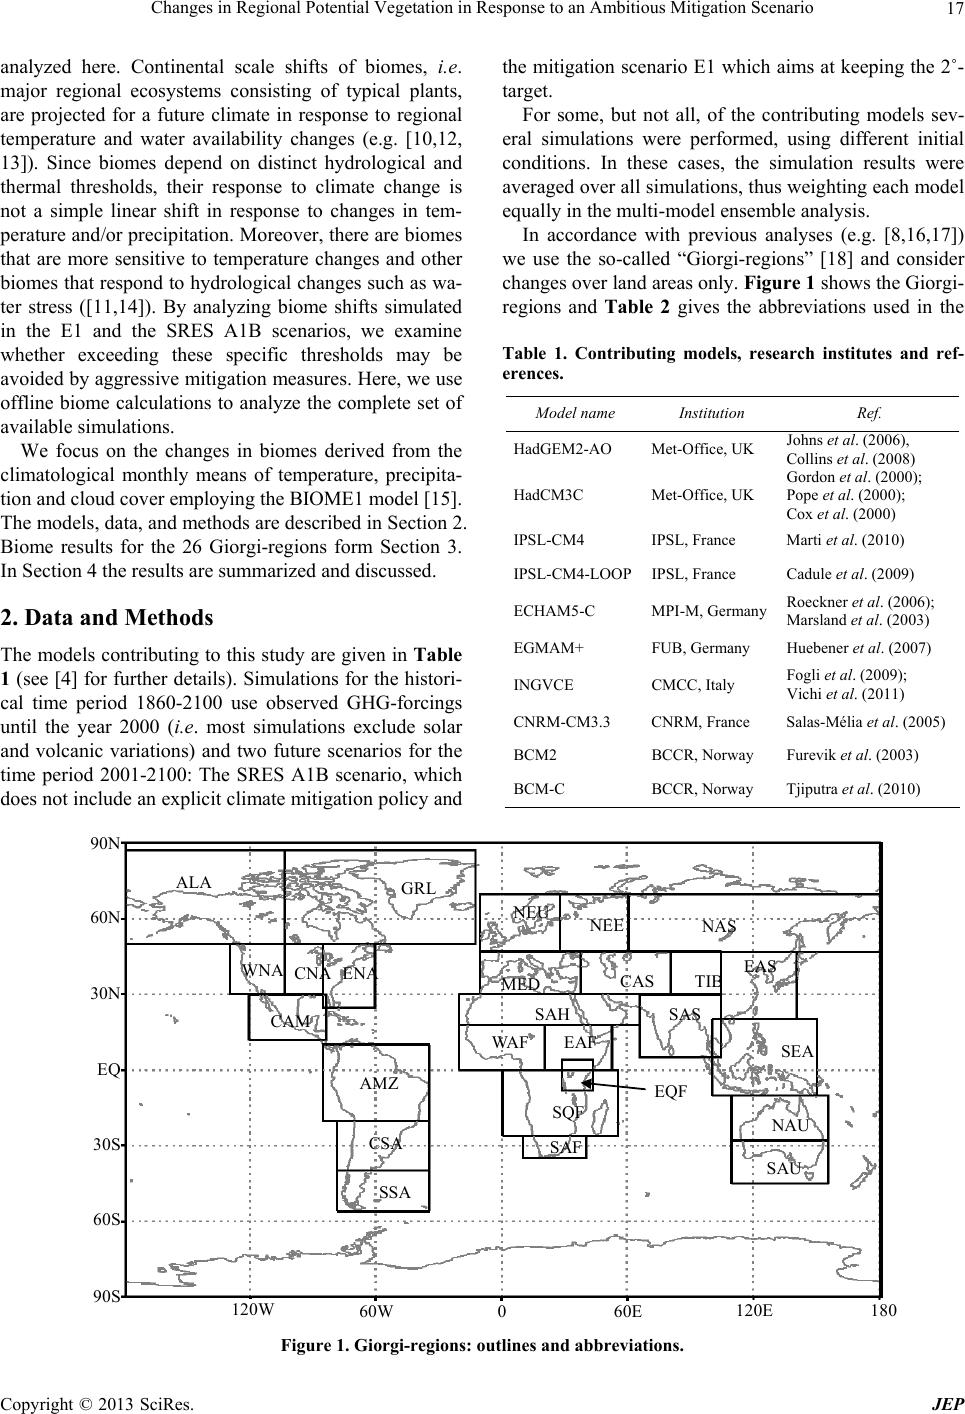 Changes in Regional Potential Vegetation in Response to an Ambitious Mitigation Scenario 17 analyzed here. Continental scale shifts of biomes, i.e. major regional ecosystems consisting of typical plants, are projected for a future climate in response to regional temperature and water availability changes (e.g. [10,12, 13]). Since biomes depend on distinct hydrological and thermal thresholds, their response to climate change is not a simple linear shift in response to changes in tem- perature and/or precipitation. Moreover, there are biomes that are more sensitive to temperature changes and other biomes that respond to hydrological changes such as wa- ter stress ([11,14]). By analyzing biome shifts simulated in the E1 and the SRES A1B scenarios, we examine whether exceeding these specific thresholds may be avoided by aggressive mitigation measures. Here, we use offline biome calculations to analyze the complete set of available simulations. We focus on the changes in biomes derived from the climatological monthly means of temperature, precipita- tion and cloud cover employing the BIOME1 model [15]. The models, data, and methods are described in Section 2. Biome results for the 26 Giorgi-regions form Section 3. In Section 4 the results are summarized and discussed. 2. Data and Methods The models contributing to this study are given in Table 1 (see [4] for further details). Simulations for the histori- cal time period 1860-2100 use observed GHG-forcings until the year 2000 (i.e . most simulations exclude solar and volcanic variations) and two future scenarios for the time period 2001-2100: The SRES A1B scenario, which does not include an explicit climate mitigation policy and the mitigation scenario E1 which aims at keeping the 2˚- target. For some, but not all, of the contributing models sev- eral simulations were performed, using different initial conditions. In these cases, the simulation results were averaged over all simulations, thus weighting each model equally in the multi-model ensemble analysis. In accordance with previous analyses (e.g. [8,16,17]) we use the so-called “Giorgi-regions” [18] and consider changes over land areas only. Figure 1 shows the Giorgi- regions and Table 2 gives the abbreviations used in the Table 1. Contributing models, research institutes and ref- erences. Model name Institution Ref. HadGEM2-AO Met-Office, UK Johns et al. (2006), Collins et al. (2008) HadCM3C Met-Office, UK Gordon et al. (2000); Pope et al. (2000); Cox et al. (2000) IPSL-CM4 IPSL, France Marti et al. (2010) IPSL-CM4-LOOPIPSL, France Cadule et al. (2009) ECHAM5-C MPI-M, Germany Roeckner et al. (2006); Marsland et al. (2003) EGMAM+ FUB, Germany Huebener et al. (2007) INGVCE CMCC, Italy Fogli et al. (2009); Vichi et al. (2011) CNRM-CM3.3 CNRM, France Salas-Mélia et al. (2005) BCM2 BCCR, Norway Furevik et al. (2003) BCM-C BCCR, Norway Tjiputra et al. (2010) ALA GRL WNA CNA ENA CAM AMZ CSA SSA NEU NEE NAS MED CAS TIB EAS SAS SEA NAU SAU SAH WAF EAF EQF SQF SAF 120W 60W 60E 0 120E 180 90S 60S 30S EQ 30N 60N 90N Figure 1. Giorgi-regions: outlines and abbreviations. Copyright © 2013 SciRes. JEP 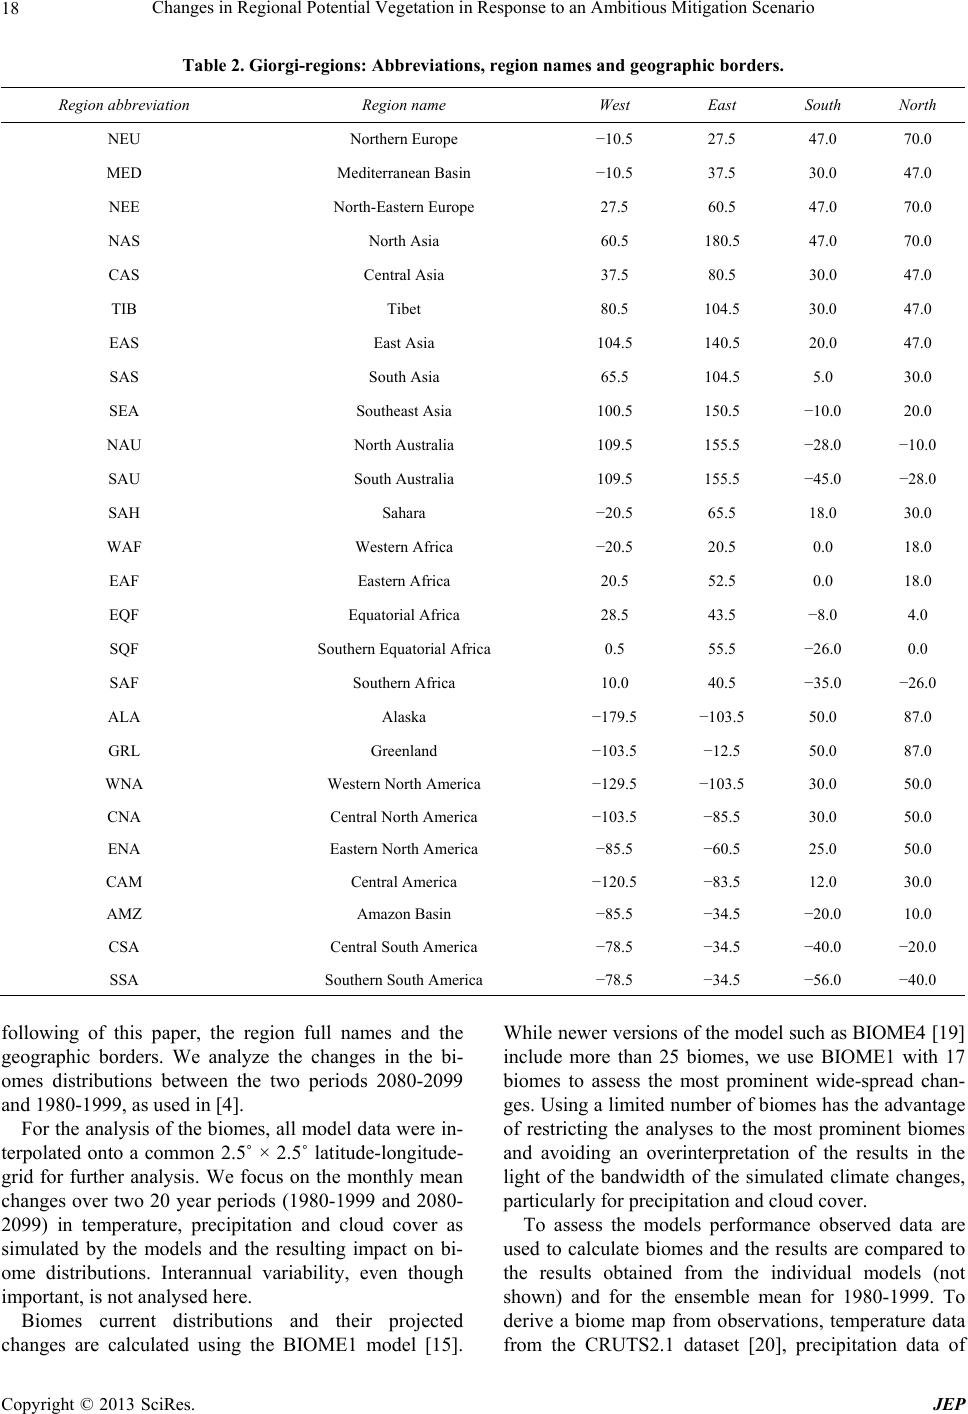 Changes in Regional Potential Vegetation in Response to an Ambitious Mitigation Scenario 18 Table 2. Giorgi-regions: Abbreviations, region names and geographic borders. Region abbreviation Region name West East South North NEU Northern Europe −10.5 27.5 47.0 70.0 MED Mediterranean Basin −10.5 37.5 30.0 47.0 NEE North-Eastern Europe 27.5 60.5 47.0 70.0 NAS North Asia 60.5 180.5 47.0 70.0 CAS Central Asia 37.5 80.5 30.0 47.0 TIB Tibet 80.5 104.5 30.0 47.0 EAS East Asia 104.5 140.5 20.0 47.0 SAS South Asia 65.5 104.5 5.0 30.0 SEA Southeast Asia 100.5 150.5 −10.0 20.0 NAU North Australia 109.5 155.5 −28.0 −10.0 SAU South Australia 109.5 155.5 −45.0 −28.0 SAH Sahara −20.5 65.5 18.0 30.0 WAF Western Africa −20.5 20.5 0.0 18.0 EAF Eastern Africa 20.5 52.5 0.0 18.0 EQF Equatorial Africa 28.5 43.5 −8.0 4.0 SQF Southern Equatorial Africa 0.5 55.5 −26.0 0.0 SAF Southern Africa 10.0 40.5 −35.0 −26.0 ALA Alaska −179.5 −103.5 50.0 87.0 GRL Greenland −103.5 −12.5 50.0 87.0 WNA Western North America −129.5 −103.5 30.0 50.0 CNA Central North America −103.5 −85.5 30.0 50.0 ENA Eastern North America −85.5 −60.5 25.0 50.0 CAM Central America −120.5 −83.5 12.0 30.0 AMZ Amazon Basin −85.5 −34.5 −20.0 10.0 CSA Central South America −78.5 −34.5 −40.0 −20.0 SSA Southern South America −78.5 −34.5 −56.0 −40.0 following of this paper, the region full names and the geographic borders. We analyze the changes in the bi- omes distributions between the two periods 2080-2099 and 1980-1999, as used in [4]. For the analysis of the biomes, all model data were in- terpolated onto a common 2.5˚ × 2.5˚ latitude-longitude- grid for further analysis. We focus on the monthly mean changes over two 20 year periods (1980-1999 and 2080- 2099) in temperature, precipitation and cloud cover as simulated by the models and the resulting impact on bi- ome distributions. Interannual variability, even though important, is not analysed here. Biomes current distributions and their projected changes are calculated using the BIOME1 model [15]. While newer versions of the model such as BIOME4 [19] include more than 25 biomes, we use BIOME1 with 17 biomes to assess the most prominent wide-spread chan- ges. Using a limited number of biomes has the advantage of restricting the analyses to the most prominent biomes and avoiding an overinterpretation of the results in the light of the bandwidth of the simulated climate changes, particularly for precipitation and cloud cover. To assess the models performance observed data are used to calculate biomes and the results are compared to the results obtained from the individual models (not shown) and for the ensemble mean for 1980-1999. To derive a biome map from observations, temperature data from the CRUTS2.1 dataset [20], precipitation data of Copyright © 2013 SciRes. JEP 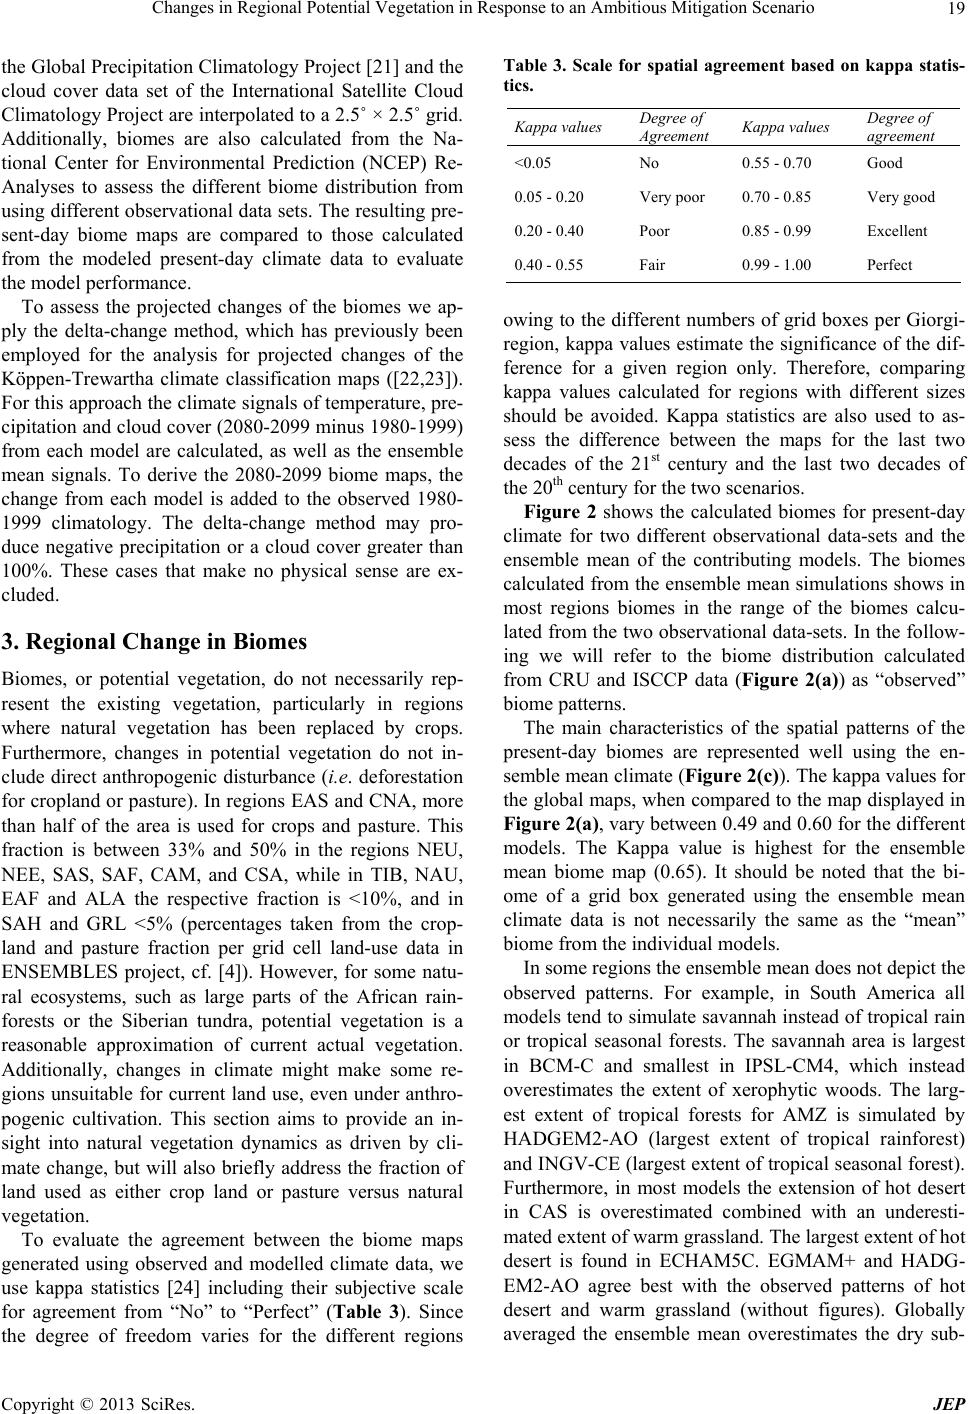 Changes in Regional Potential Vegetation in Response to an Ambitious Mitigation Scenario 19 the Global Precipitation Climatology Project [21] and the cloud cover data set of the International Satellite Cloud Climatology Project are interpolated to a 2.5˚ × 2.5˚ grid. Additionally, biomes are also calculated from the Na- tional Center for Environmental Prediction (NCEP) Re- Analyses to assess the different biome distribution from using different observational data sets. The resulting pre- sent-day biome maps are compared to those calculated from the modeled present-day climate data to evaluate the model performance. To assess the projected changes of the biomes we ap- ply the delta-change method, which has previously been employed for the analysis for projected changes of the Köppen-Trewartha climate classification maps ([22,23]). For this approach the climate signals of temperature, pre- cipitation and cloud cover (2080-2099 minus 1980-1999) from each model are calculated, as well as the ensemble mean signals. To derive the 2080-2099 biome maps, the change from each model is added to the observed 1980- 1999 climatology. The delta-change method may pro- duce negative precipitation or a cloud cover greater than 100%. These cases that make no physical sense are ex- cluded. 3. Regional Change in Biomes Biomes, or potential vegetation, do not necessarily rep- resent the existing vegetation, particularly in regions where natural vegetation has been replaced by crops. Furthermore, changes in potential vegetation do not in- clude direct anthropogenic disturbance (i.e. deforestation for cropland or pasture). In regions EAS and CNA, more than half of the area is used for crops and pasture. This fraction is between 33% and 50% in the regions NEU, NEE, SAS, SAF, CAM, and CSA, while in TIB, NAU, EAF and ALA the respective fraction is <10%, and in SAH and GRL <5% (percentages taken from the crop- land and pasture fraction per grid cell land-use data in ENSEMBLES project, cf. [4]). However, for some natu- ral ecosystems, such as large parts of the African rain- forests or the Siberian tundra, potential vegetation is a reasonable approximation of current actual vegetation. Additionally, changes in climate might make some re- gions unsuitable for current land use, even under anthro- pogenic cultivation. This section aims to provide an in- sight into natural vegetation dynamics as driven by cli- mate change, but will also briefly address the fraction of land used as either crop land or pasture versus natural vegetation. To evaluate the agreement between the biome maps generated using observed and modelled climate data, we use kappa statistics [24] including their subjective scale for agreement from “No” to “Perfect” (Table 3). Since the degree of freedom varies for the different regions Table 3. Scale for spatial agreement based on kappa statis- tics. Kappa values Degree of Agreement Kappa values Degree of agreement <0.05 No 0.55 - 0.70 Good 0.05 - 0.20 Very poor 0.70 - 0.85 Very good 0.20 - 0.40 Poor 0.85 - 0.99 Excellent 0.40 - 0.55 Fair 0.99 - 1.00 Perfect owing to the different numbers of grid boxes per Giorgi- region, kappa values estimate the significance of the dif- ference for a given region only. Therefore, comparing kappa values calculated for regions with different sizes should be avoided. Kappa statistics are also used to as- sess the difference between the maps for the last two decades of the 21st century and the last two decades of the 20th century for the two scenarios. Figure 2 shows the calculated biomes for present-day climate for two different observational data-sets and the ensemble mean of the contributing models. The biomes calculated from the ensemble mean simulations shows in most regions biomes in the range of the biomes calcu- lated from the two observational data-sets. In the follow- ing we will refer to the biome distribution calculated from CRU and ISCCP data (Figure 2(a)) as “observed” biome patterns. The main characteristics of the spatial patterns of the present-day biomes are represented well using the en- semble mean climate (Figure 2(c)). The kappa values for the global maps, when compared to the map displayed in Figure 2(a), vary between 0.49 and 0.60 for the different models. The Kappa value is highest for the ensemble mean biome map (0.65). It should be noted that the bi- ome of a grid box generated using the ensemble mean climate data is not necessarily the same as the “mean” biome from the individual models. In some regions the ensemble mean does not depict the observed patterns. For example, in South America all models tend to simulate savannah instead of tropical rain or tropical seasonal forests. The savannah area is largest in BCM-C and smallest in IPSL-CM4, which instead overestimates the extent of xerophytic woods. The larg- est extent of tropical forests for AMZ is simulated by HADGEM2-AO (largest extent of tropical rainforest) and INGV-CE (largest extent of tropical seasonal forest). Furthermore, in most models the extension of hot desert in CAS is overestimated combined with an underesti- mated extent of warm grassland. The largest extent of hot desert is found in ECHAM5C. EGMAM+ and HADG- EM2-AO agree best with the observed patterns of hot desert and warm grassland (without figures). Globally averaged the ensemble mean ates the dry sub- overestim Copyright © 2013 SciRes. JEP 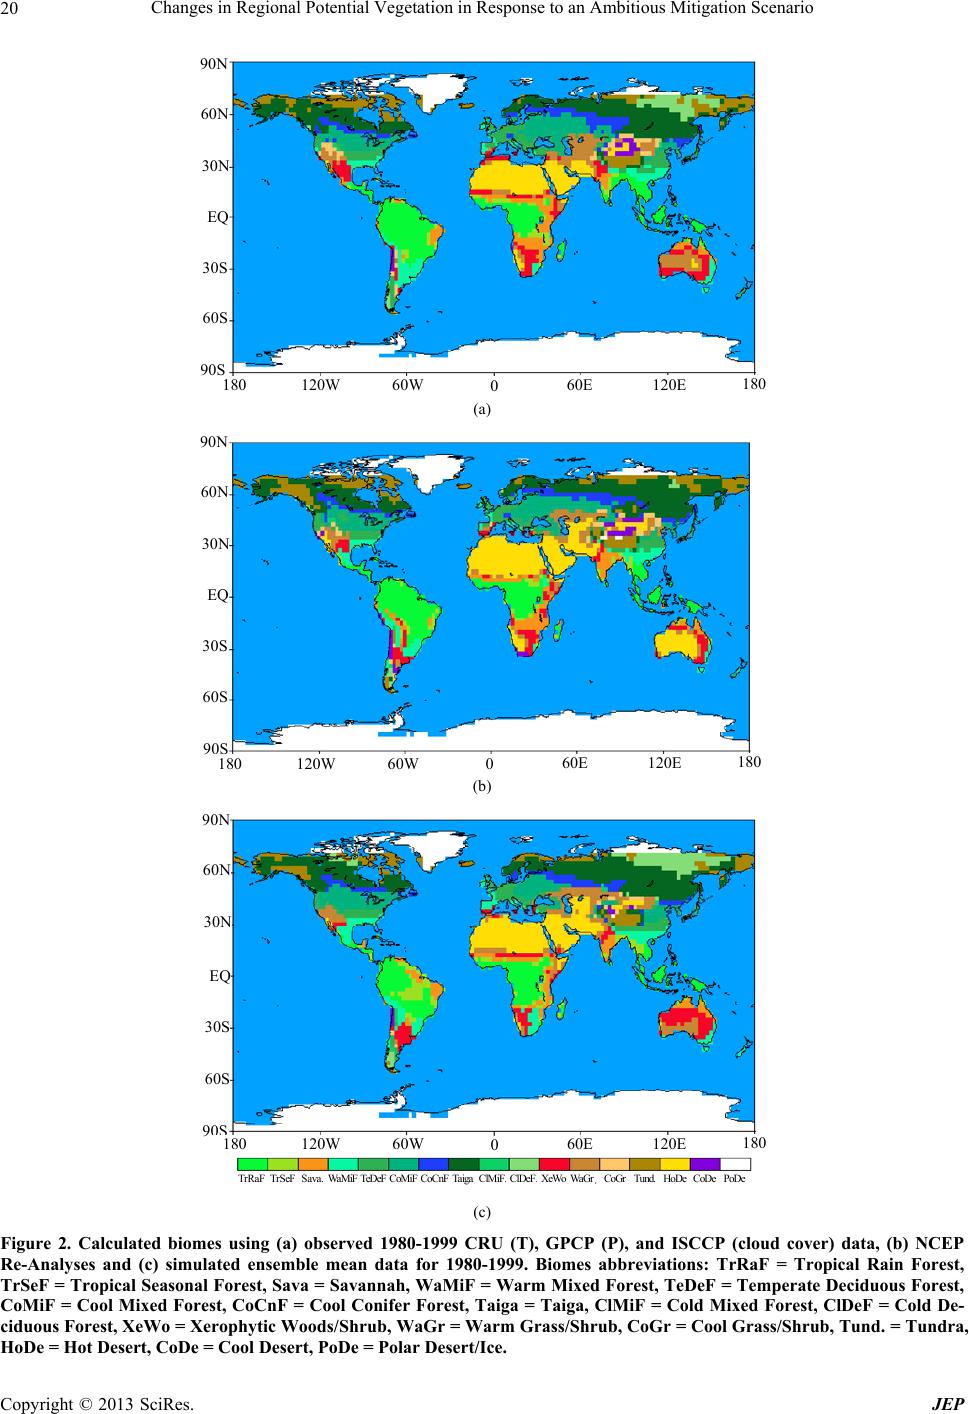 Changes in Regional Potential Vegetation in Response to an Ambitious Mitigation Scenario Copyright © 2013 SciRes. JEP 20 120W 60W60E 0120E 180 90S 60S 30S EQ 30N 60N 90N 180 (a) 120W 60W 60E 0 120E 180 90S 60S 30S EQ 30N 60N 90N 180 (b) 120W 60W60E 0120E 18 0 90S 60S 30S EQ 30N 60N 90N 180 TrRaF TrSeF Sava. Wa M i F TeDeF CoMiFCoCnFTaiga ClMiF ClDeF XeWoWaGr CoGr Tund. HoDe CoDe PoDe (c) Figure 2. Calculated biomes using (a) observed 1980-1999 CRU (T), GPCP (P), and ISCCP (cloud cover) data, (b) NCEP Re-Analyses and (c) simulated ensemble mean data for 1980-1999. Biomes abbreviations: TrRaF = Tropical Rain Forest, TrSeF = Tropical Seasonal Forest, Sava = Savannah, WaMiF = Warm Mixed Forest, TeDeF = Temperate Deciduous Forest, CoMiF = Cool Mixed Forest, CoCnF = Cool Conifer Forest, Taiga = Taiga, ClMiF = Cold Mixed Forest, ClDeF = Cold De- ciduous Forest, XeWo = Xerophytic Woods/Shrub, WaGr = Warm Grass/Shrub, CoGr = Cool Grass/Shrub, Tund. = Tundra, HoDe = Hot Desert, CoDe = Cool Desert, PoDe = Polar Desert/Ice. 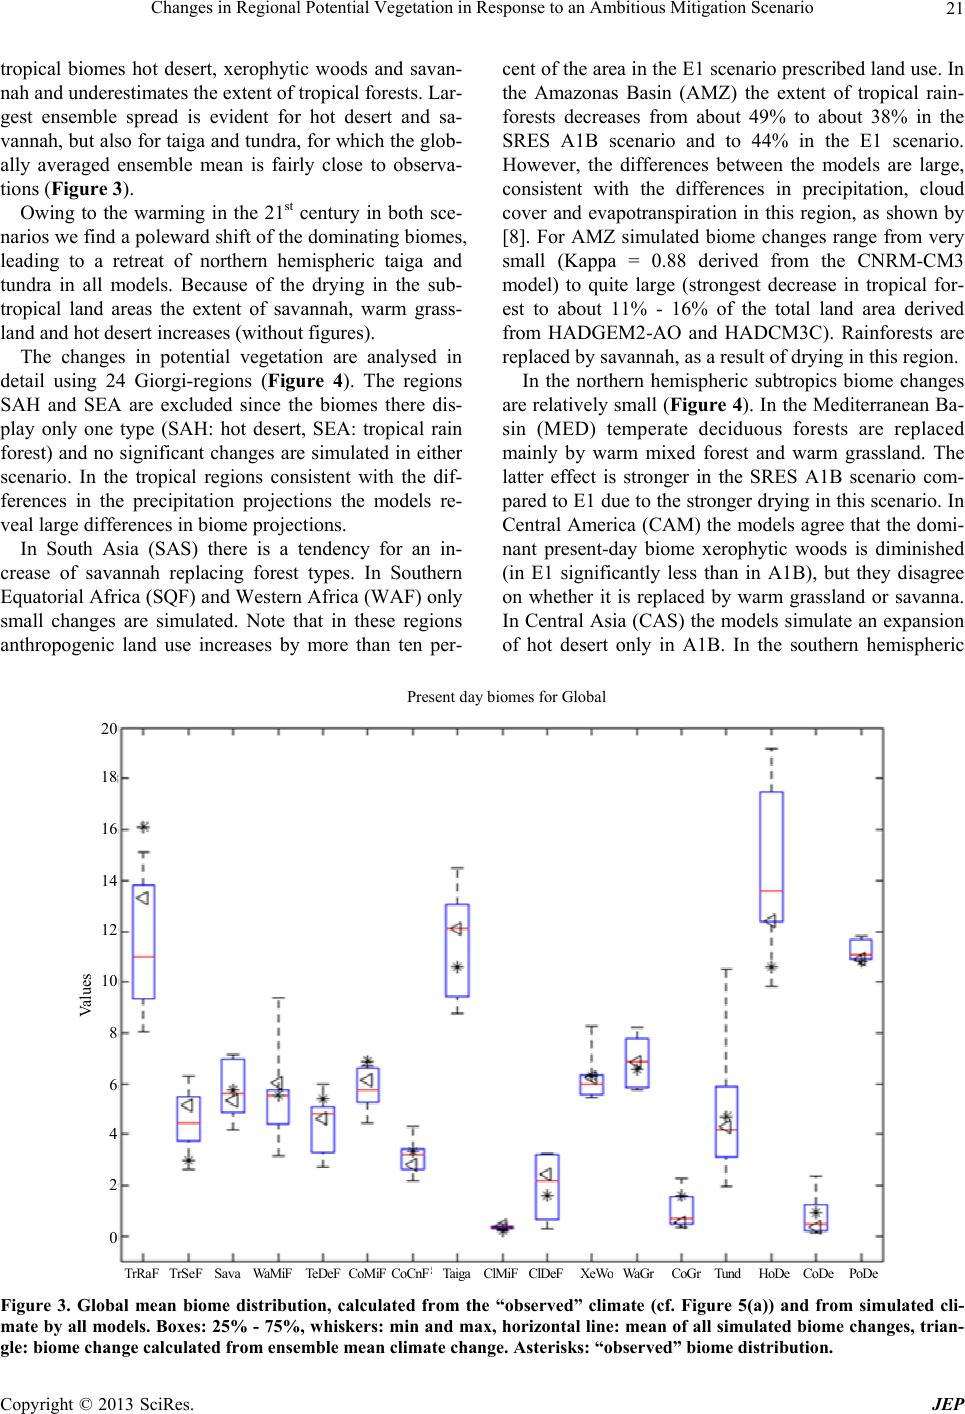 Changes in Regional Potential Vegetation in Response to an Ambitious Mitigation Scenario 21 tropical biomes hot desert, xerophytic woods and savan- nah and underestimates the extent of tropical forests. Lar- gest ensemble spread is evident for hot desert and sa- vannah, but also for taiga and tundra, for which the glob- ally averaged ensemble mean is fairly close to observa- tions (Figure 3). Owing to the warming in the 21st century in both sce- narios we find a poleward shift of the dominating biomes, leading to a retreat of northern hemispheric taiga and tundra in all models. Because of the drying in the sub- tropical land areas the extent of savannah, warm grass- land and hot desert increases (without figures). The changes in potential vegetation are analysed in detail using 24 Giorgi-regions (Figure 4). The regions SAH and SEA are excluded since the biomes there dis- play only one type (SAH: hot desert, SEA: tropical rain forest) and no significant changes are simulated in either scenario. In the tropical regions consistent with the dif- ferences in the precipitation projections the models re- veal large differences in biome projections. In South Asia (SAS) there is a tendency for an in- crease of savannah replacing forest types. In Southern Equatorial Africa (SQF) and Western Africa (WAF) only small changes are simulated. Note that in these regions anthropogenic land use increases by more than ten per- cent of the area in the E1 scenario prescribed land use. In the Amazonas Basin (AMZ) the extent of tropical rain- forests decreases from about 49% to about 38% in the SRES A1B scenario and to 44% in the E1 scenario. However, the differences between the models are large, consistent with the differences in precipitation, cloud cover and evapotranspiration in this region, as shown by [8]. For AMZ simulated biome changes range from very small (Kappa = 0.88 derived from the CNRM-CM3 model) to quite large (strongest decrease in tropical for- est to about 11% - 16% of the total land area derived from HADGEM2-AO and HADCM3C). Rainforests are replaced by savannah, as a result of drying in this region. In the northern hemispheric subtropics biome changes are relatively small (Figure 4). In the Mediterranean Ba- sin (MED) temperate deciduous forests are replaced mainly by warm mixed forest and warm grassland. The latter effect is stronger in the SRES A1B scenario com- pared to E1 due to the stronger drying in this scenario. In Central America (CAM) the models agree that the domi- nant present-day biome xerophytic woods is diminished (in E1 significantly less than in A1B), but they disagree on whether it is replaced by warm grassland or savanna. In Central Asia (CAS) the models simulate an expansion of hot desert only in A1B. In the southern hemispheric 0 TrRaF TrSeF Sava Wa M iF TeDe F CoMiFCoCnFTaiga ClMiF ClDeF XeWoWaGr CoGr Tund HoDe CoDe PoDe 2 4 6 8 Va lues 12 14 16 Present day biomes for Global 20 10 18 Figure 3. Global mean biome distribution, calculated from the “observed” climate (cf. Figure 5(a)) and from simulated cli- mate by all models. Boxes: 25% - 75%, whiskers: min and max, horizontal line: mean of all simulated biome changes, trian- gle: biome change calculated from ensemble mean climate change. Asterisks: “observed” biome distribution. Copyright © 2013 SciRes. JEP 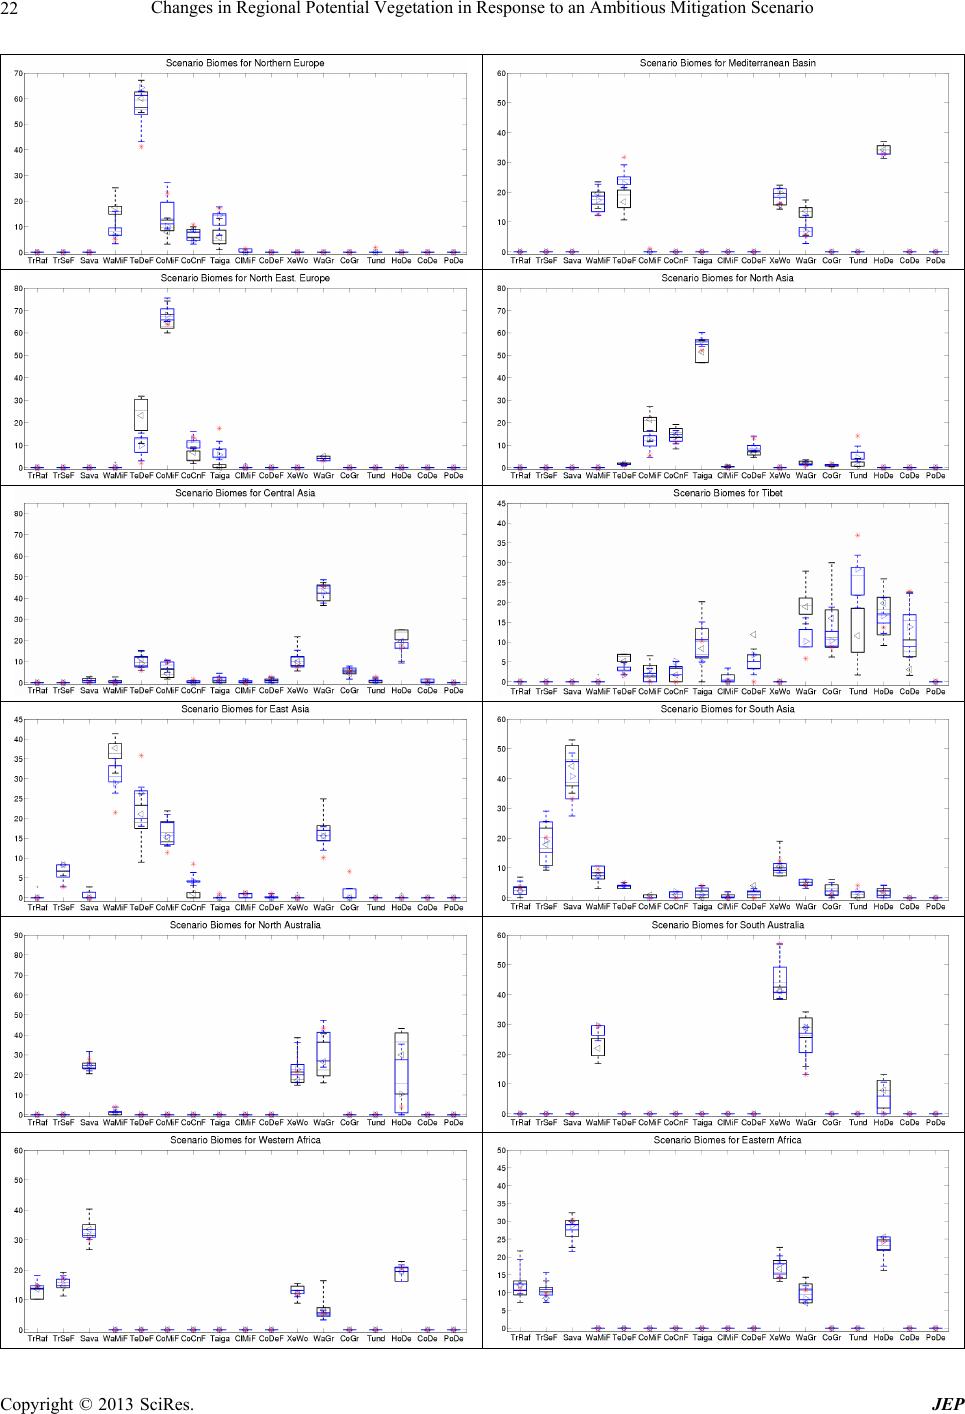 Changes in Regional Potential Vegetation in Response to an Ambitious Mitigation Scenario 22 Copyright © 2013 SciRes. JEP 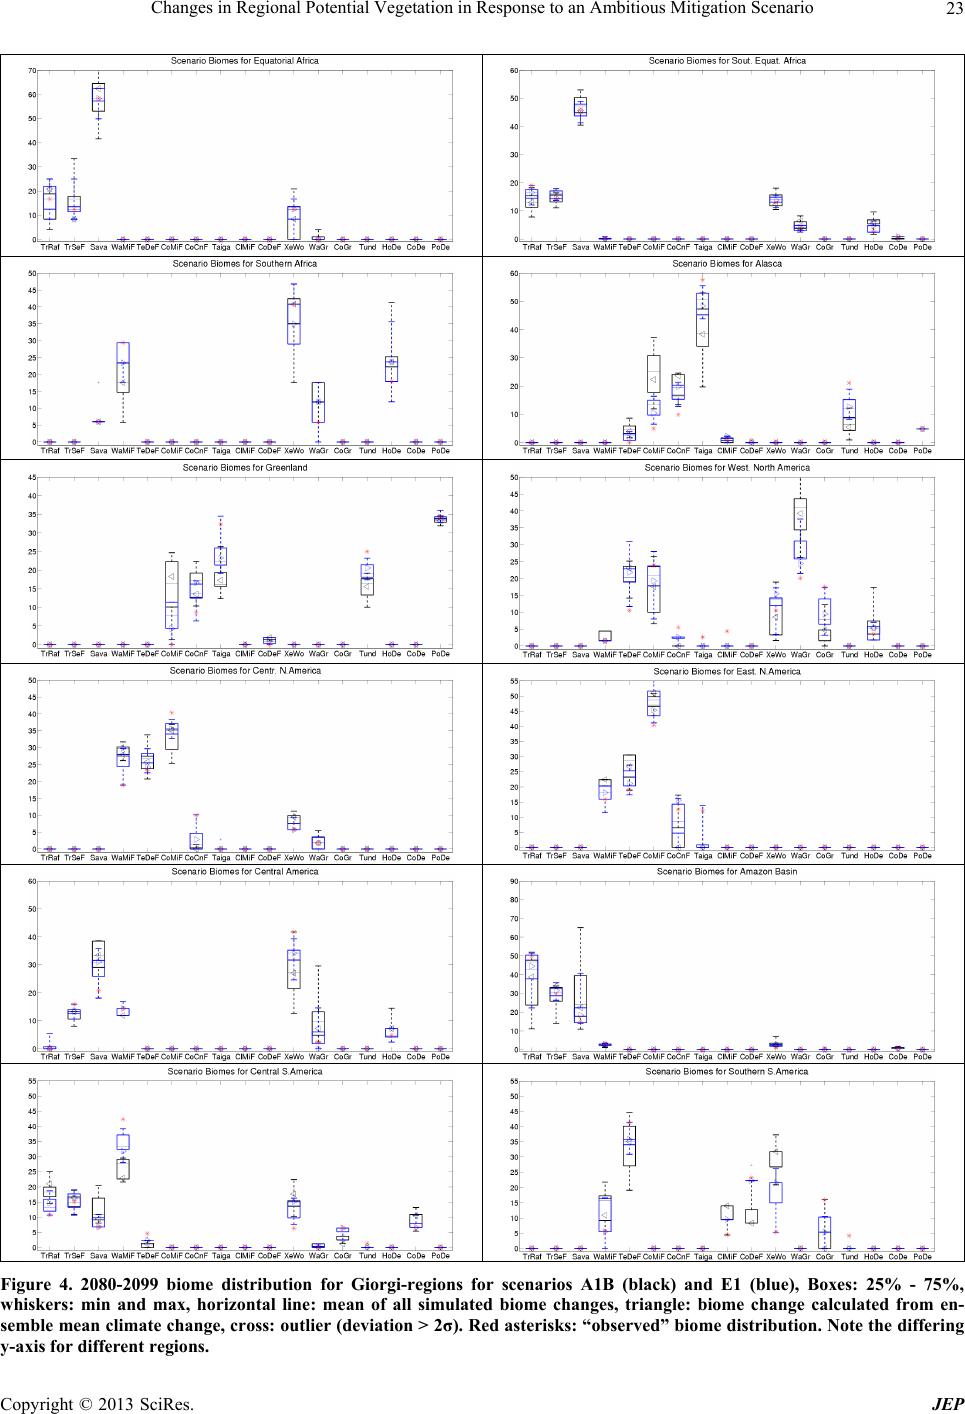 Changes in Regional Potential Vegetation in Response to an Ambitious Mitigation Scenario 23 Figure 4. 2080-2099 biome distribution for Giorgi-regions for scenarios A1B (black) and E1 (blue), Boxes: 25% - 75%, whiskers: min and max, horizontal line: mean of all simulated biome changes, triangle: biome change calculated from en- semble mean climate change, cross: outlier (deviation > 2σ). Red asterisks: “observed” biome distribution. Note the differing -axis for different regions. y Copyright © 2013 SciRes. JEP 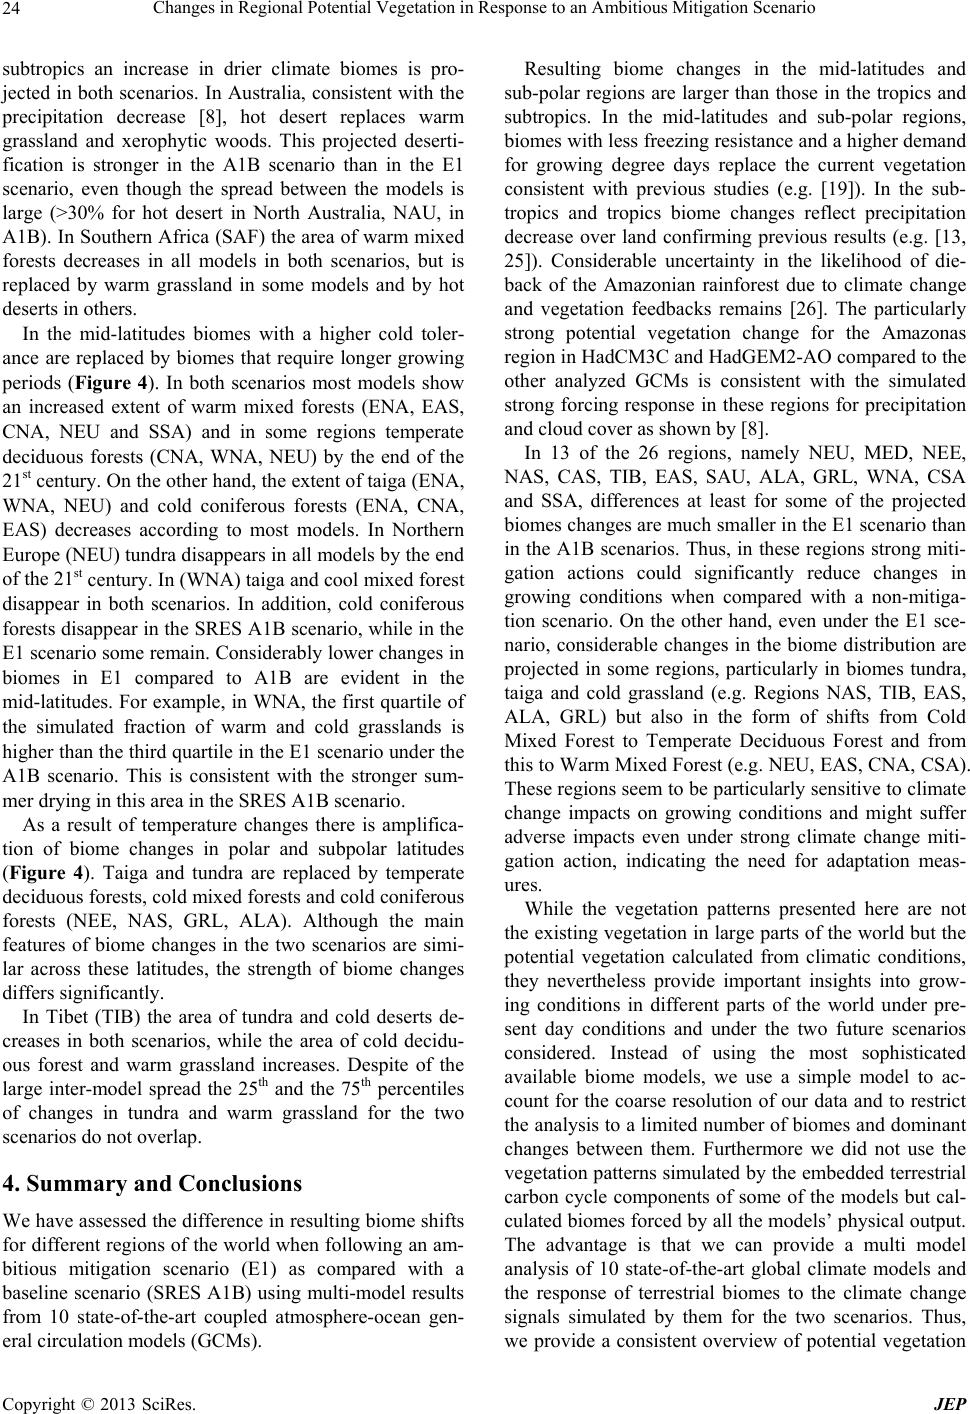 Changes in Regional Potential Vegetation in Response to an Ambitious Mitigation Scenario Copyright © 2013 SciRes. JEP 24 subtropics an increase in drier climate biomes is pro- jected in both scenarios. In Australia, consistent with the precipitation decrease [8], hot desert replaces warm grassland and xerophytic woods. This projected deserti- fication is stronger in the A1B scenario than in the E1 scenario, even though the spread between the models is large (>30% for hot desert in North Australia, NAU, in A1B). In Southern Africa (SAF) the area of warm mixed forests decreases in all models in both scenarios, but is replaced by warm grassland in some models and by hot deserts in others. In the mid-latitudes biomes with a higher cold toler- ance are replaced by biomes that require longer growing periods (Figure 4). In both scenarios most models show an increased extent of warm mixed forests (ENA, EAS, CNA, NEU and SSA) and in some regions temperate deciduous forests (CNA, WNA, NEU) by the end of the 21st century. On the other hand, the extent of taiga (ENA, WNA, NEU) and cold coniferous forests (ENA, CNA, EAS) decreases according to most models. In Northern Europe (NEU) tundra disappears in all models by the end of the 21st century. In (WNA) taiga and cool mixed forest disappear in both scenarios. In addition, cold coniferous forests disappear in the SRES A1B scenario, while in the E1 scenario some remain. Considerably lower changes in biomes in E1 compared to A1B are evident in the mid-latitudes. For example, in WNA, the first quartile of the simulated fraction of warm and cold grasslands is higher than the third quartile in the E1 scenario under the A1B scenario. This is consistent with the stronger sum- mer drying in this area in the SRES A1B scenario. As a result of temperature changes there is amplifica- tion of biome changes in polar and subpolar latitudes (Figure 4). Taiga and tundra are replaced by temperate deciduous forests, cold mixed forests and cold coniferous forests (NEE, NAS, GRL, ALA). Although the main features of biome changes in the two scenarios are simi- lar across these latitudes, the strength of biome changes differs significantly. In Tibet (TIB) the area of tundra and cold deserts de- creases in both scenarios, while the area of cold decidu- ous forest and warm grassland increases. Despite of the large inter-model spread the 25th and the 75th percentiles of changes in tundra and warm grassland for the two scenarios do not overlap. 4. Summary and Conclusions We have assessed the difference in resulting biome shifts for different regions of the world when following an am- bitious mitigation scenario (E1) as compared with a baseline scenario (SRES A1B) using multi-model results from 10 state-of-the-art coupled atmosphere-ocean gen- eral circulation models (GCMs). Resulting biome changes in the mid-latitudes and sub-polar regions are larger than those in the tropics and subtropics. In the mid-latitudes and sub-polar regions, biomes with less freezing resistance and a higher demand for growing degree days replace the current vegetation consistent with previous studies (e.g. [19]). In the sub- tropics and tropics biome changes reflect precipitation decrease over land confirming previous results (e.g. [13, 25]). Considerable uncertainty in the likelihood of die- back of the Amazonian rainforest due to climate change and vegetation feedbacks remains [26]. The particularly strong potential vegetation change for the Amazonas region in HadCM3C and HadGEM2-AO compared to the other analyzed GCMs is consistent with the simulated strong forcing response in these regions for precipitation and cloud cover as shown by [8]. In 13 of the 26 regions, namely NEU, MED, NEE, NAS, CAS, TIB, EAS, SAU, ALA, GRL, WNA, CSA and SSA, differences at least for some of the projected biomes changes are much smaller in the E1 scenario than in the A1B scenarios. Thus, in these regions strong miti- gation actions could significantly reduce changes in growing conditions when compared with a non-mitiga- tion scenario. On the other hand, even under the E1 sce- nario, considerable changes in the biome distribution are projected in some regions, particularly in biomes tundra, taiga and cold grassland (e.g. Regions NAS, TIB, EAS, ALA, GRL) but also in the form of shifts from Cold Mixed Forest to Temperate Deciduous Forest and from this to Warm Mixed Forest (e.g. NEU, EAS, CNA, CSA). These regions seem to be particularly sensitive to climate change impacts on growing conditions and might suffer adverse impacts even under strong climate change miti- gation action, indicating the need for adaptation meas- ures. While the vegetation patterns presented here are not the existing vegetation in large parts of the world but the potential vegetation calculated from climatic conditions, they nevertheless provide important insights into grow- ing conditions in different parts of the world under pre- sent day conditions and under the two future scenarios considered. Instead of using the most sophisticated available biome models, we use a simple model to ac- count for the coarse resolution of our data and to restrict the analysis to a limited number of biomes and dominant changes between them. Furthermore we did not use the vegetation patterns simulated by the embedded terrestrial carbon cycle components of some of the models but cal- culated biomes forced by all the models’ physical output. The advantage is that we can provide a multi model analysis of 10 state-of-the-art global climate models and the response of terrestrial biomes to the climate change signals simulated by them for the two scenarios. Thus, we provide a consistent overview of potential vegetation  Changes in Regional Potential Vegetation in Response to an Ambitious Mitigation Scenario 25 response to an ambitious mitigation scenario (E1) com- pared to a baseline scenario (A1B). Further research should focus on the regions with the largest sensitivity to climate change with respect to growing conditions. In these regions, both natural vegetation and anthropogenic land-use should be reviewed as to their resilience under projected climate change for different forcing scenarios. 5. Acknowledgements The ENSEMBLES model-outputs used in this work were produced with the partial funding of the EU FP6 Inte- grated Project ENSEMBLES (Contract number 505539), whose support is gratefully acknowledged. REFERENCES [1] R. H. Moss, et al., “The Next Generation of Scenarios for Climate Change Research and Assessment,” Nature, Vol. 463, 2010, pp. 747-756. doi:10.1038/nature08823 [2] P. van der Linden and J. F. B. Mitchell, “ENSEMBLES: Climate Change and Its Impacts: Summary of Research and Results from the ENSEMBLES Project,” Met Office Hadley Centre, 2009, 160 p. [3] J. A. Lowe, C. D. Hewitt, D. P. van Vuuren, T. C. Johns, E. Stehfest, J.-F. Royer and P. J. van der Linden, “New Study for Climate Modeling, Analyses, and Scenarios,” Eos, Transactions American Geophysical Union, Vol. 90, No. 21, 2009, pp. 181-182. doi:10.1029/2009EO210001 [4] T. C. Johns, J.-F. Royer, I. Höschel, H. Huebener, E. Roeckner, E., Manzini, W. May, J.-L. Dufresne, O. H. Otterå, D. P. van Vuuren, D. Salas y Melia, M. Giorgetta, S. Denvil, S. Yang, P. G. Fogli, J. Körper and C. D. Hew- itt, “Climate Change under Aggressive Mitigation: The ENSEMBLES Multi-Model Experiment,” Climate Dy- namics, Vol. 37, No. 9-10, 2011, pp. 1975-2003. doi:10.1007/s00382-011-1005-5 [5] D. G. Streets, et al., “Two-Decadal Aerosol Trends as a Likely Explanation of the Global Dimming/Brightening Transition,” Geophysical Research Letters, Vol. 33, No. 15, 2006, p. L15806. doi:10.1029/2006GL026471 [6] M. I. Mischchenko, et al., “Long-Term Satellite Record Reveals Likely Recent Aerosol Trend,” Science, Vol. 315, No. 5851, 2007, p. 1543. doi:10.1126/science.1136709 [7] G. A. Meehl, T. F. Stocker, et al., “Global Climate Pro- jections,” In: S. Solomon, et al., Eds., Climate Change 2007: The Physical Science Basis, Cambridge University Press, Cambridge, New York, 2007, pp. 747-846. [8] H. Huebener, M. G. Sanderson, I. Höschel, J. Körper, T. C. Johns, J.-F. Royer, E. Roeckner, E. Manzini, J.-L. Du- fresne, O. H. Otterå, J. Tjiputra, D. S. Y Melia, M. Gior- getta, S. Denvil and P. G. Fogli, “Regional Hydrological Cycle Changes in Response to an Ambitious Mitigation Scenario,” Climatic Change, 2013. doi:10.1007/s10584-013-0829-x [9] J. Körper, I. Höschel, J. A. Lowe, C. D. Hewitt, D. Salas y Melia, E. Roeckner, H. Huebener, J.-F. Royer, J.-L. Dufresne, A. Pardaens, M. A. Giorgetta, M. G. Sanderson, O. H. Otterå, J. Tjiputra and S. Denvil, “The Effects of Aggressive Mitigation on Steric Sea Level Rise and Sea Ice Changes,” Climate Dynamics, Vol. 40, No. 3-4, 2013, pp. 531-550. doi:10.1007/s00382-012-1612-9 [10] A. Fischlin, G. F. Midgley, J. T. Price, R. Leemans, B. Gopal, C. Turley, M. D. A. Rounsevell, O. P. Dube, J. Tarazona and A. A. Velichko, “Ecosystems, Their Prop- erties, Goods, and Services,” In: M. L. Parry, O. F. Can- ziani, J. P. Palutikof, P. J. van der Linden and C. E. Han- son, Eds., Climate Change 2007: Impacts, Adaptation and Vulnerability, Cambridge University Press, Cambridge, 2007, pp. 211-272. [11] O. E. Sala, F. S. Chapin, J. J. Armesto, E. Berlow, J. Bloomfield, R. Dirzo, E. Huber-Sanwald, L. F. Huenneke, R. B. Jackson, A. Kinzig, R. Leemans, D. M. Lodge, H. A. Mooney, M. Oesterheld, A. L. Poff, M. T. Sykes, B. H. Walker, M. Walker and D. H. Wall, “Global Biodiversity Scenarios for the Year 2100,” Science, Vol. 287, No. 5459, 2000, pp. 1770-1774. [12] A. D. Hansen, R. P. Neilson, V. H. Dale, C. H. Flather, L. R. Iverson, D. J. Currie, S. Shaver, R. Cook and P. J. Bartlein, “Global Change in Forests: Responses of Spe- cies, Communities and Biomes,” BioScience, Vol. 51, No. 9, 2001, pp. 765-779. doi:10.1641/0006-3568(2001)051[0765:GCIFRO]2.0.CO ;2 [13] S. Sitch, C. Huntingford, N. Gedney, P. E. Levy, M. Lo- mas, S. L. Piao, R. Betts, P. Ciais, P. Cox, P. Friedling- stein, C. D. Jones, I. C. Prentice and F. I. Woodward, “Evaluation of the Terrestrial Carbon Cycle, Future Plant Geography and Climate-Carbon Cycle Feedbacks Using Five Dynamic Global Vegetation Models (DGVMs),” Global Change Biology, Vol. 14, No. 9, 2008, pp. 2015- 2039. doi:10.1111/j.1365-2486.2008.01626.x [14] M. Kirschbaum and A. Fischlin, “Climate Change Im- pacts on Forests,” In: R. Watson, M. C. Zinyowera and R. H. Moss, Eds., Climate Change 1995: Impacts; Adapta- tions and Mitigation of Climate Change. Scientific-Tech- nical Analysis, Cambridge University Press, Cambridge, 1996, pp. 95-129. [15] I. C. Prentice, W. Cramer, S. P. Harrison, R. Leemans, R. A. Monserud and M. A. Solomon, “A Global Biome Model Based on Plant Physiology and Dominance, Soil Properties and Climate” Journal of Biogeography, Vol. 19, No. 2, 1992, pp. 117-134. doi:10.2307/2845499 [16] W. May, “Climatic Changes Associated with a Global ‘2˚C-Stabilization’ Scenario Simulated by the ECHAM5/ MPI-OM Coupled Climate Model,” Climate Dynamics, Vol. 31, No. 2-3, 2008, pp. 283-313. doi:10.1007/s00382-007-0352-8 [17] J. H. Christensen, B. Hewitson, et al., “Regional Climate Projections,” In: S. Solomon, et al., Eds., Climate Change 2007: The Physical Science Basis, Cambridge University Press, Cambridge, New York, 2007, Chapter 11. [18] F. Giorgi and X. Bi, “Updated Regional Precipitation and Temperature Changes for the 21st Century from Ensem- bles of Recent AOGCM Simulations,” Geophysical Re- search Letters, Vol. 32, No. 21, 2005, p. L21715. doi:10.1029/2005GL024288 Copyright © 2013 SciRes. JEP  Changes in Regional Potential Vegetation in Response to an Ambitious Mitigation Scenario Copyright © 2013 SciRes. JEP 26 [19] J. O. Kaplan, et al., “Climate Change and Arctic Ecosys- tems: 2. Modeling, Paleodata-Model Comparisons, and Future Projections,” Journal of Geophysical Research: Atmospheres, Vol. 108, No. D19, 2003, p. 8171. doi:10.1029/2002JD002559 [20] T. D. Mitchell and P. D. Jones, “An Improved Method of Constructing a Database of Monthly Climate Observa- tions and Associated High-Resolution Grids,” Journal of Geophysical Research: Atmospheres, Vol. 25, No. 6, 2005, pp. 693-712. doi:10.1002/joc.1181 [21] G. J. Huffman, R. F. Adler, M. Morrissey, D. T. Bolvin, S. Curtis, R. Joyce, B. McGavock and J. Susskind, “Global Precipitation at One-Degree Daily Resolution from Multi- Satellite Observations,” Journal of Hydrometeorology, Vol. 2, No. 1, 2001, pp. 36-50. doi:10.1175/1525-7541(2001)002<0036:GPAODD>2.0.C O;2 [22] M. de Castro, C. Gallardo, K. Jylha and K. Tuomenvirta, “The Use of a Climate-Type Classification for Assessing Climate Change Effects in Europe from Ensemble of Nine Regional Climate Models,” Climatic Change, Vol. 81, No. 1, 2007, pp. 329-342. doi:10.1007/s10584-006-9224-1 [23] F. Hanf, J. Körper, T. Spangehl and U. Cubasch, “Shifts of Climate Zones in Multi-Model Climate Change Expe- riments Using the Koppen Climate Classification,” Mete- orologische Zeitschrift, Vol. 21, No. 2, 2012, pp. 111-123. doi:10.1127/0941-2948/2012/0344 [24] R. A. Monserud and R. Leemans, “Comparing Global Vegetation Maps with the Kappa Statistic,” Ecological Modelling, Vol. 62, No. 4, 1992, pp. 275-293. doi:10.1016/0304-3800(92)90003-W [25] C. A. Alo and G. Wang, “Potential Future Changes of the Terrestrial Ecosystem Based on Climate Projections by Eight General Circulation Models,” Journal of Geophy- sical Research, Vol. 113, No. G1, 2008, p. G01004. doi:10.1029/2007JG000528 [26] Y. Malhi, et al., “Exploring the Likelihood and Mecha- nism of a Climate-Change Induced Dieback of the Ama- zon Rainforest,” Proceedings of the National Academy of Sciences, Vol. 106, No. 49, 2009, pp. 20610-20615. doi:10.1073/pnas.0804619106 |