

Paper Menu >>
Journal Menu >>
 Pharmacology & Pharmacy, 2013, 4, 438-442 http://dx.doi.org/10.4236/pp.2013.45062 Published Online August 2013 (http://www.scirp.org/journal/pp) Use of Spatial Analysis to Assess Geographic Accessibility of Community Pharmacies in São Mateus Brígida Dias Fernandes1, Aracelli Ferreira Lírio1, Rodrigo Randow de Freitas2*, Ana Carolina Melchiors3 1Universidade Federal do Espírito Santo-UFES, Centro Universitário Norte do Espírito Santo-CEUNES, Departamento de Ciências da Saúde-DCS, São Mateus, Brasil; 2Universidade Federal do Espírito Santo-UFES, Centro Universitário Norte do Espírito Santo-CEUNES, Departamento de Engenharias e Computação-DETEC, Núcleo de Pesquisa em Gestão de Sistemas de Produção (NPGSP), Laboratório de Gestão Costeira-Aquicultura e Pesca (LGCap), São Mateus, Brasil; 3Pharmacy Pratice Research Group, Departamento de Ciências da Saúde-DCS, São Mateus, Brasil. Email: *[email protected] Received May 20th, 2013; revised June 28th, 2013; accepted July 19th, 2013 Copyright © 2013 Brígida Dias Fernandes et al. This is an open access article distributed under the Creative Commons Attribution License, which permits unrestricted use, distribution, and reproduction in any medium, provided the original work is properly cited. ABSTRACT Pharmaceutical services contribute to the rational use of medicines by ensuring the provision of appropriate, safe and effective pharmacotherapies. Thus, it is important to investigate whether the geographical distribution of pharmacies causes inequalities in access in countries like Brazil, where there is no federal law regulating the opening of new esta- blishments (in contrast to many European countries). This study analyzed the accessibility of community pharmacies in the city of São Mateus, Espírito Santo, Brazil. The authors obtained the geographical coordinates of pharmacies and healthfacilities, which scanned and georeferenced the study area. The 40 pharmacies included in the spatial analysis presented a heterogeneous distribution, with the existence of neighborhoods with an accumulation of pharmacies and others with no pharmacies. The authors found that only 43.7% of the study area received pharmaceutical service covera- ge, when buffer zones of 350 meters are incorporated, and that most of the districts have a minimum distance of 100 meters between health facilities and pharmacies. It was concluded that the use of GIS proved to be very suitable for analysis of pharmaceutical services, enabling knowledge of the local situation and serving as a stimulus for future studi- es. Keywords: Geographical Accessibility; Quality Pharmaceutical Service; Spatial Analysis; Distribution of Pharmacies; Quality Assessment 1. Introduction This study defines access to health services narrowly, utilizing Avedis Donabedian’s conceptualization of geo- graphical accessibility [1]. According to Donabedian, the quality of health services can be assessed by attributes that include socio-organizational and geographical ac- cessibility. These two dimensions are interrelated and express characteristics of health services that can facili- tate or impede access by users. Geographical accessi- bility refers to the location of supply and the location of users, as well as the physical and temporal distance patients must travel to get the care they need and/or want [1-3]. When analyzing pharmaceutical services in Brazil from the perspective of geographical accessibility, phar- maceutical services, it is observed that the geographical distribution of pharmacies is unordered, because there is no federal law that establishes geographic and demo- graphic criteria for the opening of new establishments. Thus, pharmacies may accumulate in certain areas of the city and exceed the ratio of pharmacies recommended by the World Health Organization (one for every 6000 to 7000 people) [4]. This is in contrast to some European countries, where there is specific legislation that guides the distribution of pharmacies. In Portugal [5], for example, legislation states that for a new pharmacy to be installed, it must be at least 350 meters distant from other pharmacies; a minimum distance of 100 meters between the pharmacy and a health center or hospital must be observed; and must be at least 3500 inhabitants. In other *Corresponding a uthor. Copyright © 2013 SciRes. PP 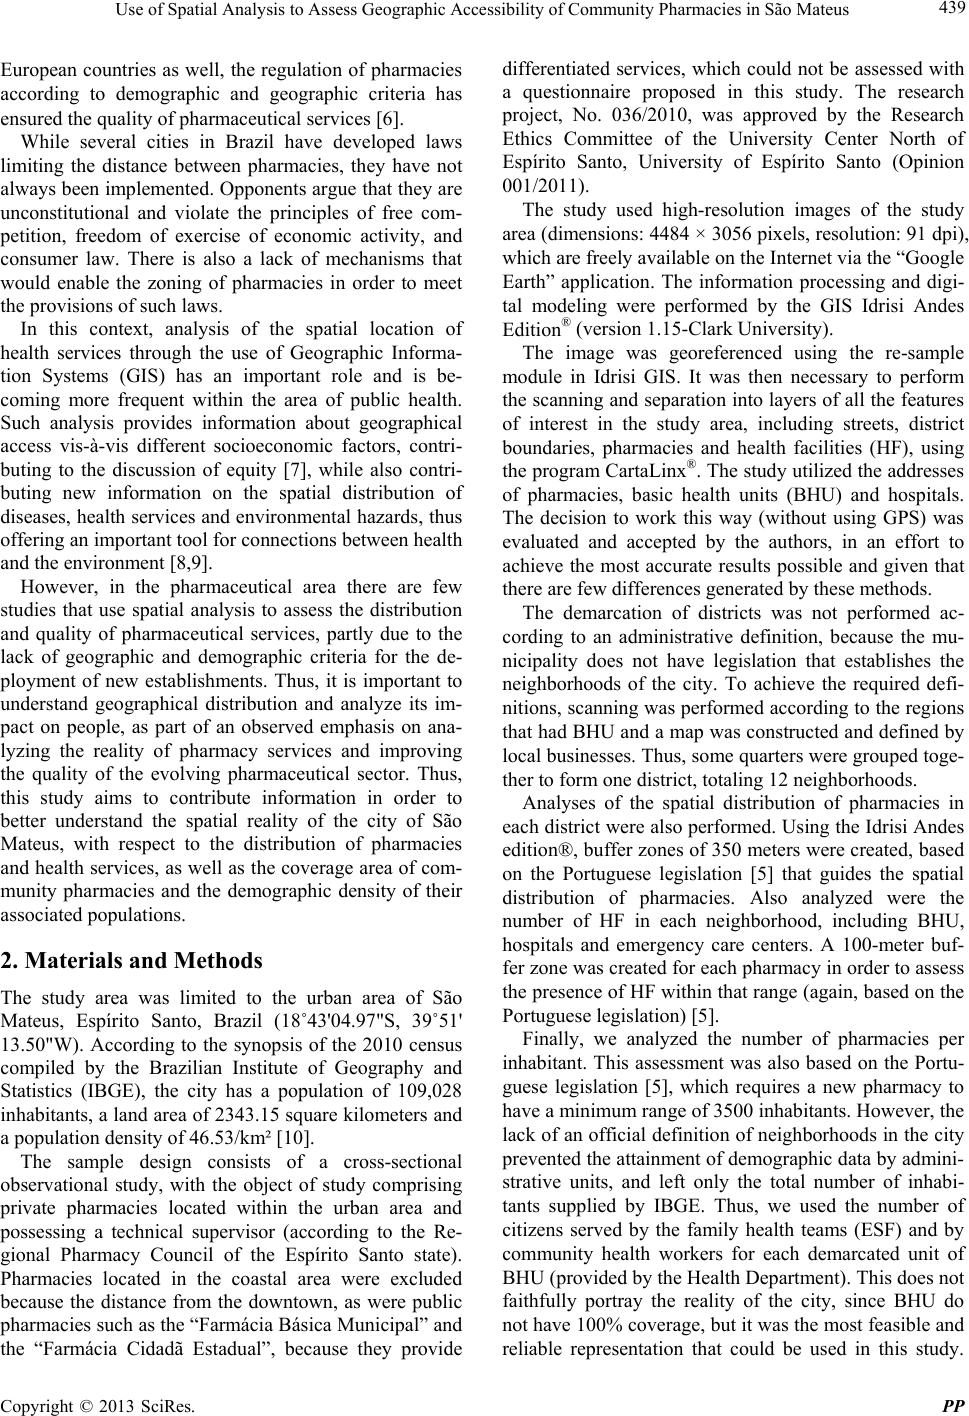 Use of Spatial Analysis to Assess Geographic Accessibility of Community Pharmacies in São Mateus 439 European countries as well, the regulation of pharmacies according to demographic and geographic criteria has ensured the quality of pharmaceutical services [6]. While several cities in Brazil have developed laws limiting the distance between pharmacies, they have not always been implemented. Opponents argue that they are unconstitutional and violate the principles of free com- petition, freedom of exercise of economic activity, and consumer law. There is also a lack of mechanisms that would enable the zoning of pharmacies in order to meet the provisions of such laws. In this context, analysis of the spatial location of health services through the use of Geographic Informa- tion Systems (GIS) has an important role and is be- coming more frequent within the area of public health. Such analysis provides information about geographical access vis-à-vis different socioeconomic factors, contri- buting to the discussion of equity [7], while also contri- buting new information on the spatial distribution of diseases, health services and environmental hazards, thus offering an important too l for connections between health and the environment [8,9]. However, in the pharmaceutical area there are few studies that use spatial analysis to assess the distribution and quality of pharmaceutical services, partly due to the lack of geographic and demographic criteria for the de- ployment of new establishments. Thus, it is important to understand geographical distribution and analyze its im- pact on people, as part of an observed emphasis on ana- lyzing the reality of pharmacy services and improving the quality of the evolving pharmaceutical sector. Thus, this study aims to contribute information in order to better understand the spatial reality of the city of São Mateus, with respect to the distribution of pharmacies and health services, as well as the coverage area of com- munity pharmacies and the demographic density of their associated populations. 2. Materials and Methods The study area was limited to the urban area of São Mateus, Espírito Santo, Brazil (18˚43'04.97"S, 39˚51' 13.50"W). According to the synopsis of the 2010 census compiled by the Brazilian Institute of Geography and Statistics (IBGE), the city has a population of 109,028 inhabitants, a lan d area of 2343.15 square kilometers and a population density of 46.53/km² [10]. The sample design consists of a cross-sectional observational study, with the object of study comprising private pharmacies located within the urban area and possessing a technical supervisor (according to the Re- gional Pharmacy Council of the Espírito Santo state). Pharmacies located in the coastal area were excluded because the distance from the downtown, as were public pharmacies such as the “Farmácia Básica Municipal” and the “Farmácia Cidadã Estadual”, because they provide differentiated services, which could not be assessed with a questionnaire proposed in this study. The research project, No. 036/2010, was approved by the Research Ethics Committee of the University Center North of Espírito Santo, University of Espírito Santo (Opinion 001/2011). The study used high-resolution images of the study area (dimensions: 4484 × 3056 pix els, resolutio n: 91 dpi) , which are freely available on the Internet via the “Google Earth” application. The information processing and digi- tal modeling were performed by the GIS Idrisi Andes Edition® (version 1.15-Clark University). The image was georeferenced using the re-sample module in Idrisi GIS. It was then necessary to perform the scanning and separation into layers of all th e features of interest in the study area, including streets, district boundaries, pharmacies and health facilities (HF), using the program CartaLinx®. The study utilized the addresses of pharmacies, basic health units (BHU) and hospitals. The decision to work this way (without using GPS) was evaluated and accepted by the authors, in an effort to achieve the most accurate results possible and given that there are few differe nc e s generated by these met ho ds. The demarcation of districts was not performed ac- cording to an administrative definition, because the mu- nicipality does not have legislation that establishes the neighborhoods of the city. To achieve the required defi- nitions, scanning was performed according to the regions that had BHU and a map was constructed and defined by local businesses. Thus, some quarters were grouped toge- ther to form one district, totaling 12 neighb orhoods. Analyses of the spatial distribution of pharmacies in each district were also performed. Using the Idrisi Andes edition®, buffer zones of 350 meters were created, based on the Portuguese legislation [5] that guides the spatial distribution of pharmacies. Also analyzed were the number of HF in each neighborhood, including BHU, hospitals and emergency care centers. A 100-meter buf- fer zone was created for each pharmacy in order to assess the presence of HF within that range (again, based on the Portuguese legislation) [5]. Finally, we analyzed the number of pharmacies per inhabitant. This assessment was also based on the Portu- guese legislation [5], which requires a new pharmacy to have a minimum range of 3500 inhabitants. However, the lack of an official definition of neighborhoods in the city prevented the attainment of demographic data by admini- strative units, and left only the total number of inhabi- tants supplied by IBGE. Thus, we used the number of citizens served by the family health teams (ESF) and by community health workers for each demarcated unit of BHU (provided by the Health Department). This does not faithfully portray the reality of the city, since BHU do not have 100% coverage, but it was the most feasible and reliable representation that could be used in this study. Copyright © 2013 SciRes. PP 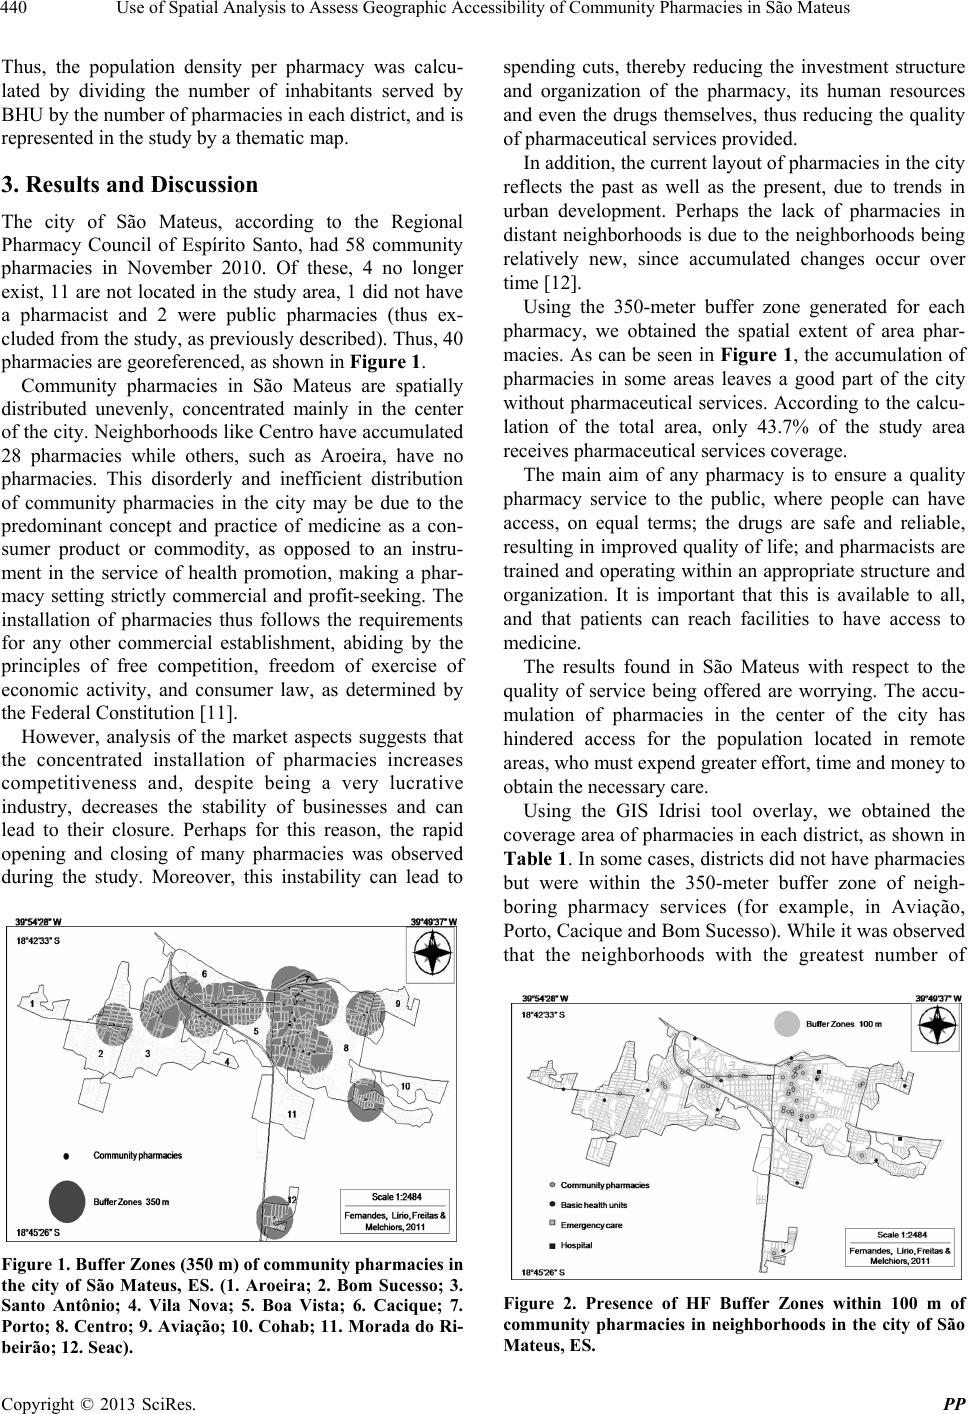 Use of Spatial Analysis to Assess Geographic Accessibility of Community Pharmacies in São Mateus 440 Thus, the population density per pharmacy was calcu- lated by dividing the number of inhabitants served by BHU by the number of pharmacies in each district, and is represented in the study by a thematic map. 3. Results and Discussion The city of São Mateus, according to the Regional Pharmacy Council of Espírito Santo, had 58 community pharmacies in November 2010. Of these, 4 no longer exist, 11 are not located in the study ar ea, 1 did not have a pharmacist and 2 were public pharmacies (thus ex- cluded from the study, as previously described). Thus, 40 pharmacies are georeferenced, as shown in Figure 1. Community pharmacies in São Mateus are spatially distributed unevenly, concentrated mainly in the center of the city. Neighborhoods like Centro have accumulated 28 pharmacies while others, such as Aroeira, have no pharmacies. This disorderly and inefficient distribution of community pharmacies in the city may be due to the predominant concept and practice of medicine as a con- sumer product or commodity, as opposed to an instru- ment in the service of health promotion, making a phar- macy setting strictly commercial and profit-seeking. The installation of pharmacies thus follows the requirements for any other commercial establishment, abiding by the principles of free competition, freedom of exercise of economic activity, and consumer law, as determined by the Federal Constitution [11]. However, analysis of the market aspects suggests that the concentrated installation of pharmacies increases competitiveness and, despite being a very lucrative industry, decreases the stability of businesses and can lead to their closure. Perhaps for this reason, the rapid opening and closing of many pharmacies was observed during the study. Moreover, this instability can lead to Figure 1. Buffer Zones (350 m) of community pharmacies in the city of São Mateus, ES. (1. Aroeira; 2. Bom Sucesso; 3. Santo Antônio; 4. Vila Nova; 5. Boa Vista; 6. Cacique; 7. Porto; 8. Centro; 9. Aviação; 10. Cohab; 11. Morada do Ri- beirão; 12. Seac). spending cuts, thereby reducing the investment structure and organization of the pharmacy, its human resources and even the drugs themselves, thus reducing the quality of pharmaceutical services provided. In addition, the current layout of pharmacies in th e city reflects the past as well as the present, due to trends in urban development. Perhaps the lack of pharmacies in distant neighborhoods is due to the neighborhoods being relatively new, since accumulated changes occur over time [12]. Using the 350-meter buffer zone generated for each pharmacy, we obtained the spatial extent of area phar- macies. As can be seen in Figure 1, the accumulation of pharmacies in some areas leaves a good part of the city without pharmaceutical services. According to the calcu- lation of the total area, only 43.7% of the study area receives pharmaceutical services coverage. The main aim of any pharmacy is to ensure a quality pharmacy service to the public, where people can have access, on equal terms; the drugs are safe and reliable, resulting in improved quality of life; and pharmacists are trained and operating within an appropriate structure and organization. It is important that this is available to all, and that patients can reach facilities to have access to medicine. The results found in São Mateus with respect to the quality of service being offered are worrying. The accu- mulation of pharmacies in the center of the city has hindered access for the population located in remote areas, who must expend greater effort, time and money to obtain the necessary care. Using the GIS Idrisi tool overlay, we obtained the coverage area of pharmacies in each district, as shown in Table 1. In some cases, districts did not have pharmacies but were within the 350-meter buffer zone of neigh- boring pharmacy services (for example, in Aviação, Porto, Cacique and Bom Sucesso). While it was observed that the neighborhoods with the greatest number of Figure 2. Presence of HF Buffer Zones within 100 m of community pharmacies in neighborhoods in the city of São ateus, ES. M Copyright © 2013 SciRes. PP  Use of Spatial Analysis to Assess Geographic Accessibility of Community Pharmacies in São Mateus Copyright © 2013 SciRes. PP 441 Table 1. Distribution of results according to geographic and demographic variables and neighborhood. Neighborhood Number of pharmacies Number of basic health units (BHU) Cover area (%) Number of intersections (350 m Buffer) Number of intersections (100 m Buffer) Populatio n Density Aroeira 0 1 0 0 0 0 Bom Sucesso 0 1 1806 0 0 0 Boa Vista* 5 2 7077 5 1 0 Cacique 0 1 5675 5 0 0 Porto 0 1 8147 10 0 0 Aviação 0 1 3158 2 0 0 Centro 28 3 6673 247 3 15,857 Cohab 1 2 2492 0 0 4635 Seac 1 1 7571 0 0 3704 Morada do Ribeirão 0 1 0 0 0 0 Vila Nova 2 1 3857 3 0 2284 Santo Antônio 4 1 3759 2 0 2486,25 *Neighborhood witho ut Family Health Teams (ESF) or was not availab le the number of inha b it ants. pharmacies had good coverage areas, the neighborhoods of Cacique and Porto also had good coverage of phar- maceutical services despite not having any pharmacies. As noted, most pharmacies are located very close to each other, even when located in different (but adjacent) neighborhoods. This created a high number of inter- sections between buffer zones, showing that the mini- mum distance of 350 meters there is in many districts of the municipality, as a Centro, Santo Antônio and Boa Vista, extending this reality to the surrounding neigh- borhoods, while not having pharmacies. Other neigh- borhoods, such as Bom Sucesso, Seac and Cohab, only have a few pharmacies but they are well distributed throughout the neighborhood. Regarding the presence of HF, it was observed that every neighborhood had a BHU (which was, after all, one of the criteria for defining the neighborhood para- meters). In addition to the BHU, we spatially analyzed the presence of hospitals and emergency care units, as illustrated in Figure 2. For example, we noted the presence of a hospital in th e neighborh oods of Coh ab and Centro, in addition to the emergency care unit located in the Boa Vista neigh borhood. After creating the 100-meter buffer zones, the pre- sence of HF located within the coverage area of phar- macies was observed, as shown in Figure 2. Most neigh- borhoods presented no HF in the coverage area; only those with high numbers of pharmacies, such as Centro and Boa Vista, did not possess the minimum distance of 100 meters suggested by the Portuguese legislation [5]. The distribution of pharmacies should be guided by the location of HF, in order to complement the health care services that are offered. However, the distance that users must travel to obtain health care should be weight- ed by the level of attention sought, since the distance to more specialized services will be longer than for those that require simpler levels of care [13]. Regarding the ratio of inhabitants to pharmacies, Figure 3 shows that the values were far from those re- commended by the Portuguese legislation [5]. As shown in Table 1 , three districts have pharmacies serving fewer than 3500 people. Of note is the Centro neighborhood, with about 158 inhabitants per pharmacy, an extremely low number. However, in more distant neighborhoods, the presence of only one pharmacy was sufficient under the Portuguese law, as seen in the neighborhoods of Co- hab and Seac. In countries with legislation that sets demograph ic and geographic criteria for the establishment of new phar- macies, the inhabitant-pharmacy ratios are very distant from the values found in th is study. Austria, for example, requires 5500 habitants per pharmacy. In France, the ratio is determined by the size of the commune, ranging from 2500 to 3500 inhabitants per pharmacy. In Italy, the ratio requires more than 5000 inhabitants fo r populations with fewer than 12,500 inhabitants, and 4000 for popu- lations with more than 12,500 inhabitants. The average number of inhabitants per pharmacy in Spain is 2099 [6]. Thus, the number of people covered by each pharmacy in São Mateus is extremely low, compared to other countries. However, the lack of demographic data that more accurately represents the reality of each neighbor- 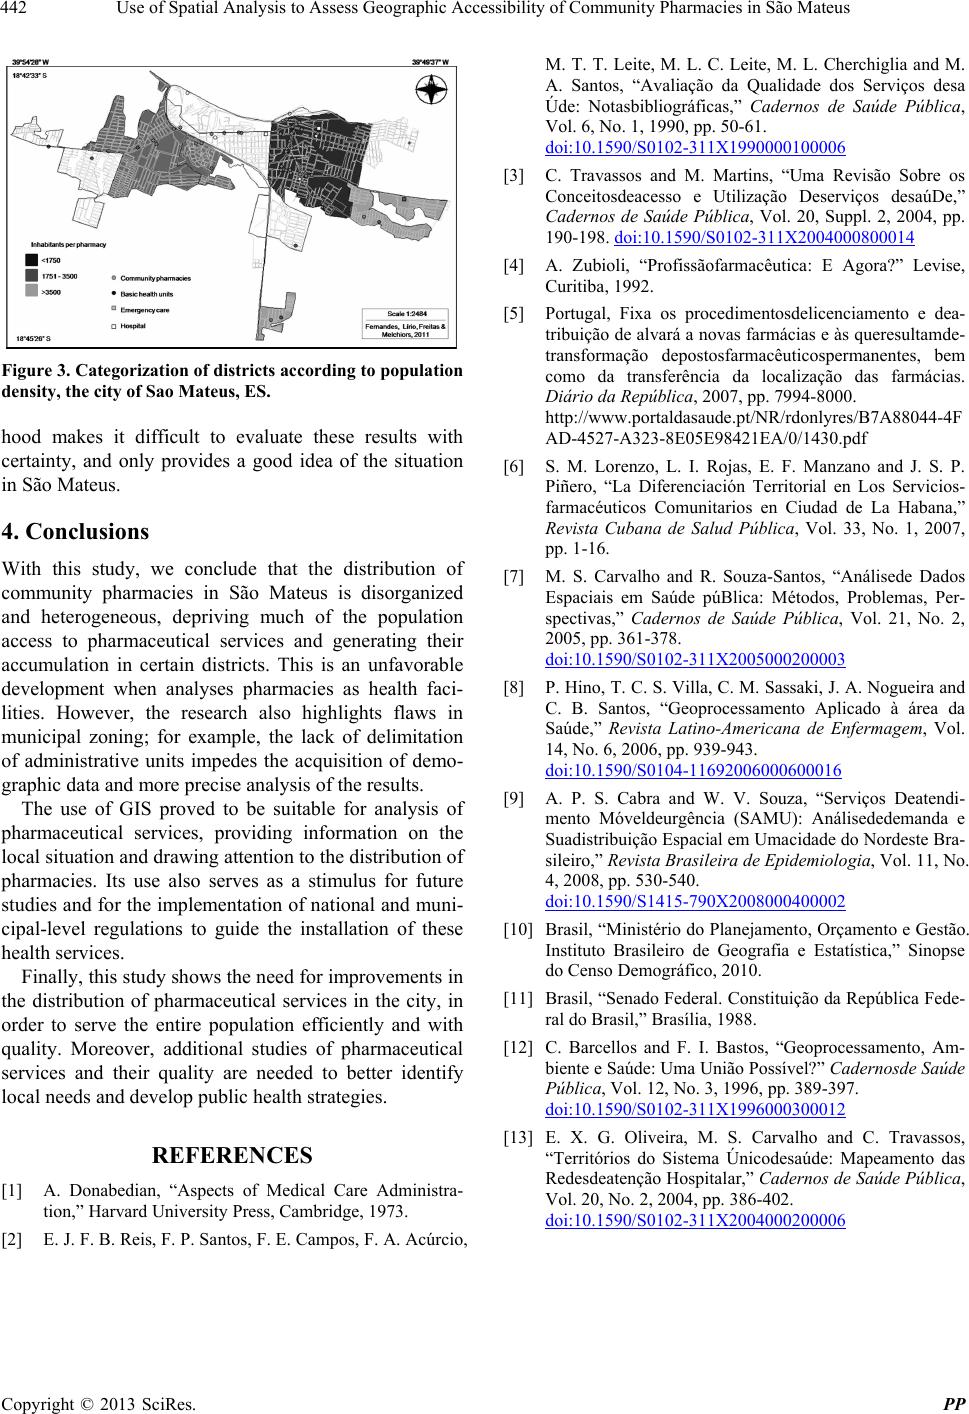 Use of Spatial Analysis to Assess Geographic Accessibility of Community Pharmacies in São Mateus 442 Figure 3. Categorization of districts according to population density, the city of Sao Mateus, ES. hood makes it difficult to evaluate these results with certainty, and only provides a good idea of the situation in São Mateus. 4. Conclusions With this study, we conclude that the distribution of community pharmacies in São Mateus is disorganized and heterogeneous, depriving much of the population access to pharmaceutical services and generating their accumulation in certain districts. This is an unfavorable development when analyses pharmacies as health faci- lities. However, the research also highlights flaws in municipal zoning; for example, the lack of delimitation of administrative units impedes the acquisition of demo- graphic data and more precise analysis of the results. The use of GIS proved to be suitable for analysis of pharmaceutical services, providing information on the local situation and drawing attention to the distribution of pharmacies. Its use also serves as a stimulus for future studies and for the implementation of national and muni- cipal-level regulations to guide the installation of these health services. Finally, this study shows the need for improvements in the distribution of pharmaceutical services in the city, in order to serve the entire population efficiently and with quality. Moreover, additional studies of pharmaceutical services and their quality are needed to better identify local needs and develop public health strategies. REFERENCES [1] A. Donabedian, “Aspects of Medical Care Administra- tion,” Harvard University Press, Cambridge, 1973. [2] E. J. F. B. Reis, F. P. Santos, F. E. Campos, F. A. Acúrcio, M. T. T. Leite, M. L. C. Leite, M. L. Cherchiglia and M. A. Santos, “Avaliação da Qualidade dos Serviços desa Úde: Notasbibliográficas,” Cadernos de Saúde Pública, Vol. 6, No. 1, 1990, pp. 50-61. doi:10.1590/S0102-311X1990000100006 [3] C. Travassos and M. Martins, “Uma Revisão Sobre os Conceitosdeacesso e Utilização Deserviços desaúDe,” Cadernos de Saúde Pública, Vol. 20, Suppl. 2, 2004, pp. 190-198. doi:10.1590/S0102-311X2004000800014 [4] A. Zubioli, “Profissãofarmacêutica: E Agora?” Levise, Curitiba, 1992. [5] Portugal, Fixa os procedimentosdelicenciamento e dea- tribuição de alvará a novas farmácias e às queresultamde- transformação depostosfarmacêuticospermanentes, bem como da transferência da localização das farmácias. Diário da República, 2007, pp. 7994-8000. http://www.portaldasaude.pt/NR/rdonlyres/B7A88044-4F AD-4527-A323-8E05E98421EA/0/1430.pdf [6] S. M. Lorenzo, L. I. Rojas, E. F. Manzano and J. S. P. Piñero, “La Diferenciación Territorial en Los Servicios- farmacéuticos Comunitarios en Ciudad de La Habana,” Revista Cubana de Salud Pública, Vol. 33, No. 1, 2007, pp. 1-16. [7] M. S. Carvalho and R. Souza-Santos, “Análisede Dados Espaciais em Saúde púBlica: Métodos, Problemas, Per- spectivas,” Cadernos de Saúde Pública, Vol. 21, No. 2, 2005, pp. 361-378. doi:10.1590/S0102-311X2005000200003 [8] P. Hino, T. C. S. Villa, C. M. Sassaki, J. A. Nogueira and C. B. Santos, “Geoprocessamento Aplicado à área da Saúde,” Revista Latino-Americana de Enfermagem, Vol. 14, No. 6, 2006, pp. 939-943. doi:10.1590/S0104-11692006000600016 [9] A. P. S. Cabra and W. V. Souza, “Serviços Deatendi- mento Móveldeurgência (SAMU): Análisededemanda e Suadistribuição Espacial em Umacidade do Nordeste Bra- sileiro,” Revista Brasileira de Epidemiologia, Vol. 11, No. 4, 2008, pp. 530-540. doi:10.1590/S1415-790X2008000400002 [10] Brasil, “Ministério do Planejamento, Orçamento e Gestão. Instituto Brasileiro de Geografia e Estatística,” Sinopse do Censo Demográfico, 2010. [11] Brasil, “Senado Federal. Constituição da República Fede- ral do Brasil,” Brasília, 1988. [12] C. Barcellos and F. I. Bastos, “Geoprocessamento, Am- biente e Saúde: Uma União Possível?” Cadernosde Saúde Pública, Vol. 12, No. 3, 1996, pp. 389-397. doi:10.1590/S0102-311X1996000300012 [13] E. X. G. Oliveira, M. S. Carvalho and C. Travassos, “Territórios do Sistema Únicodesaúde: Mapeamento das Redesdeatenção Hospitalar,” Cadernos de Saúde Pública, Vol. 20, No. 2, 2004, pp. 386-402. doi:10.1590/S0102-311X2004000200006 Copyright © 2013 SciRes. PP |