

Paper Menu >>
Journal Menu >>
 Vol.5, No.8A3, 23-28 (2013) Health http://dx.doi.org/10.4236/health.2013.58A3004 Diversity of eating patterns and obesity in older adults—A new challenge Patricia Moraes Ferreira1, Silvia Justina Papini2, José Eduardo Corrente3* 1PhD Student, Department of Public Health, School of Medicine, São Paulo, Brazil 2Nursing Department, School of Medicine, São Paulo, Brazil 3Biostatistics Department, Bioscience Institute, São Paulo, Brazil; *Corresponding Author: [email protected] Received 19 June 2013; revised 19 July 2013; accepted 29 July 2013 Copyright © 2013 Patricia Moraes Ferreira et al. This is an open access article distributed under the Creative Commons Attribution License, which permits unrestricted use, distribution, and reproduction in any medium, provided the original work is properly cited. ABSTRACT The increase in the variety of food choices in- fluences the eating patterns of older adults, which is in turn increases the occurrence of obesity. This study aimed at identifying eating patterns and their association with obesity in a represent ati ve sample of older adults living in an urban area and registered in the basic health unit in the city of Botucatu, São Paulo, Brazil. This is a cross-sectional study and data collec- tion took place from March to June of 2011 through the application of a validated food fre- quency questionnaire for older adults, a socio- demographic survey and an anthropo metric eva- luation. Eating patterns were identified through principal component analysis. Scores of indi- vidual consumption were divided in tertiles, characterizing as low, moderate or high adhe- rence of the individuals to each pattern. Logistic regression models were fitted for the outcomes “general obesity” and “abdominal obesity” and the tertiles of consumption adjusting by socio- demographic variables. Six eating patterns were identified: Healthy foods, Snacks and weekend meals, Fruits, Light and whole foods, Mild diet and Traditional diet. It was found that the ad- herence to healthy foods is protective against obesity as well as adherence of snacks and weekend meals are risk of obesity. Eating pat- terns and their recognized influence on obesity comprise an issue that deserves continuous attention in order to evaluate collectively the eating profile, and develop specific nutritional guidelines for older adults. Keywords: Eating Patterns; General Obesity; Older Adults 1. INTRODUCTION In Brazil, the most recent research regarding the nutri- tional state of the population showed that, between 1974 and 2009, the prevalence of older individuals of below average weight decreased, whereas the number of older individuals who are overweight or obese has increased steadily [1]. The rise in the number of obese older adults may be associated with changes in nutrition in this age group at a time when an increased consumption of foods with high energy density and a reduction in the ingestion of foods rich in fiber, and nutrients are becoming more prevalent in society [2]. The importance of eating behaviors as a risk factor for overweight and obesity is already well known [3,4]. The relationship between eating and nutritional status in the context of aging is frequently associated with nutritional problems [5] and boredom with eating [6,7], since physiological, economic and psychosocial factors may limit the consumption of food [7-9]. Nevertheless, it may be assumed that the older population, in addition to being vulnerable, is also a heterogeneous group in terms of many different aspects, including eating [9]. Due to the increase in the variety of food choices offered by the food industry and commerce, diversity in eating patterns is emerging in the same population group. In terms of epidemiology, the use of empirical analy- ses of derivative standards may reflect the true eating behaviors of a population and allow for improved plan- ning and effective proposals to promote healthy eating habits [10]. Therefore, from the hypothesis that the eat- ing habits of older adults are diversifying and exerting a strong influence on the increased prevalence of obesity, this study aimed at identifying eating patterns of the older Copyright © 2013 SciRes. OPEN A CCESS  P. M. Ferreira et al. / Health 5 (2013) 23-28 24 people and investigating their association with obesity. 2. METHODOLOGY 2.1. Study Population and Data Collection The present study was carried out in the city of Botu- catu, São Paulo, Brazil, which was chosen, in part, due to the development of a growing number of studies on population aging and to its high prevalence of older adults (13.35%) [11], higher than the mean in the state (11.6%) and in the country (10.8%) [12]. It is an epide- miological cross-sectional study, with a representative sample of individuals aged 60 years or older, living in the urban area and registered in the basic health unit of the municipality. A validated food frequency questionnaire (FFQ) with 71 food items was provided to the participants [13]. The sample size was calculated by considering five times the number of items present in the FFQ, according to the formula: if k > 15 ≥ n = 5 × k where k = number of items of the FFQ [14], yielding a total of 355 individuals, who were stratified among the sixteen basic health units in the municipality. For the association study between general obesity and the identified dietary patterns, we performed a posteriori sample size calculation. Data collection took place at households and at the ba- sic health units from March to June of 2011. Also it was applied a sociodemographic and lifestyle identification questionnaire and anthropometric evaluation was made. The weight it was measured using a calibrated portable digital electronic scale (TANITA® TM), portable stadi- ometer (ALTUREXATA®TM) for height. The waist cir- cumference measurement was performed using inelastic tape with 1 mm precision. Failing to perform the meas- urement of height (older adults stooped posture), these values were estimated from the measurement of the knee based on the validated techniques [15], and waist cir- cumference according to the techniques recommended by the World Health Organization [16]. 2.2. Ethical Approval The study was approved by the Committee of Ethics in Research of the Botucatu Medical School—São Paulo State University (UNESP). 2.3. Data Analysis Obesity was evaluated as either “general obesity” or “abdominal obesity”. In order to define general obesity, the authors used the Body Mass Index (BMI), with obe- sity defined as ≥30 kg/m2; for abdominal obesity, a waist Circumference (WC) ≥88 cm for women and ≥102 cm for men were used as the defining criteria. Both criteria are in agreement with recommendations from the World Health Organization [16]. Other variables analyzed were: consumption of alcoholic beverages, gender, education, marital status and physical activity. The criteria estab- lished by VIGITEL 2010 were used for the categoriza- tion of physical activity [17]. The information regarding food consumption obtained from the Food Frequency Questionnaire (FFQ) was ana- lyzed and interpreted for the identification of eating pat- terns, using the technique of exploratory factor analysis (principal component analysis—PCA). The applicability of the factor analysis was confirmed by the PCA method with varimax rotation, through Kaiser-Meyer-Olkin (KMO) and Bartlett’s tests of sphericity. Six factors were extracted considering only the items with a factor load greater than 0.3. Eating patterns were determined ac- cording to the nutritional and functional characteristics of the food items for each factor. Following the factor analysis, consumption scores were calculated in order to obtain participants’ adherence, which were divided into tertiles classified as low (1st tertile), moderate (2nd tertile) and high (3rd tertile) com- pliance. Logistic regression models were fitted consider- ing “general” and “abdominal” obesity as response vari- ables and adherence to the eating patterns (low, moderate and high) as explanatory variables adjusted for possible confounding effects. All analyses were performed using the SAS (Statistical Analysis System) program for Win- dows (v. 9.2). For all tests, a significance level of 5% (or the corresponding p-value) was considered. 3. RESULTS AND DISCUSSION The study sample consisted of 163 male (45.9%) and 192 female individuals (54.1%), which is close to the Brazil 2010 census results, in which 42.7% were men and 57.3% were women [18], indicating that this is a representative sample of the city’s population. Age varied between 60 and 92 years, with a mean of 69.54 years old (standard deviation = 7.73 years old); this population has a mean per capita family income of 1.76 minimum wages (approximately 500 US dollars). The prevalence of general obesity was 15.95% in men and 30.20% in women, while the prevalence of abdomi- nal obesity was much higher: 42.94% in men and 74.47% in women. The patterns identified through factor analysis were: 1) Healthy foods: raw endive/chicory; beetroot/chay- ote/zucchini; broccoli/cauliflower/cabbage; cooked en- dive/kale; carrots; extra virgin olive oil; tomatoes; lettuce; fish; oats. 2) Snacks and weekend meals: processed meat; moz- zarella/cheddar cheese; pizza/pancakes; baked snacks; bacon/jerky; hamburger/chicken nuggets/meatballs; fried snacks; regular butter; regular soda; bread rolls; pasta with meat; cooked potatoes with mayonnaise; desserts/ Copyright © 2013 SciRes. OPEN A CCESS 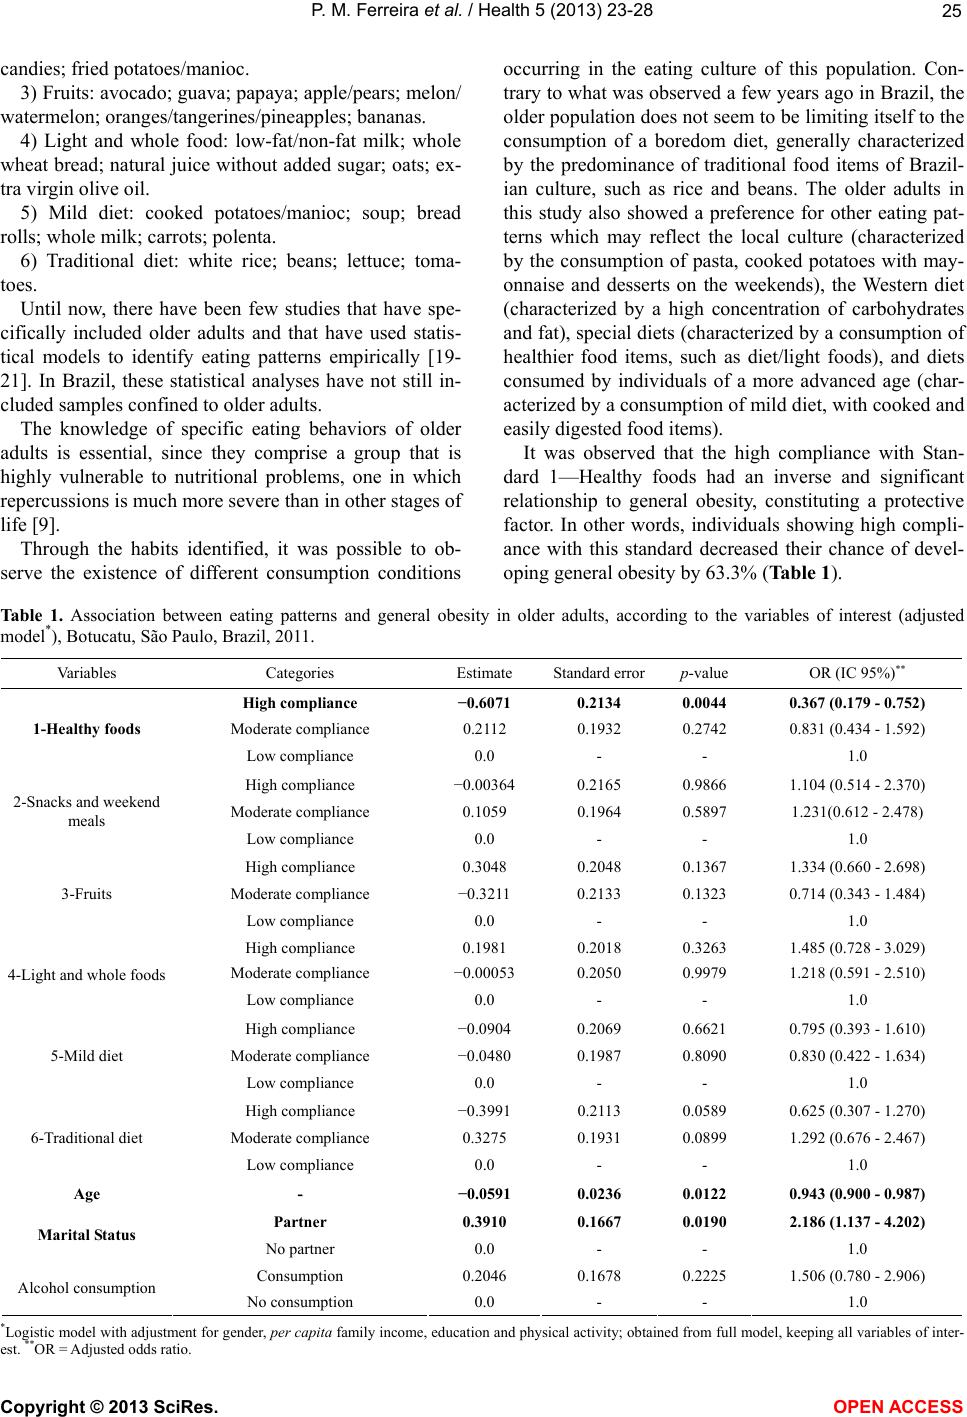 P. M. Ferreira et al. / Health 5 (2013) 23-28 Copyright © 2013 SciRes. OPEN A CCESS 25 candies; fried potatoes/manioc. 3) Fruits: avocado; guava; papaya; apple/pears; melon/ watermelon; oranges/tangerines/pineapples; bananas. 4) Light and whole food: low-fat/non-fat milk; whole wheat bread; natural juice without added sugar; oats; ex- tra virgin olive oil. 5) Mild diet: cooked potatoes/manioc; soup; bread rolls; whole milk; carrots; polenta. 6) Traditional diet: white rice; beans; lettuce; toma- toes. Until now, there have been few studies that have spe- cifically included older adults and that have used statis- tical models to identify eating patterns empirically [19- 21]. In Brazil, these statistical analyses have not still in- cluded samples confined to older adults. The knowledge of specific eating behaviors of older adults is essential, since they comprise a group that is highly vulnerable to nutritional problems, one in which repercussions is much more severe than in other stages of life [9]. Through the habits identified, it was possible to ob- serve the existence of different consumption conditions occurring in the eating culture of this population. Con- trary to what was observed a few years ago in Brazil, the older population does not seem to be limiting itself to the consumption of a boredom diet, generally characterized by the predominance of traditional food items of Brazil- ian culture, such as rice and beans. The older adults in this study also showed a preference for other eating pat- terns which may reflect the local culture (characterized by the consumption of pasta, cooked potatoes with may- onnaise and desserts on the weekends), the Western diet (characterized by a high concentration of carbohydrates and fat), special diets (characterized by a consumption of healthier food items, such as diet/light foods), and diets consumed by individuals of a more advanced age (char- acterized by a consumption of mild diet, with cooked and easily digested food items). It was observed that the high compliance with Stan- dard 1—Healthy foods had an inverse and significant relationship to general obesity, constituting a protective factor. In other words, individuals showing high compli- ance with this standard decreased their chance of devel- oping general obesity by 63.3% (Table 1). Table 1. Association between eating patterns and general obesity in older adults, according to the variables of interest (adjusted model*), Botucatu, São Paulo, Brazil, 2011. Variables Categories Estimate Standard errorp-value OR (IC 95%)** High compliance −0.6071 0.2134 0.0044 0.367 (0.179 - 0.752) Moderate compliance 0.2112 0.1932 0.2742 0.831 (0.434 - 1.592) 1-Healthy foods Low compliance 0.0 - - 1.0 High compliance −0.00364 0.2165 0.9866 1.104 (0.514 - 2.370) Moderate compliance 0.1059 0.1964 0.5897 1.231(0.612 - 2.478) 2-Snacks and weekend meals Low compliance 0.0 - - 1.0 High compliance 0.3048 0.2048 0.1367 1.334 (0.660 - 2.698) Moderate compliance −0.3211 0.2133 0.1323 0.714 (0.343 - 1.484) 3-Fruits Low compliance 0.0 - - 1.0 High compliance 0.1981 0.2018 0.3263 1.485 (0.728 - 3.029) Moderate compliance −0.00053 0.2050 0.9979 1.218 (0.591 - 2.510) 4-Light and whole foods Low compliance 0.0 - - 1.0 High compliance −0.0904 0.2069 0.6621 0.795 (0.393 - 1.610) Moderate compliance −0.0480 0.1987 0.8090 0.830 (0.422 - 1.634) 5-Mild diet Low compliance 0.0 - - 1.0 High compliance −0.3991 0.2113 0.0589 0.625 (0.307 - 1.270) Moderate compliance 0.3275 0.1931 0.0899 1.292 (0.676 - 2.467) 6-Traditional diet Low compliance 0.0 - - 1.0 Age - −0.0591 0.0236 0.0122 0.943 (0.900 - 0.987) Partner 0.3910 0.1667 0.0190 2.186 (1.137 - 4.202) Marital Status No partner 0.0 - - 1.0 Consumption 0.2046 0.1678 0.2225 1.506 (0.780 - 2.906) Alcohol consumption No consumption 0.0 - - 1.0 *Logistic model with adjustment for gender, per capita family income, education and physical activity; obtained from full model, keeping all variables of inter- st. **OR = Adjusted odds ratio. e  P. M. Ferreira et al. / Health 5 (2013) 23-28 26 Regarding abdominal obesity, it was observed that in- dividuals who comply moderately with Standard 1— Healthy foods decrease their risk of developing abdomi- nal obesity by 41.2%. On the other hand, moderate com- pliance with Standard 2—Snacks and weekend meals increased 2.21 times the chance of developing abdominal obesity (Table 2). These results agree with the recommendations, since Standard 1—Healthy foods has a high concentration of protective elements for weight gain, while Standard 2— Snacks and weekend meals has a high concentration of fat and simple carbohydrates which, if ingested exces- sively, can influence the development of obesity. Similar eating patterns and results have been found in other studies [22,23]. A standard termed “Healthy”, described by Americans in the Baltimore Longitudinal Study of Aging, was associated with lower gains in body mass index and waist circumference [22]. A standard termed “Meat and French Fries”, identified in Puerto Rican adults and older adults, was associated with higher meas- ures of waist circumference [23]. This similarity between studies shows the consistency of the empirical methods used to identify eating patterns. The other identified eating patterns did not show a significant association with obesity. Some limitations of this study, which are common to most studies regarding food consumption, must be con- sidered. The first one refers to the cross-sectional design, which does not allow for the establishment of a causal relationship between risk factors and health outcomes. However, since the purpose was to describe eating be- haviors in order to guide immediate actions of health promotion, the priority was not to determine whether the relationship between food consumption and negative health outcomes is indeed casual. The influence of reverse causality in studies of obesity is broadly recognized [24,25], since individuals may ei- ther overestimate or underestimate the consumption of certain food items. On the other hand, in this study the results of associations between eating patterns and obe- sity assumed the expected direction, and the control of covariates was performed, increasing the probability Table 2. Association between eating patterns and abdominal obesity in older adults, according to the variables of interest (adjusted model*), Botucatu, São Paulo, Brazil, 2011. Variables Categories Estimate Standard errorp-value OR (IC 95%)** High compliance 0.2062 0.1781 0.2469 1.045 (0.570 - 1.914) Moderate compliance −0.3686 0.1746 0.0348 0.588 (0.325 - 1.064) 1-Healthy foods Low compliance 0.0 - - 1.0 High compliance −0.0935 0.1824 0.6082 1.293 (0.677 - 2.469) Moderate compliance 0.4436 0.1808 0.0141 2.212 (1.164 - 4.203) 2-Snacks and weekend meals Low compliance 0.0 - - 1.0 High compliance 0.0981 0.1818 0.5895 1.455 (0.779 - 2.716) Moderate compliance 0.1788 0.1793 0.3187 1.577 (0.852 - 2.920) 3-Fruits Low compliance 0.0 - - 1.0 High compliance 0.1306 0.1818 0.4726 1.045 (0.562 - 1.943) Moderate compliance −0.2172 0.1838 0.2373 0.738 (0.394 - 1.382) 4-Light and whole foods Low compliance 0.0 - - 1.0 High compliance 0.1292 0.1805 0.4740 1.047 (0.565 - 1.939) Moderate compliance −0.2130 0.1761 0.2265 0.743 (0.407 - 1.357) 5-Mild diet Low compliance 0.0 - - 1.0 High compliance −0.2674 0.1755 0.1276 0.593 (0.325 - 1.081) Moderate compliance 0.0115 0.1763 0.9478 0.783 (0.428 - 1.433) 6-Traditional diet Low compliance 0.0 - - 1.0 Age - −0.0120 0.0190 0.5279 0.988 (0.952 - 1.026) Partner 0.1793 0.1447 0.2152 1.431 (0.812 - 2.524) Marital status No partner 0.0 - - 1.0 Consumption 0.1373 0.1464 0.3482 1.316 (0.741 - 2.336) Alcohol consumption No consumption 0.0 - - 1.0 *Logistic model with adjustment for gender, per capita family income, education and physical activity; obtained from full model, keeping all variables of inter- est. **OR = Adjusted odds ratio. Copyright © 2013 SciRes. OPEN A CCESS  P. M. Ferreira et al. / Health 5 (2013) 23-28 27 that the associations found are valid. In order to reduce the bias of memory, the assistance of caregivers was permitted to answer the questionnaires, and the questions from the Food Frequency Question- naire (FFQ) referred only to frequency of consumption, and did not include the portions consumed. Furthermore, the apparent effect of report errors in the FFQ is fre- quently discussed, since people are inclined to overesti- mate, for instance, their consumption of vegetables [25]. However, a study observed that eating patterns extracted from the FFQ are comparable to those obtained from the 24 h recall (the instrument which is considered to be the standard) [26]. Since the eating patterns are derived empirically, it is possible that other combinations of food items exist. Nevertheless, in the present study, the authors chose the best factor solution and verified the quality of interpreta- tion of the eating standards using statistical criteria, de- fining which factor solution was closer to the combina- tion of food items observed among the sample individu- als. 4. CONCLUSIONS The authors concluded that there was a diversity of eating patterns within a population of older adults, and this current eating behavior was found to be a factor in- dependently associated with obesity. The results obtained support the premise that the eat- ing standards and their recognized influence on obesity are issues that deserve continuing attention in order to evaluate collectively the eating profile of the older popu- lation and orientate efforts for the development of spe- cific nutritional guidelines for the older population. 5. ACKNOWLEDGEMENTS The authors would like to thank to São Paulo Foundation Research (FAPESP-Process no. 2010/12366-1) and National Counsel of Techno- logical and Scientific Development (CNPq Process no. 301197/2011-3) for the financial support. REFERENCES [1] Instituto Brasileiro de Geografia e Estatística—IBGE. (2011) Análise do consumo alimentar pessoal no Brasil. POF 2008/2009, Rio de Janeiro, 2011. [2] Popkin, B.M. (1994) The nutrition transition in low-in- come countries: An emerging crisis. Nutrition Reviews, 52, 285-298. doi:10.1111/j.1753-4887.1994.tb01460.x [3] Ma, Y., Bertone, E.R, Stanek, E.J., Reed, G.W, Hebert, J.R, Cohen, N.L., Merriam P.A. and Ockene I.S. (2003) Association between eating patterns and obesity in a free-living US adult population. American Journal of Epidemiology, 158, 85-92. doi:10.1093/aje/kwg117 [4] Mccrory, M.A., Suen, V.M. and Roberts, S.B. (2002) Bio- behavioral influences on energy intake and adult weight gain. Journal of Nutrition, 132, 3830-3834. [5] Ministério da Saúde. (2006) Obesidade: Determinantes do sobrepeso e obesidade. Brasília. [6] Freitas, A.M.P., Philippi, S.T. and Ribeiro, S.M.L. (2011) Listas de alimentos relacionadas ao consumo alimentar de um grupo de idosos: Análises e perspectivas. Revista Brasileira de Epidemiologia, 14, 161-177. doi:10.1590/S1415-790X2011000100015 [7] Campos, M.T.F.S., Monteiro, J.B.R. and Ornelas, A.P.R.C. (2000) Fatores que afetam o consumo alimentar e a nutrição do idoso. Revista de Nutrição, 13, 157-165. doi:10.1590/S1415-52732000000300002 [8] Gollub, E.A. and Weddle, D.O. (2004) Improvements in nutritional intake and quality of life among frail home- bound older adults receiving home-delivered breakfast and lunch. The Journal of the American Dental Asso- ciation, 104, 1227-1235. doi:10.1016/j.jada.2004.05.204 [9] Arbonés, G., Carbajal, A., Gonzalvo, B., Gonzales-Gróss, M., Joyanes, M., Marques-Lopes, I., Martín, M.L., Mar- tínez, A., Montero, P., Núñes, C., Puigdueta, I., Quer, J., Rivero, M., Roset, M.A., Sánchez-Muniz, F.J. and Vaque- ro, M.P. (2003) Nutrición y recomendaciones dietéticas para personas mayores. Grupo de trabajo “Salud pública” de La Sociedad Espanhola de Nutrición (SEN). Nutrición Hospitalaria, 18, 109-137. [10] Newby, P.K. and Tucker, K.L. (2004) Empirically derived eating patterns using factor or cluster analysis: A review. Nutrition Reviews, 62, 177-203. doi:10.1111/j.1753-4887.2004.tb00040.x [11] Departamento de Informática do SUS—DATASUS. (2011) Informações de Saúde. [12] Instituto Brasileiro de Geografia e Estatística—IBGE. (2011) Censo demográfico. [13] Corrente, J.E., Marchioni, D.M.L., Fisberg, R.M. (2013) Validation of a FFQ (Food Frequency Questionaire) for older people. Journal of Life Sicence, in press. [14] Hair, J.F., Anderson, R.E., Tatham, R.L. and Black, W.C. (2005) Análise multivariada de dados. Artmed, Porto Alegre. [15] Chumlea, W.C., Roche, A.F. and Steinbaugh, M.L. (1985) Estimating stature from knee height for persons 60 to 90 years of age. Journal of the American Geriatrics Society, 33, 116-120. [16] World Health Organization (WHO). (1998) Obesity: Pre- venting and managing the global epidemic, Geneva. [17] Ministério da Saúde. (2010) Vigilância de fatores de risco e proteção para doenças crônicas por inquérito telefônico (VIGITEL). Brasília. [18] Instituto Brasileiro de Geografia e Estatística—IBGE. (2011) Censo Demográfico 2010. Características da Po- pulação e dos Domicílios—Resultados do Universo. [19] Pala, V., Sieri, S., Masala, G., Palli, D., Panico, S., Vineis, P., Sacerdote, C., Mattiello, A., Galasso, R., Salvini, S., Ceroti, M., Berrino, F., Fusconi, E., Tumino, R., Frasca, G., Riboli, E., Trichopoulou, A., Baibas, N. and Krogh, V. (2006) Associations between dietary pattern and lifestyle, Copyright © 2013 SciRes. OPEN A CCESS  P. M. Ferreira et al. / Health 5 (2013) 23- 28 28 anthropometry and other health indicators in the elderly participants of the EPIC-Italy cohort. Nutrition, Meta- bolism and Cardiovascular Diseases, 16,186-201. doi:10.1016/j.numecd.2005.05.009 [20] Haveman-nies, A., Tucker, K.L., Groot, L.C.P.G.M., Wil- son, P.W.F. and Staveren, W.A. (2001) Evaluation of dietary quality in relationship to nutritional and lifestyle factors in elderly people of the US Framingham heart study and the European SENECA study. European Jour- nal of Clinical Nutrition, 55, 870-880. doi:10.1038/sj.ejcn.1601232 [21] Lin, H., Bermudez, O.I. and Tucker, K.L. (2003) Dietary patterns of hispanic elders are associated with accultu- ration and obesity. Journal of Nutrition, 133, 3651-3657. [22] Newby, P.K., Muller, D., Hallfrisch, J., Qiao, N., Andres, R. and Tucker, K.L. (2003) Dietary patterns and changes in body mass index and waist circumference in adults. The American Journal of Clinical Nutrition, 77, 1417- 1425. [23] Noel, S.E., Newby, P.K., Ordovas, J.M. and Tucker, K.L. (2009) A traditional rice and beans pattern is associated with metabolic syndrome in puerto rican older adults. Journal of Nutrition, 139, 1360-1367. doi:10.3945/jn.109.105874 [24] Scagliusi, F.B. and Lancha Junior, A.H. (2003) Subno- tificação da ingestão energética na avaliação do consumo alimentar. Revista de Nutrição, 16, 471-481. doi:10.1590/S1415-52732003000400010 [25] Togo, P., Osler, M., Sorensen, T.I.A. and Heitmann, B.L. (2001) Food intake patterns and body mass index in ob- servational studies. International Journal of Obesity, 25, 1741-1751. doi:10.1038/sj.ijo.0801819 [26] Hu, F.B., Rimm, E., Smith-Warner, S.A., Feskanich, D., Stampfer, M.J., Ascherio, A., Sampson, L. and Willett, W.C. (1999) Reproducibility and validity of dietary pat- terns assessed with a food-frequency questionnaire. The American Journal of Clinical Nutrition, 69, 243-249. Copyright © 2013 SciRes. OPEN A CCESS |