

Paper Menu >>
Journal Menu >>
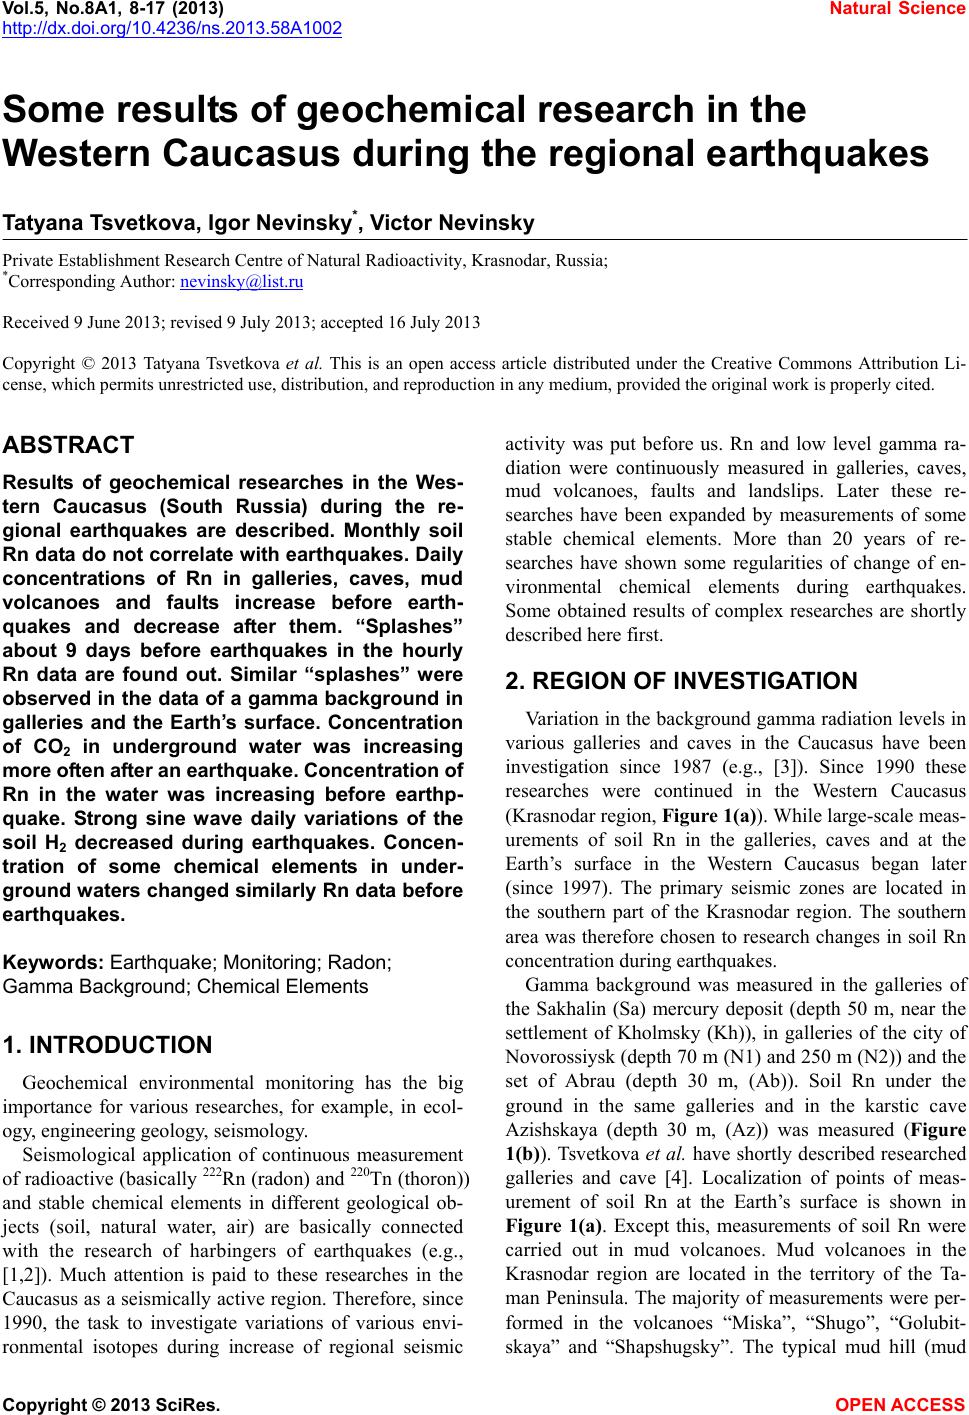 Vol.5, No.8A1, 8-17 (2013) Natural Science http://dx.doi.org/10.4236/ns.2013.58A1002 Some results of geochemical research in the Western Caucasus during the regional earthquakes Tatyana Tsvetkova, Igor Nevinsky*, Victor Nevinsky Private Establishment Research Centre of Natural Radioactivity, Krasnodar, Russia; *Corresponding Author: [email protected] Received 9 June 2013; revised 9 July 2013; accepted 16 July 2013 Copyright © 2013 Tatyana Tsvetkova et al. This is an open access article distributed under the Creative Commons Attribution Li- cense, which permits unrestricted use, distribution, and reproduction in any medium, provided the original work is properly cited. ABSTRACT Results of geochemical researches in the Wes- tern Caucasus (South Russia) during the re- gional earthquakes are described. Monthly soil Rn data do not correlate with earthquakes. Daily concentrations of Rn in galleries, caves, mud volcanoes and faults increase before earth- quakes and decrease after them. “Splashes” about 9 days before earthquakes in the hourly Rn data are found out. Similar “splashes” were observed in the data of a gamma background in galleries and the Earth’s surface. Concentration of CO2 in underground water was increasing more of ten a f ter an ear thquake. Conc entration of Rn in the water was increasing before earthp- quake. Strong sine wave daily variations of the soil H2 decreased during earthquakes. Concen- tration of some chemical elements in under- ground w aters changed similarly Rn data before earthquakes. Keyw ords: Earthquake; Monitoring; Radon; Gamma Background; Chemical Eleme nts 1. INTRODUCTION Geochemical environmental monitoring has the big importance for various researches, for example, in ecol- ogy, engineering geology, seismology. Seismological application of continuous measurement of radioactive (basically 222Rn (radon) and 220Tn (thoron)) and stable chemical elements in different geological ob- jects (soil, natural water, air) are basically connected with the research of harbingers of earthquakes (e.g., [1,2]). Much attention is paid to these researches in the Caucasus as a seismically active region. Therefore, since 1990, the task to investigate variations of various envi- ronmental isotopes during increase of regional seismic activity was put before us. Rn and low level gamma ra- diation were continuously measured in galleries, caves, mud volcanoes, faults and landslips. Later these re- searches have been expanded by measurements of some stable chemical elements. More than 20 years of re- searches have shown some regularities of change of en- vironmental chemical elements during earthquakes. Some obtained results of complex researches are shortly described here first. 2. REGION OF INVESTIGATION Variation in the background gamma radiation levels in various galleries and caves in the Caucasus have been investigation since 1987 (e.g., [3]). Since 1990 these researches were continued in the Western Caucasus (Krasnodar region, Figure 1(a)). While large-scale meas- urements of soil Rn in the galleries, caves and at the Earth’s surface in the Western Caucasus began later (since 1997). The primary seismic zones are located in the southern part of the Krasnodar region. The southern area was therefore chosen to research changes in soil Rn concentration during earthquakes. Gamma background was measured in the galleries of the Sakhalin (Sa) mercury deposit (depth 50 m, near the settlement of Kholmsky (Kh)), in galleries of the city of Novorossiysk (depth 70 m (N1) and 250 m (N2)) and the set of Abrau (depth 30 m, (Ab)). Soil Rn under the ground in the same galleries and in the karstic cave Azishskaya (depth 30 m, (Az)) was measured (Figure 1(b)). Tsvetkova et al. have shortly described researched galleries and cave [4]. Localization of points of meas- urement of soil Rn at the Earth’s surface is shown in Figure 1(a). Except this, measurements of soil Rn were carried out in mud volcanoes. Mud volcanoes in the Krasnodar region are located in the territory of the Ta- man Peninsula. The majority of measurements were per- formed in the volcanoes “Miska”, “Shugo”, “Golubit- skaya” and “Shapshugsky”. The typical mud hill (mud Copyright © 2013 SciRes. OPEN A CCESS 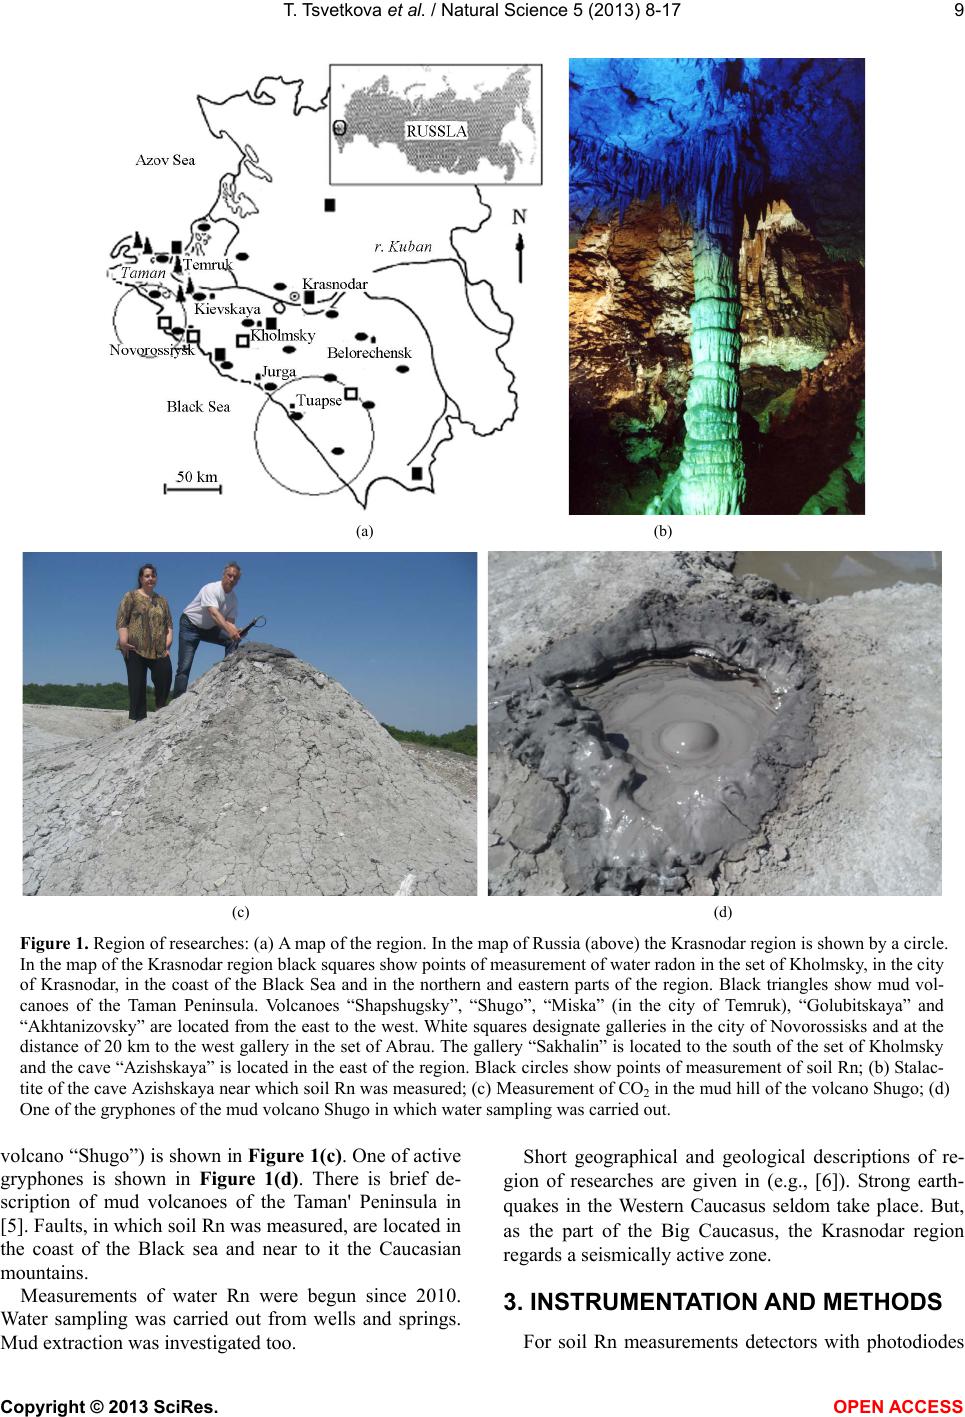 T. Tsvetkova et al. / Natural Science 5 (2013) 8-17 9 (a) (b) (c) (d) Figure 1. Region of researches: (a) A map of the region. In the map of Russia (above) the Krasnodar region is shown by a circle. In the map of the Krasnodar region black squares show points of measurement of water radon in the set of Kholmsky, in the city of Krasnodar, in the coast of the Black Sea and in the northern and eastern parts of the region. Black triangles show mud vol- canoes of the Taman Peninsula. Volcanoes “Shapshugsky”, “Shugo”, “Miska” (in the city of Temruk), “Golubitskaya” and “Akhtanizovsky” are located from the east to the west. White squares designate galleries in the city of Novorossisks and at the distance of 20 km to the west gallery in the set of Abrau. The gallery “Sakhalin” is located to the south of the set of Kholmsky and the cave “Azishskaya” is located in the east of the region. Black circles show points of measurement of soil Rn; (b) Stalac- tite of the cave Azishskaya near which soil Rn was measured; (c) Measurement of CO2 in the mud hill of the volcano Shugo; (d) One of the gryphones of the mud volcano Shugo in which water sampling was carried out. volcano “Shugo”) is shown in Figure 1(c). One of active gryphones is shown in Figure 1(d). There is brief de- scription of mud volcanoes of the Taman' Peninsula in [5]. Faults, in which soil Rn was measured, are located in the coast of the Black sea and near to it the Caucasian mountains. Measurements of water Rn were begun since 2010. Water sampling was carried out from wells and springs. Mud extraction was investigated too. Short geographical and geological descriptions of re- gion of researches are given in (e.g., [6]). Strong earth- quakes in the Western Caucasus seldom take place. But, as the part of the Big Caucasus, the Krasnodar region regards a seismically active zone. 3. INSTRUMENTATION AND METHODS For soil Rn measurements detectors with photodiodes Copyright © 2013 SciRes. OPEN A CCESS  T. Tsvetkova et al. / Natural Science 5 (2013) 8-17 10 (CLIPPERTON II) and ZnS scintillators were applied. The data were recorded in the “memory” of the device every hour (for photodiodes) or every 5 min (for ZnS scintillator). And Rn detectors were placed in dry cellars with stable temperatures. The influence of meteorologi- cal factors (change of air temperature, humidity, atmos- pheric precipitations and pressure) on Rn data when compared with seismic processes was there minimal. Water Rn was measured by degassing of samples and by scintillation measurement of the alpha activity of the allocated gas. The minimal activity of water 0.1 Bq/l was achieved at 30 min of degassing and 30 min of meas- urement of alpha activity. CO2 was simultaneously measured in the allocated gas. Infra-red detector PGA-7 (Russia) was used. 4 wells at the depth of 30, 180, 280 and 270 m were investigated in the set of Kholmsky. The depth of the wells in other settlements was 10 - 30 m. Water samples of 0.5l were selected from all the wells each day at 9-00 GMT. Only from the well at 30 m depth in the set of Kholmsky water samples were selected three times a day at 4-00, 9-00 and 15-00. Low level radiation was measured with low back- ground gamma spectrometer consists of scintillation crystal in the metal screen. In the galleries NaI (Tl) in the size 90 mm × 90 mm in dia. with the photomultiplier in dia. of 80 cm was applied. At the Earth’s surface in the set of Kholmsky big crystal CsI (Tl) 150 mm × 200 mm in dia. and the photomultiplier in dia. of 170 mm for the continuous monitoring of gamma background was ap- plied. From the photomultiplier pulses after amplification get in the 128-channel amplitude-digital converter. After processing the quantity of pulses in all 128 channels re- corded in the “memory” of the device each 5 minutes. The metal screen of the device was collected from pig-iron rings in external dia of 750 mm and internal dia. 570 mm. The height of the screen is 1600 mm. Outside pig-iron rings are closed by Pb sheets in the thickness of 5 sm. Inside of the pig-iron the crystals cover from an external background by layers of the “old” Pb (it is made till 1940, thickness of 50 mm) and W (30 mm). Tritium (T) was measured in water samples in the volume 0.5l. Electrolytic procedure was used. The device SL-4000 measured further beta activity of the rest. Con- centrations of some chemical elements were measured in water samples in the chemical laboratory by standard analytical devices. 4. RESULTS 4.1. Soil Rn in the Galleries and Cave Tsvetkova et al. have shown monthly, daily and hourly changes of soil Rn concentration in galleries and caves [4]. Changes in the monthly data exceeded the changes in regional seismicity for 3 - 4 months. This analysis was based on the seismic catalogue of the Central Experi- mental Expedition (CEE) of the Geophysical Service of the Russian Academy of Sciences (GS RAS)). The choice of earthquakes for the analysis was made by criteria [6,7]. Monthly Rn data in the gallery “Sa- chalin” are shown in [4]. Similar results were obtained in the galleries “Novorossiysk” (N1, N2) and “Abrau” (Ab). The monthly Rn data in the air of galleries varied in de- pendence on a season (Figure 2(a)). Factor of the corre- lation with regional earthquakes was 48% (N1); 23% (N2); 22% (Ab). Monthly Rn data in the air of galleries with intensive ventilation can not be used for seismol- ogical application. The daily concentration of soil Rn increased several days prior to the earthquakes. In Fig- ure 2(b), the daily underground Rn data as an example are shown. Regional earthquakes are shown in the same place. The concentration of Rn began to decrease before the earthquakes had occurred. This process occurred in the all galleries. Changes of Rn data were sometimes observed even without earthquakes only in “Novorossi- ysk 1”. It may be explained by strong meteorological influence on Rn data in this gallery. Gallery N1 has length of 50 m, big diameter (5 m) and an open entrance. Because of change of external atmospheric temperature very strong processes of hashing of air are observed in the gallery. Probably, it is another reason of strong changes of concentration of soil Rn. Some Rn “splashes” coincided with strong meteorological processes (e.g., hurricanes and tornados, as shown in Figure 2(b)—(last Rn “splash” in N1)). Connection between atmospheric pressure and daily underground Rn data is not found out [4]. Connection of changes in the cave of daily concen- trations of soil Rn with earthquakes is also not found out yet. The first Fourier harmonic was allocated in all the daily Rn data. Hourly “splash” for 9 1 days before re- gional earthquakes (up to 200 km of distance) were ob- served in all the galleries and cave. “Splashes” were ob- served above mistakes 2 a smooth daily curve (Figures 2(c), (d)). 4.2. Soil Rn at the Earth’s Surface Tsvetkova et al. have shown monthly, daily and hourly changes of soil Rn concentration in faults and mud vol- canoes in the Western Caucasus [7]. The factor of corre- lation of the monthly Rn activity in faults with the monthly number of earthquakes within a radius of 2000 km was equal to 40%. The earthquake quantity data (for research forecasting the seismicity) concerning the monthly Rn concentrations were retrospectively dis- placed at monthly intervals from 1 to 6 months. A sig- nificant correlation for any interval of displacement was not found. The factor of correlation of Rn data in mud volcanoes with the number of earthquakes father than Copyright © 2013 SciRes. OPEN A CCESS 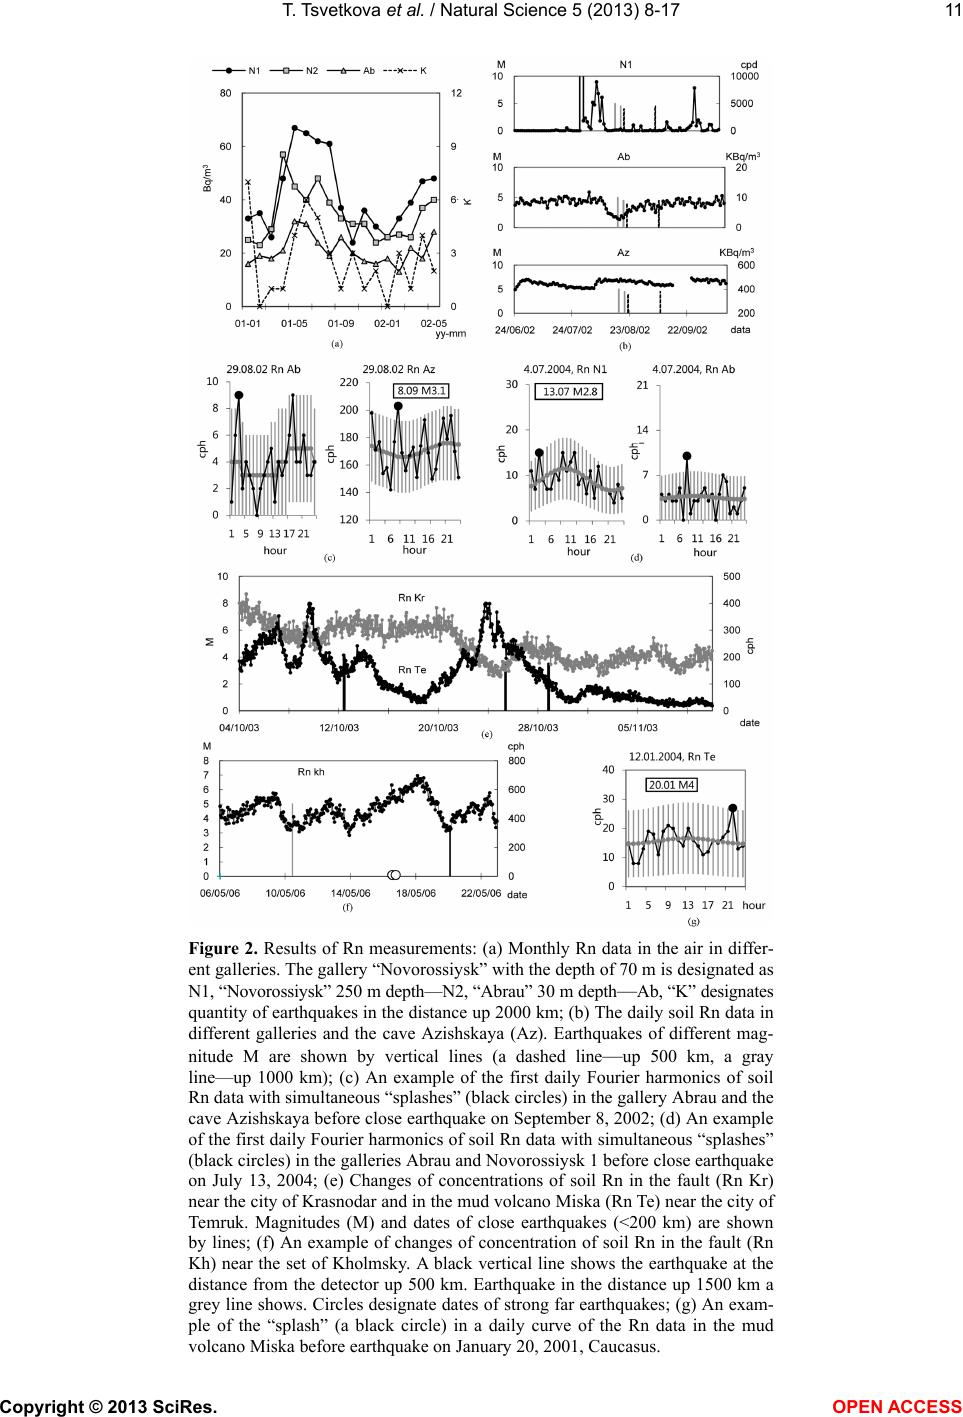 T. Tsvetkova et al. / Natural Science 5 (2013) 8-17 Copyright © 2013 SciRes. 11 Figure 2. Results of Rn measurements: (a) Monthly Rn data in the air in differ- ent galleries. The gallery “Novorossiysk” with the depth of 70 m is designated as N1, “Novorossiysk” 250 m depth—N2, “Abrau” 30 m depth—Ab, “K” designates quantity of earthquakes in the distance up 2000 km; (b) The daily soil Rn data in different galleries and the cave Azishskaya (Az). Earthquakes of different mag- nitude M are shown by vertical lines (a dashed line—up 500 km, a gray line—up 1000 km); (c) An example of the first daily Fourier harmonics of soil Rn data with simultaneous “splashes” (black circles) in the gallery Abrau and the cave Azishskaya before close earthquake on September 8, 2002; (d) An example of the first daily Fourier harmonics of soil Rn data with simultaneous “splashes” (black circles) in the galleries Abrau and Novorossiysk 1 before close earthquake on July 13, 2004; (e) Changes of concentrations of soil Rn in the fault (Rn Kr) near the city of Krasnodar and in the mud volcano Miska (Rn Te) near the city of Temruk. Magnitudes (M) and dates of close earthquakes (<200 km) are shown by lines; (f) An example of changes of concentration of soil Rn in the fault (Rn Kh) near the set of Kholmsky. A black vertical line shows the earthquake at the distance from the detector up 500 km. Earthquake in the distance up 1500 km a grey line shows. Circles designate dates of strong far earthquakes; (g) An exam- ple of the “splash” (a black circle) in a daily curve of the Rn data in the mud volcano Miska before earthquake on January 20, 2001, Caucasus. OPEN A CCESS 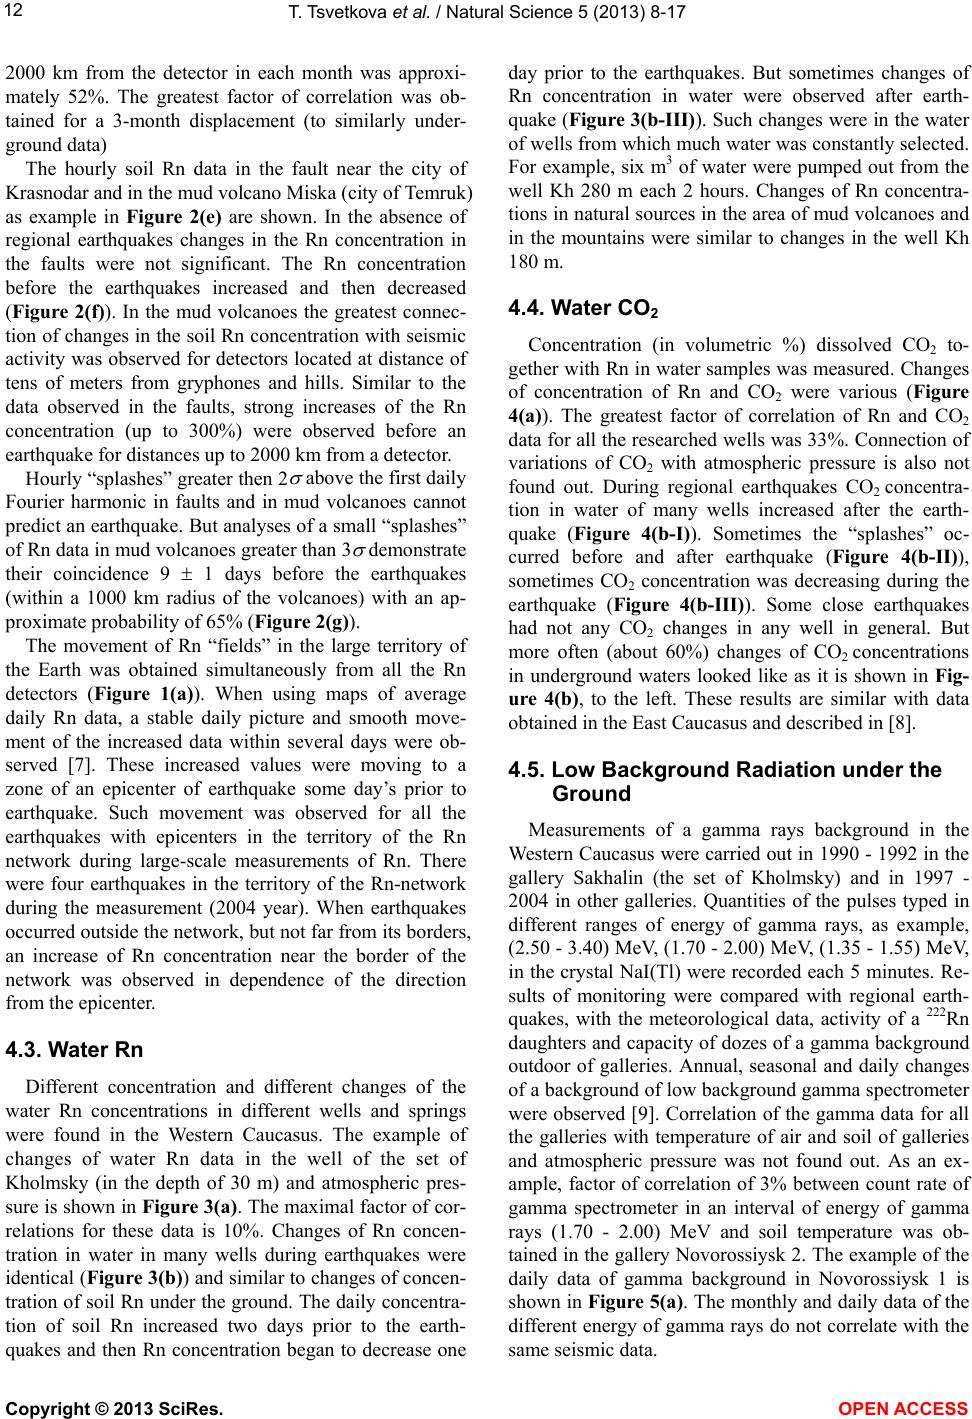 T. Tsvetkova et al. / Natural Science 5 (2013) 8-17 12 2000 km from the detector in each month was approxi- mately 52%. The greatest factor of correlation was ob- tained for a 3-month displacement (to similarly under- ground data) The hourly soil Rn data in the fault near the city of Krasnodar and in the mud volcano Miska (city of Temruk) as example in Figure 2(e) are shown. In the absence of regional earthquakes changes in the Rn concentration in the faults were not significant. The Rn concentration before the earthquakes increased and then decreased (Figure 2(f)). In the mud volcanoes the greatest connec- tion of changes in the soil Rn concentration with seismic activity was observed for detectors located at distance of tens of meters from gryphones and hills. Similar to the data observed in the faults, strong increases of the Rn concentration (up to 300%) were observed before an earthquake for distances up to 2000 km from a detector. Hourly “splashes” greater then 2 above the first daily Fourier harmonic in faults and in mud volcanoes cannot predict an earthquake. But analyses of a small “splashes” of Rn data in mud volcanoes greater than 3 demonstrate their coincidence 9 1 days before the earthquakes (within a 1000 km radius of the volcanoes) with an ap- proximate probability of 65% (Figure 2(g)). The movement of Rn “fields” in the large territory of the Earth was obtained simultaneously from all the Rn detectors (Figure 1(a)). When using maps of average daily Rn data, a stable daily picture and smooth move- ment of the increased data within several days were ob- served [7]. These increased values were moving to a zone of an epicenter of earthquake some day’s prior to earthquake. Such movement was observed for all the earthquakes with epicenters in the territory of the Rn network during large-scale measurements of Rn. There were four earthquakes in the territory of the Rn-network during the measurement (2004 year). When earthquakes occurred outside the network, but not far from its borders, an increase of Rn concentration near the border of the network was observed in dependence of the direction from the epicenter. 4.3. Water Rn Different concentration and different changes of the water Rn concentrations in different wells and springs were found in the Western Caucasus. The example of changes of water Rn data in the well of the set of Kholmsky (in the depth of 30 m) and atmospheric pres- sure is shown in Figure 3(a). The maximal factor of cor- relations for these data is 10%. Changes of Rn concen- tration in water in many wells during earthquakes were identical (Figure 3(b)) and similar to changes of concen- tration of soil Rn under the ground. The daily concentra- tion of soil Rn increased two days prior to the earth- quakes and then Rn concentration began to decrease one day prior to the earthquakes. But sometimes changes of Rn concentration in water were observed after earth- quake (Figure 3(b-III)). Such changes were in the water of wells from which much water was constantly selected. For example, six m3 of water were pumped out from the well Kh 280 m each 2 hours. Changes of Rn concentra- tions in natural sources in the area of mud volcanoes and in the mountains were similar to changes in the well Kh 180 m. 4.4. Water CO2 Concentration (in volumetric %) dissolved CO2 to- gether with Rn in water samples was measured. Changes of concentration of Rn and CO2 were various (Figur e 4(a)). The greatest factor of correlation of Rn and CO2 data for all the researched wells was 33%. Connection of variations of CO2 with atmospheric pressure is also not found out. During regional earthquakes CO2 concentra- tion in water of many wells increased after the earth- quake (Figure 4(b-I)). Sometimes the “splashes” oc- curred before and after earthquake (Figure 4(b-II)), sometimes CO2 concentration was decreasing during the earthquake (Figure 4(b-III)). Some close earthquakes had not any CO2 changes in any well in general. But more often (about 60%) changes of CO2 concentrations in underground waters looked like as it is shown in Fig- ure 4(b), to the left. These results are similar with data obtained in the East Caucasus and described in [8]. 4.5. Low Background Radiation under the Ground Measurements of a gamma rays background in the Western Caucasus were carried out in 1990 - 1992 in the gallery Sakhalin (the set of Kholmsky) and in 1997 - 2004 in other galleries. Quantities of the pulses typed in different ranges of energy of gamma rays, as example, (2.50 - 3.40) MeV, (1.70 - 2.00) MeV, (1.35 - 1.55) MeV, in the crystal NaI(Tl) were recorded each 5 minutes. Re- sults of monitoring were compared with regional earth- quakes, with the meteorological data, activity of a 222Rn daughters and capacity of dozes of a gamma background outdoor of galleries. Annual, seasonal and daily changes of a background of low background gamma spectrometer were observed [9]. Correlation of the gamma data for all the galleries with temperature of air and soil of galleries and atmospheric pressure was not found out. As an ex- ample, factor of correlation of 3% between count rate of gamma spectrometer in an interval of energy of gamma rays (1.70 - 2.00) MeV and soil temperature was ob- tained in the gallery Novorossiysk 2. The example of the daily data of gamma background in Novorossiysk 1 is shown in Figure 5(a). The monthly and daily data of the different energy of gamma rays do not correlate with the same seismic data. Copyright © 2013 SciRes. OPEN A CCESS 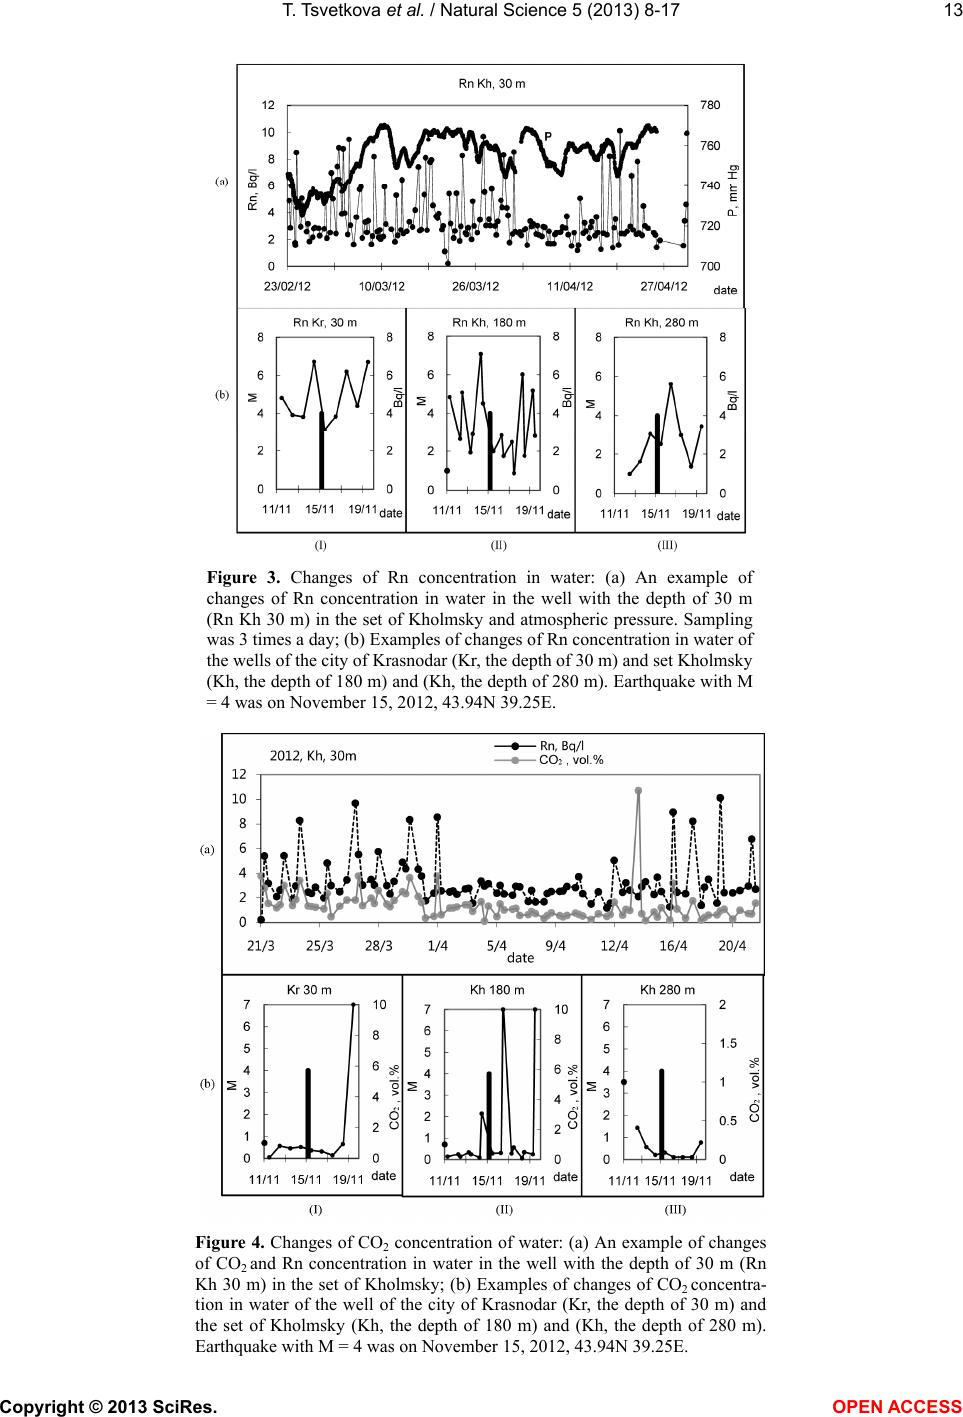 T. Tsvetkova et al. / Natural Science 5 (2013) 8-17 13 Figure 3. Changes of Rn concentration in water: (a) An example of changes of Rn concentration in water in the well with the depth of 30 m (Rn Kh 30 m) in the set of Kholmsky and atmospheric pressure. Sampling was 3 times a day; (b) Examples of changes of Rn concentration in water of the wells of the city of Krasnodar (Kr, the depth of 30 m) and set Kholmsky (Kh, the depth of 180 m) and (Kh, the depth of 280 m). Earthquake with M = 4 was on November 15, 2012, 43.94N 39.25E. Figure 4. Changes of CO2 concentration of water: (a) An example of changes of CO2 and Rn concentration in water in the well with the depth of 30 m (Rn Kh 30 m) in the set of Kholmsky; (b) Examples of changes of CO2 concentra- tion in water of the well of the city of Krasnodar (Kr, the depth of 30 m) and the set of Kholmsky (Kh, the depth of 180 m) and (Kh, the depth of 280 m). Earthquake with M = 4 was on November 15, 2012, 43.94N 39.25E. Copyright © 2013 SciRes. OPEN A CCESS 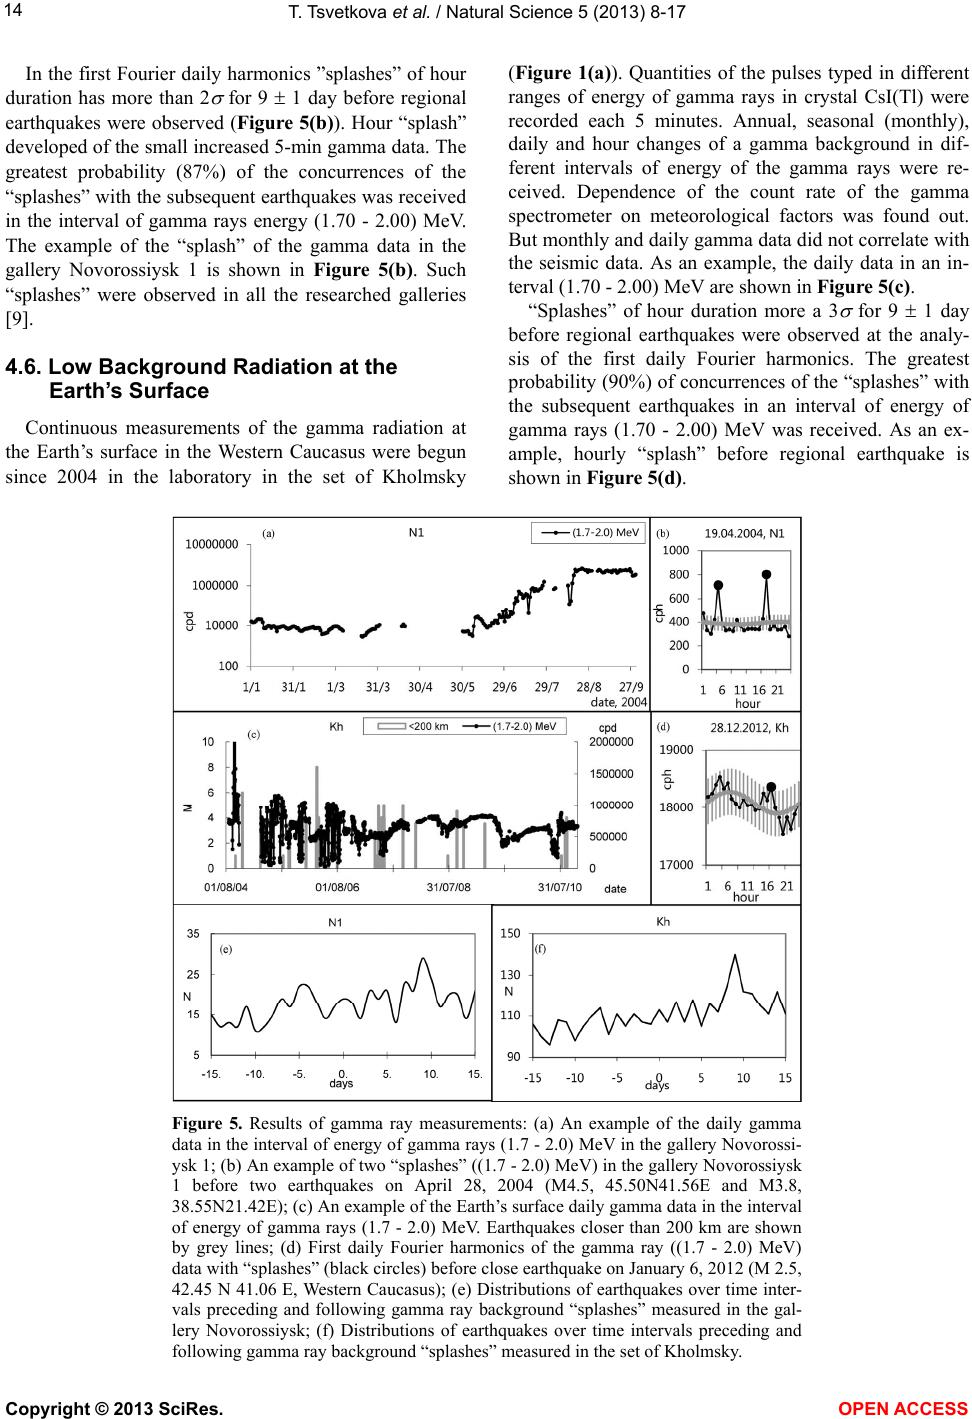 T. Tsvetkova et al. / Natural Science 5 (2013) 8-17 14 In the first Fourier daily harmonics ”splashes” of hour duration has more than 2 for 9 1 day before regional earthquakes were observed (Figure 5(b)). Hour “splash” developed of the small increased 5-min gamma data. The greatest probability (87%) of the concurrences of the “splashes” with the subsequent earthquakes was received in the interval of gamma rays energy (1.70 - 2.00) MeV. The example of the “splash” of the gamma data in the gallery Novorossiysk 1 is shown in Figure 5(b). Such “splashes” were observed in all the researched galleries [9]. 4.6. Low Background Radiation at the Earth’s Surface Continuous measurements of the gamma radiation at the Earth’s surface in the Western Caucasus were begun since 2004 in the laboratory in the set of Kholmsky (Figure 1(a)). Quantities of the pulses typed in different ranges of energy of gamma rays in crystal CsI(Tl) were recorded each 5 minutes. Annual, seasonal (monthly), daily and hour changes of a gamma background in dif- ferent intervals of energy of the gamma rays were re- ceived. Dependence of the count rate of the gamma spectrometer on meteorological factors was found out. But monthly and daily gamma data did not correlate with the seismic data. As an example, the daily data in an in- terval (1.70 - 2.00) MeV are shown in Figure 5(c). “Splashes” of hour duration more a 3 for 9 1 day before regional earthquakes were observed at the analy- sis of the first daily Fourier harmonics. The greatest probability (90%) of concurrences of the “splashes” with the subsequent earthquakes in an interval of energy of gamma rays (1.70 - 2.00) MeV was received. As an ex- ample, hourly “splash” before regional earthquake is shown in Figure 5(d). Figure 5. Results of gamma ray measurements: (a) An example of the daily gamma data in the interval of energy of gamma rays (1.7 - 2.0) MeV in the gallery Novorossi- ysk 1; (b) An example of two “splashes” ((1.7 - 2.0) MeV) in the gallery Novorossiysk 1 before two earthquakes on April 28, 2004 (M4.5, 45.50N41.56E and M3.8, 38.55N21.42E); (c) An example of the Earth’s surface daily gamma data in the interval of energy of gamma rays (1.7 - 2.0) MeV. Earthquakes closer than 200 km are shown by grey lines; (d) First daily Fourier harmonics of the gamma ray ((1.7 - 2.0) MeV) data with “splashes” (black circles) before close earthquake on January 6, 2012 (M 2.5, 42.45 N 41.06 E, Western Caucasus); (e) Distributions of earthquakes over time inter- vals preceding and following gamma ray background “splashes” measured in the gal- lery Novorossiysk; (f) Distributions of earthquakes over time intervals preceding and following gamma ray background “splashes” measured in the set of Kholmsky. Copyright © 2013 SciRes. OPEN A CCESS 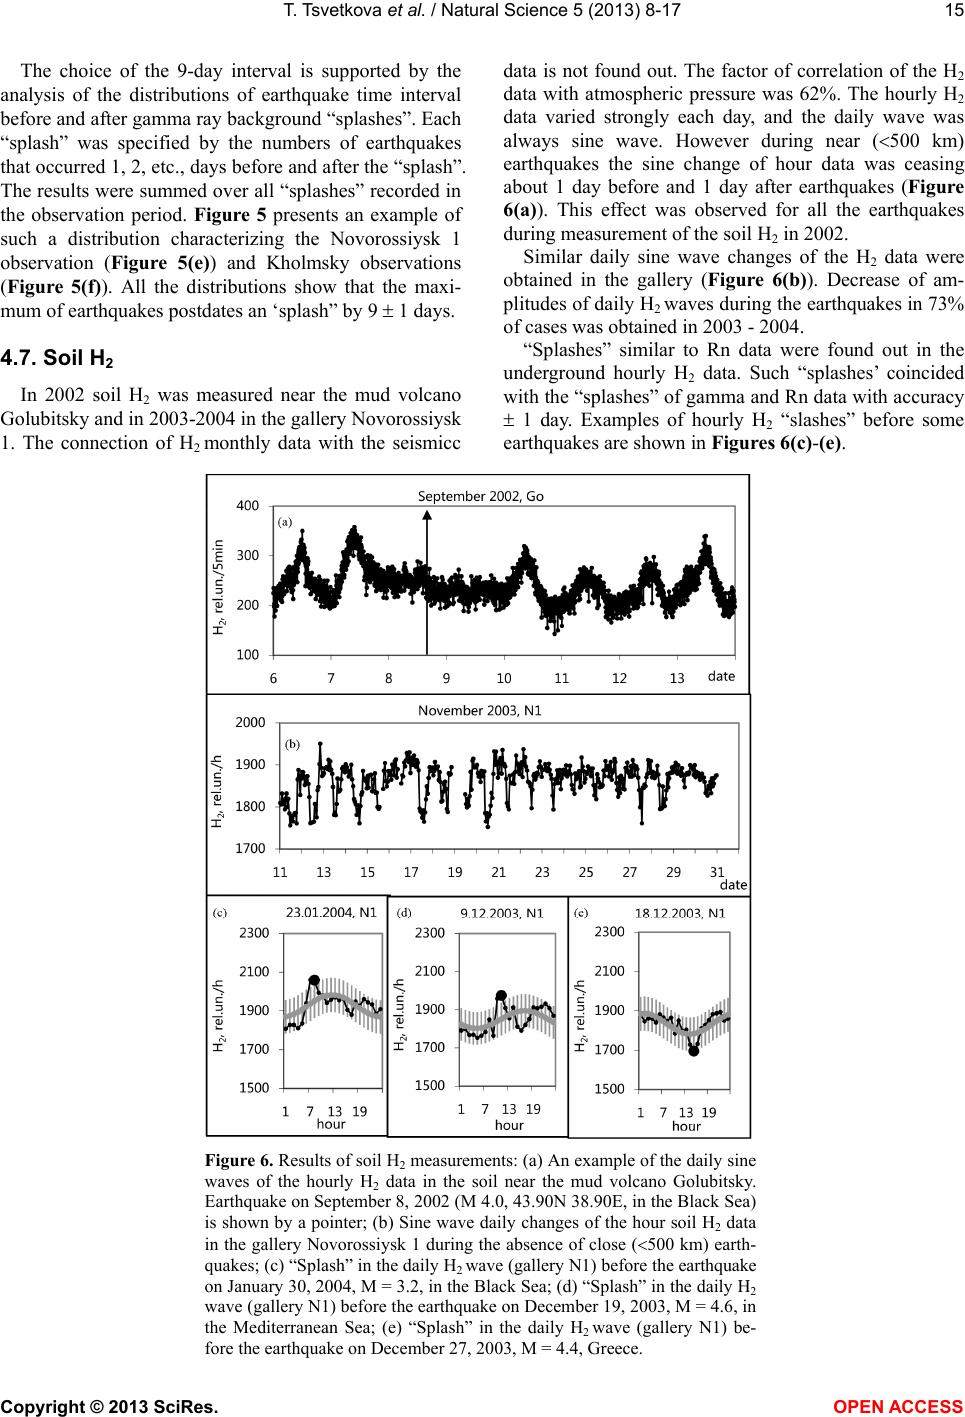 T. Tsvetkova et al. / Natural Science 5 (2013) 8-17 15 The choice of the 9-day interval is supported by the analysis of the distributions of earthquake time interval before and after gamma ray background “splashes”. Each “splash” was specified by the numbers of earthquakes that occurred 1, 2, etc., days before and after the “splash”. The results were summed over all “splashes” recorded in the observation period. Figure 5 presents an example of such a distribution characterizing the Novorossiysk 1 observation (Figure 5(e)) and Kholmsky observations (Figure 5(f)). All the distributions show that the maxi- mum of earthquakes postdates an ‘splash” by 9 1 days. 4.7. Soil H2 In 2002 soil H2 was measured near the mud volcano Golubitsky and in 2003-2004 in the gallery Novorossiysk 1. The connection of H2 monthly data with the seismicс data is not found out. The factor of correlation of the H2 data with atmospheric pressure was 62%. The hourly H2 data varied strongly each day, and the daily wave was always sine wave. However during near (500 km) earthquakes the sine change of hour data was ceasing about 1 day before and 1 day after earthquakes (Figure 6(a)). This effect was observed for all the earthquakes during measurement of the soil H2 in 2002. Similar daily sine wave changes of the H2 data were obtained in the gallery (Figure 6(b)). Decrease of am- plitudes of daily H2 waves during the earthquakes in 73% of cases was obtained in 2003 - 2004. “Splashes” similar to Rn data were found out in the underground hourly H2 data. Such “splashes’ coincided with the “splashes” of gamma and Rn data with accuracy 1 day. Examples of hourly H2 “slashes” before some earthquakes are shown in Fi gu res 6(c)-(e). Figure 6. Results of soil H2 measurements: (a) An example of the daily sine waves of the hourly H2 data in the soil near the mud volcano Golubitsky. Earthquake on September 8, 2002 (M 4.0, 43.90N 38.90E, in the Black Sea) is shown by a pointer; (b) Sine wave daily changes of the hour soil H2 data in the gallery Novorossiysk 1 during the absence of close (500 km) earth- quakes; (c) “Splash” in the daily H2 wave (gallery N1) before the earthquake on January 30, 2004, М = 3.2, in the Black Sea; (d) “Splash” in the daily H2 wave (gallery N1) before the earthquake on December 19, 2003, М = 4.6, in the Mediterranean Sea; (e) “Splash” in the daily H2 wave (gallery N1) be- fore the earthquake on December 27, 2003, М = 4.4, Greece. Copyright © 2013 SciRes. OPEN A CCESS 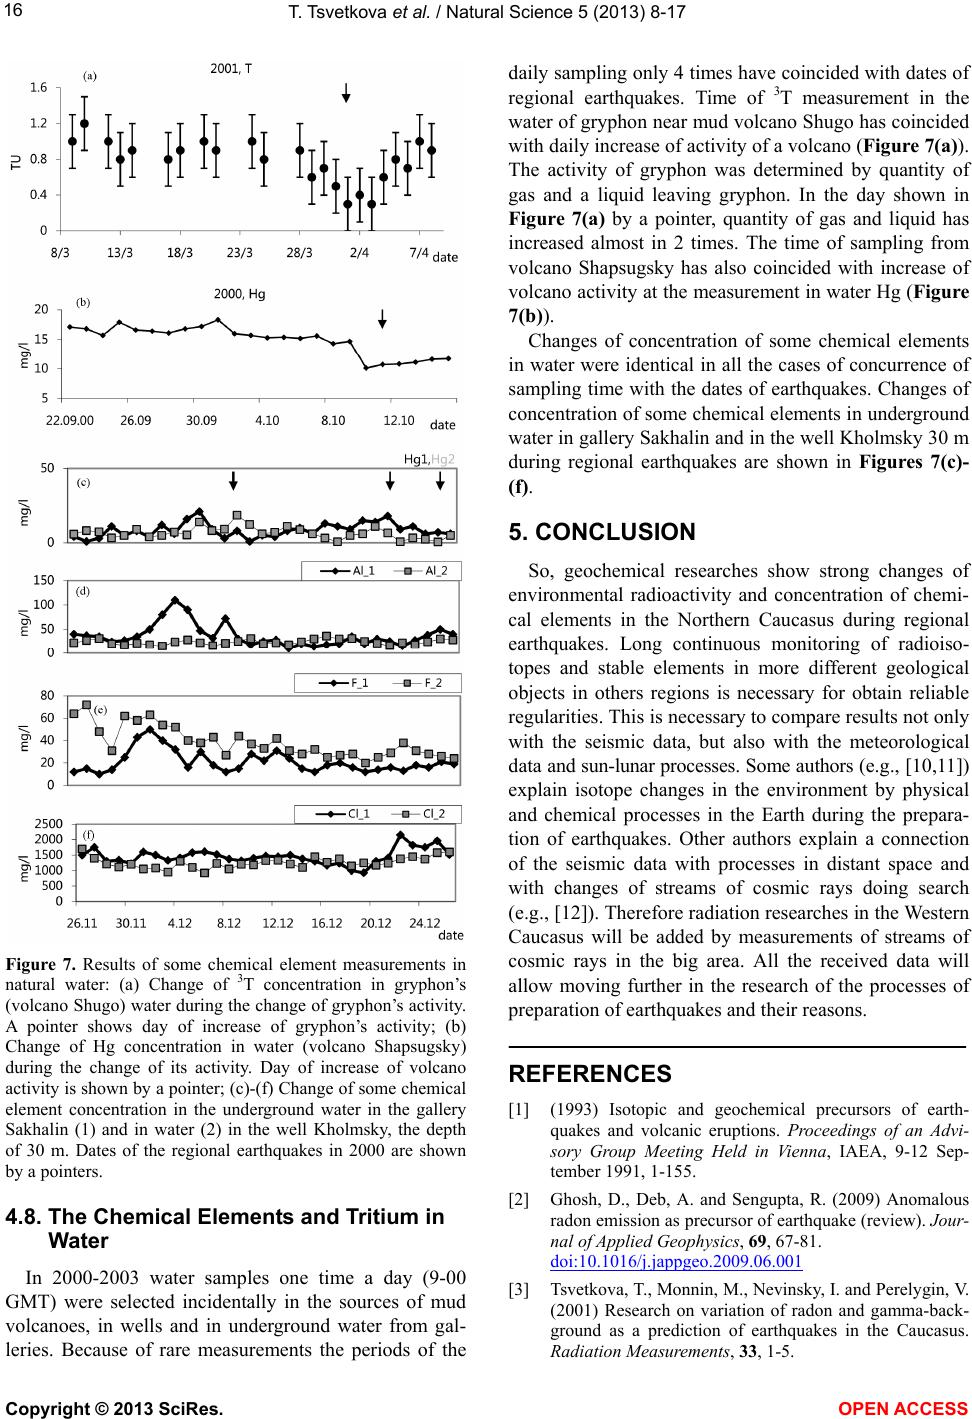 T. Tsvetkova et al. / Natural Science 5 (2013) 8-17 16 Figure 7. Results of some chemical element measurements in natural water: (a) Change of 3T concentration in gryphon’s (volcano Shugo) water during the change of gryphon’s activity. A pointer shows day of increase of gryphon’s activity; (b) Change of Hg concentration in water (volcano Shapsugsky) during the change of its activity. Day of increase of volcano activity is shown by a pointer; (c)-(f) Change of some chemical element concentration in the underground water in the gallery Sakhalin (1) and in water (2) in the well Kholmsky, the depth of 30 m. Dates of the regional earthquakes in 2000 are shown by a pointers. 4.8. The Chemical Elements and Tritium in Water In 2000-2003 water samples one time a day (9-00 GMT) were selected incidentally in the sources of mud volcanoes, in wells and in underground water from gal- leries. Because of rare measurements the periods of the daily sampling only 4 times have coincided with dates of regional earthquakes. Time of 3T measurement in the water of gryphon near mud volcano Shugo has coincided with daily increase of activity of a volcano (Figure 7(a)). The activity of gryphon was determined by quantity of gas and a liquid leaving gryphon. In the day shown in Figure 7(a) by a pointer, quantity of gas and liquid has increased almost in 2 times. The time of sampling from volcano Shapsugsky has also coincided with increase of volcano activity at the measurement in water Hg (Figure 7(b)). Changes of concentration of some chemical elements in water were identical in all the cases of concurrence of sampling time with the dates of earthquakes. Changes of concentration of some chemical elements in underground water in gallery Sakhalin and in the well Kholmsky 30 m during regional earthquakes are shown in Figures 7(c)- (f). 5. CONCLUSION So, geochemical researches show strong changes of environmental radioactivity and concentration of chemi- cal elements in the Northern Caucasus during regional earthquakes. Long continuous monitoring of radioiso- topes and stable elements in more different geological objects in others regions is necessary for obtain reliable regularities. This is necessary to compare results not only with the seismic data, but also with the meteorological data and sun-lunar processes. Some authors (e.g., [10,11]) explain isotope changes in the environment by physical and chemical processes in the Earth during the prepara- tion of earthquakes. Other authors explain a connection of the seismic data with processes in distant space and with changes of streams of cosmic rays doing search (e.g., [12]). Therefore radiation researches in the Western Caucasus will be added by measurements of streams of cosmic rays in the big area. All the received data will allow moving further in the research of the processes of preparation of earthquakes and their reasons. REFERENCES [1] (1993) Isotopic and geochemical precursors of earth- quakes and volcanic eruptions. Proceedings of an Advi- sory Group Meeting Held in Vienna, IAEA, 9-12 Sep- tember 1991, 1-155. [2] Ghosh, D., Deb, A. and Sengupta, R. (2009) Anomalous radon emission as precursor of earthquake (review). Jour- nal of Applied Geophysics, 69, 67-81. doi:10.1016/j.jappgeo.2009.06.001 [3] Tsvetkova, T., Monnin, M., Nevinsky, I. and Perelygin, V. (2001) Research on variation of radon and gamma-back- ground as a prediction of earthquakes in the Caucasus. Radiation Measurements, 33, 1-5. Copyright © 2013 SciRes. OPEN A CCESS 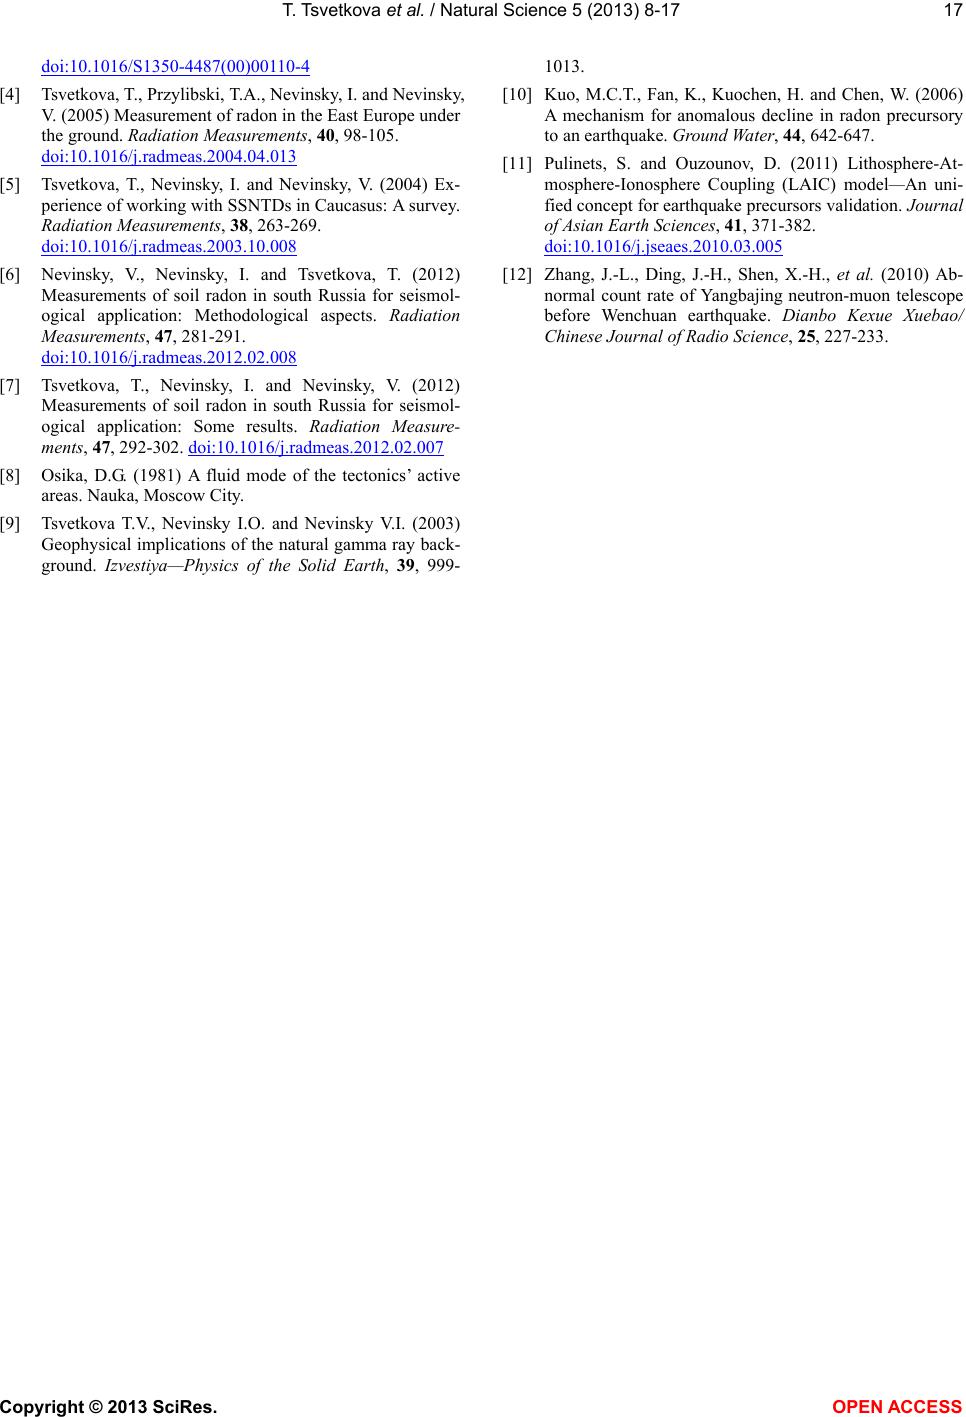 T. Tsvetkova et al. / Natural Science 5 (2013) 8-17 17 doi:10.1016/S1350-4487(00)00110-4 [4] Tsvetkova, T., Przylibski, T.A., Nevinsky, I. and Nevinsky, V. (2005) Measurement of radon in the East Europe under the ground. Radiation Measurements, 40, 98-105. doi:10.1016/j.radmeas.2004.04.013 [5] Tsvetkova, T., Nevinsky, I. and Nevinsky, V. (2004) Ex- perience of working with SSNTDs in Caucasus: A survey. Radiation Measurements, 38, 263-269. doi:10.1016/j.radmeas.2003.10.008 [6] Nevinsky, V., Nevinsky, I. and Tsvetkova, T. (2012) Measurements of soil radon in south Russia for seismol- ogical application: Methodological aspects. Radiation Measurements, 47, 281-291. doi:10.1016/j.radmeas.2012.02.008 [7] Tsvetkova, T., Nevinsky, I. and Nevinsky, V. (2012) Measurements of soil radon in south Russia for seismol- ogical application: Some results. Radiation Measure- ments, 47, 292-302. doi:10.1016/j.radmeas.2012.02.007 [8] Osika, D.G. (1981) A fluid mode of the tectonics’ active areas. Nauka, Moscow City. [9] Tsvetkova T.V., Nevinsky I.O. and Nevinsky V.I. (2003) Geophysical implications of the natural gamma ray back- ground. Izvestiya—Physics of the Solid Earth, 39, 999- 1013. [10] Kuo, M.C.T., Fan, K., Kuochen, H. and Chen, W. (2006) A mechanism for anomalous decline in radon precursory to an earthquake. Ground Water, 44, 642-647. [11] Pulinets, S. and Ouzounov, D. (2011) Lithosphere-At- mosphere-Ionosphere Coupling (LAIC) model—An uni- fied concept for earthquake precursors validation. Journal of Asian Earth Sciences, 41, 371-382. doi:10.1016/j.jseaes.2010.03.005 [12] Zhang, J.-L., Ding, J.-H., Shen, X.-H., et al. (2010) Ab- normal count rate of Yangbajing neutron-muon telescope before Wenchuan earthquake. Dianbo Kexue Xuebao/ Chinese Journal of Radio Science, 25, 227-233. Copyright © 2013 SciRes. OPEN A CCESS |