

Paper Menu >>
Journal Menu >>
 Journal of Environmental Protection, 2013, 4, 99-105 http://dx.doi.org/10.4236/jep.2013.48A1012 Published Online August 2013 (http://www.scirp.org/journal/jep) 99 Real-Time Air Monitoring of Trichloroethylene and Tetrachloroethylene Using Mobile TAGA Mass Spectrometry Nicholas S. Karellas*, Qingfeng Chen Air Quality Monitoring Unit, Air Monitoring and Transboundary Air Sciences Section, Environmental Monitoring and Reporting Branch, Ontario Ministry of the Environment, Toronto, Canada. Email: *[email protected] Received May 18th, 2013; revised June 27th, 2013; accepted July 30th, 2013 Copyright © 2013 Nicholas S. Karellas, Qingfeng Chen. This is an open access article distributed under the Creative Commons At- tribution License, which permits unrestricted use, distribution, and reproduction in any medium, provided the original work is prop- erly cited. ABSTRACT Trichloroethylene (TCE) is a chlorinated liquid that is commonly used for metal degreasing, household and industrial dry cleaning, and in paints and glues. Tetrachloroethylene, also known as perchloroethylene (PCE), is an excellent sol- vent for organic materials. PCE is volatile, highly stable, non-flammable and widely used in dry cleaning. A new method has been developed for measuring TCE and PCE in ambient air in real-time. Based upon the chemical finger- printing and concentration levels, the method was able to isolate the source of the emissions to the responsible facility. Real-time monitoring was accomplished by utilizing a low pressure chemical ionization source (LPCI) interfaced to a tandem mass spectrometer (TAGA). Monitoring the response of specific parent/daughter ion pairs, the TAGA was used to measure concentrations of TCE and PCE. By optimizing various TAGA parameters, detection limits (DL) as low as 0.5 μg/m3 was achieved for TCE and PCE. Unlike methods using cartridge sampling and GC/MS analysis, this new method provides a real time measurement for a wide range of TCE and PCE concentrations. This unique method was applied in 2000 and 2002 to measure TCE emitted from a manufacturer of stainless steel tubing in Eastern Ontario. The maximum half-hour average concentration of TCE measured downwind of the facility was 1300 μg/m3 and the maxi- mum instantaneous level was measured at 115,000 μg/m3. The information collected by the TAGA unit was used by the Standard Development Branch of Ontario Ministry of the Environment to adopt the half-hour Point of Impingement (POI) standard of TCE to be 36 μg/m3 in 2010. This method successfully identified and simultaneously measured TCE and PCE during a 2011 air monitoring survey of a hazardous waste disposal and treatment facility in Southern Ontario. Keywords: Environmental; Real-Time Monitoring; Mobile TAGA; TCE and PCE; Ambient Air 1. Introduction Trichloroethylene (TCE) is a chlorinated liquid that is commonly used for the extraction of solvents in many industrial processes and in the manufacturing of phar- maceuticals. Its use as a solvent in metal degreasing ac- counts for over 90% of the TCE use in Canada. As a re- sult, metal degreasing is the main source of TCE’s re- lease to the atmosphere [1]. TCE is a colourless and non- flammable chemical with a sweetish and chloroform-like odour [2], with an odour detection limit reported at 440 μg/m3 [3]. It is a central nervous system depressant and has been used as an anaesthetic. Occupational exposure to TCE has resulted in nausea, headache, loss of appetite, weakness, dizziness, and tremors. Acute exposures to high concentrations have caused irreversible nerve dam- age and death. Long term exposures to TCE have re- sulted in liver and kidney damage [4]. TCE is classified as a possible human carcinogen by the International Agency for Research on Cancer (IARC) [5]. In 1982, the Ontario Ministry of the Environment (OMOE) set a half- hour Point of Impingement (POI) standard in Regulation 346 for TCE of 85,000 μg/m3. In 1999, the OMOE set a POI interim standard for TCE to 3500 μg/m3 [1]. On February 1, 2010, the OMOE adopted a new POI stan- dard of 36 μg/m3 for TCE based on health impacts [6]. Tetrachloroethylene, also known as perchloroethylene (PCE), is an excellent solvent. It is volatile, highly stable and non-flammable. It is widely used in dry cleaning, *Corresponding author. Copyright © 2013 SciRes. JEP 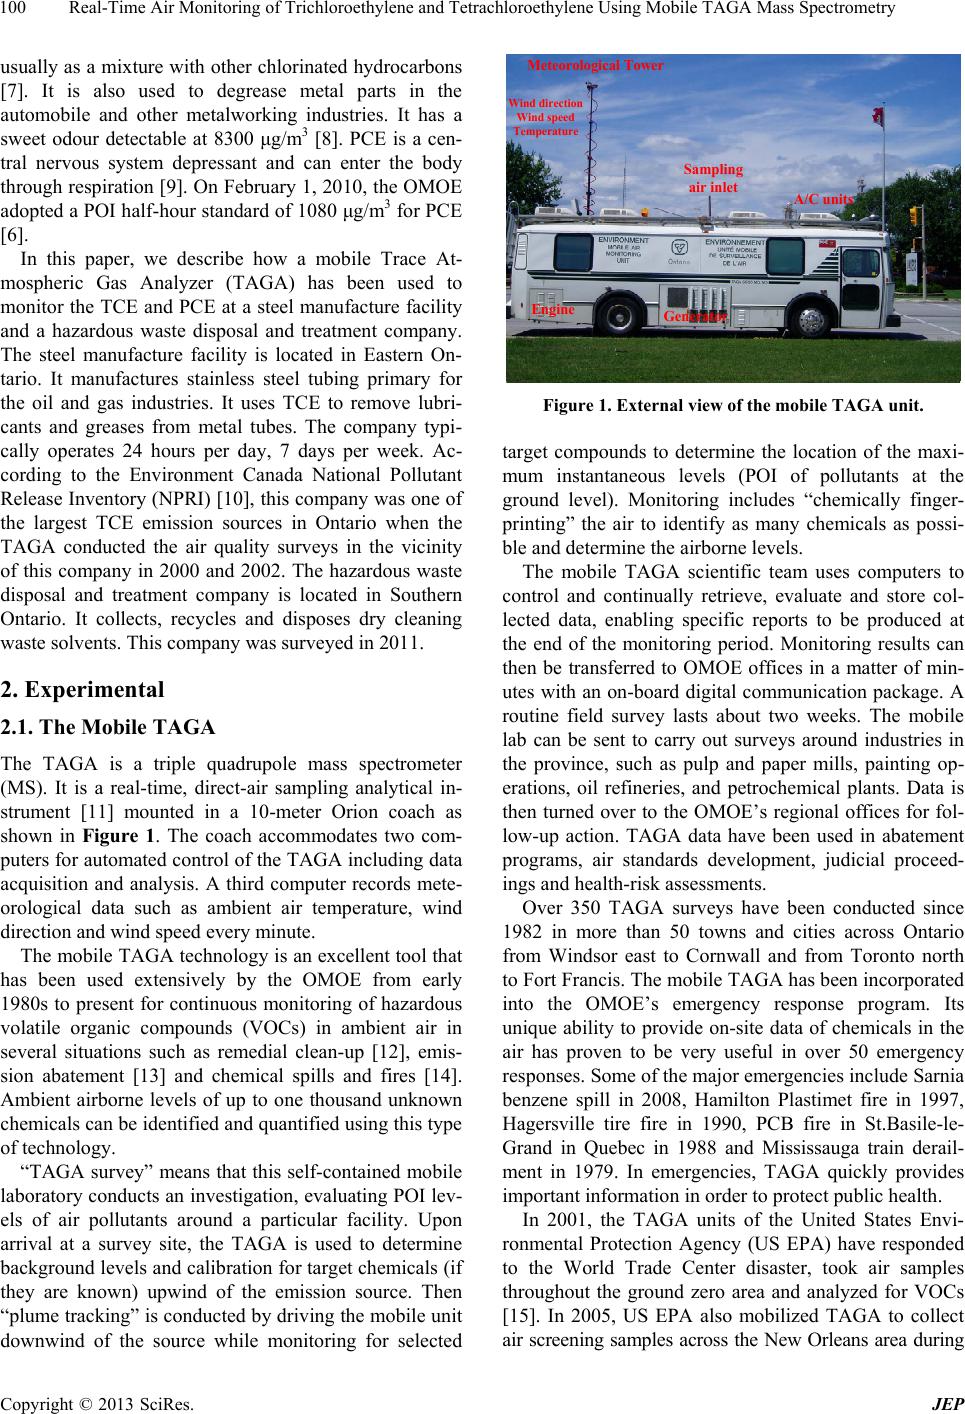 Real-Time Air Monitoring of Trichloroethylene and Tetrachloroethylene Using Mobile TAGA Mass Spectrometry 100 usually as a mixture with other chlorinated hydrocarbons [7]. It is also used to degrease metal parts in the automobile and other metalworking industries. It has a sweet odour detectable at 8300 μg/m3 [8]. PCE is a cen- tral nervous system depressant and can enter the body through respiration [9]. On February 1, 2010, the OMOE adopted a POI half-hour standard of 1080 μg/m3 for PCE [6]. In this paper, we describe how a mobile Trace At- mospheric Gas Analyzer (TAGA) has been used to monitor the TCE and PCE at a steel manufacture facility and a hazardous waste disposal and treatment company. The steel manufacture facility is located in Eastern On- tario. It manufactures stainless steel tubing primary for the oil and gas industries. It uses TCE to remove lubri- cants and greases from metal tubes. The company typi- cally operates 24 hours per day, 7 days per week. Ac- cording to the Environment Canada National Pollutant Release Inventory (NPRI) [10], this company was one of the largest TCE emission sources in Ontario when the TAGA conducted the air quality surveys in the vicinity of this company in 2000 and 2002. The hazardous waste disposal and treatment company is located in Southern Ontario. It collects, recycles and disposes dry cleaning waste solvents. This company was surveyed in 2011. 2. Experimental 2.1. The Mobile TAGA The TAGA is a triple quadrupole mass spectrometer (MS). It is a real-time, direct-air sampling analytical in- strument [11] mounted in a 10-meter Orion coach as shown in Figure 1. The coach accommodates two com- puters for automated control of the TAGA including data acquisition and analysis. A third computer records mete- orological data such as ambient air temperature, wind direction and wind speed every minute. The mobile TAGA technology is an excellent tool that has been used extensively by the OMOE from early 1980s to present for continuous monitoring of hazardous volatile organic compounds (VOCs) in ambient air in several situations such as remedial clean-up [12], emis- sion abatement [13] and chemical spills and fires [14]. Ambient airborne levels of up to one thousand unknown chemicals can be identified and quantified using this type of technology. “TAGA survey” means that this self-contained mobile laboratory conducts an investigation, evaluating POI lev- els of air pollutants around a particular facility. Upon arrival at a survey site, the TAGA is used to determine background levels and calibration for target chemicals (if they are known) upwind of the emission source. Then “plume tracking” is conducted by driving the mobile unit downwind of the source while monitoring for selected Meteorological Tower Sampling air inlet Engine Generator A/C units Wind direction Wind speed Temperature Figure 1. External view of the mobile TAGA unit. target compounds to determine the location of the maxi- mum instantaneous levels (POI of pollutants at the ground level). Monitoring includes “chemically finger- printing” the air to identify as many chemicals as possi- ble and determine the airborne levels. The mobile TAGA scientific team uses computers to control and continually retrieve, evaluate and store col- lected data, enabling specific reports to be produced at the end of the monitoring period. Monitoring results can then be transferred to OMOE offices in a matter of min- utes with an on-board digital communication package. A routine field survey lasts about two weeks. The mobile lab can be sent to carry out surveys around industries in the province, such as pulp and paper mills, painting op- erations, oil refineries, and petrochemical plants. Data is then turned over to the OMOE’s regional offices for fol- low-up action. TAGA data have been used in abatement programs, air standards development, judicial proceed- ings and health-risk assessments. Over 350 TAGA surveys have been conducted since 1982 in more than 50 towns and cities across Ontario from Windsor east to Cornwall and from Toronto north to Fort Francis. The mobile TAGA has been incorporated into the OMOE’s emergency response program. Its unique ability to provide on-site data of chemicals in the air has proven to be very useful in over 50 emergency responses. Some of the major emergencies include Sarnia benzene spill in 2008, Hamilton Plastimet fire in 1997, Hagersville tire fire in 1990, PCB fire in St.Basile-le- Grand in Quebec in 1988 and Mississauga train derail- ment in 1979. In emergencies, TAGA quickly provides important information in order to protect public health. In 2001, the TAGA units of the United States Envi- ronmental Protection Agency (US EPA) have responded to the World Trade Center disaster, took air samples throughout the ground zero area and analyzed for VOCs [15]. In 2005, US EPA also mobilized TAGA to collect air screening samples across the New Orleans area during Copyright © 2013 SciRes. JEP 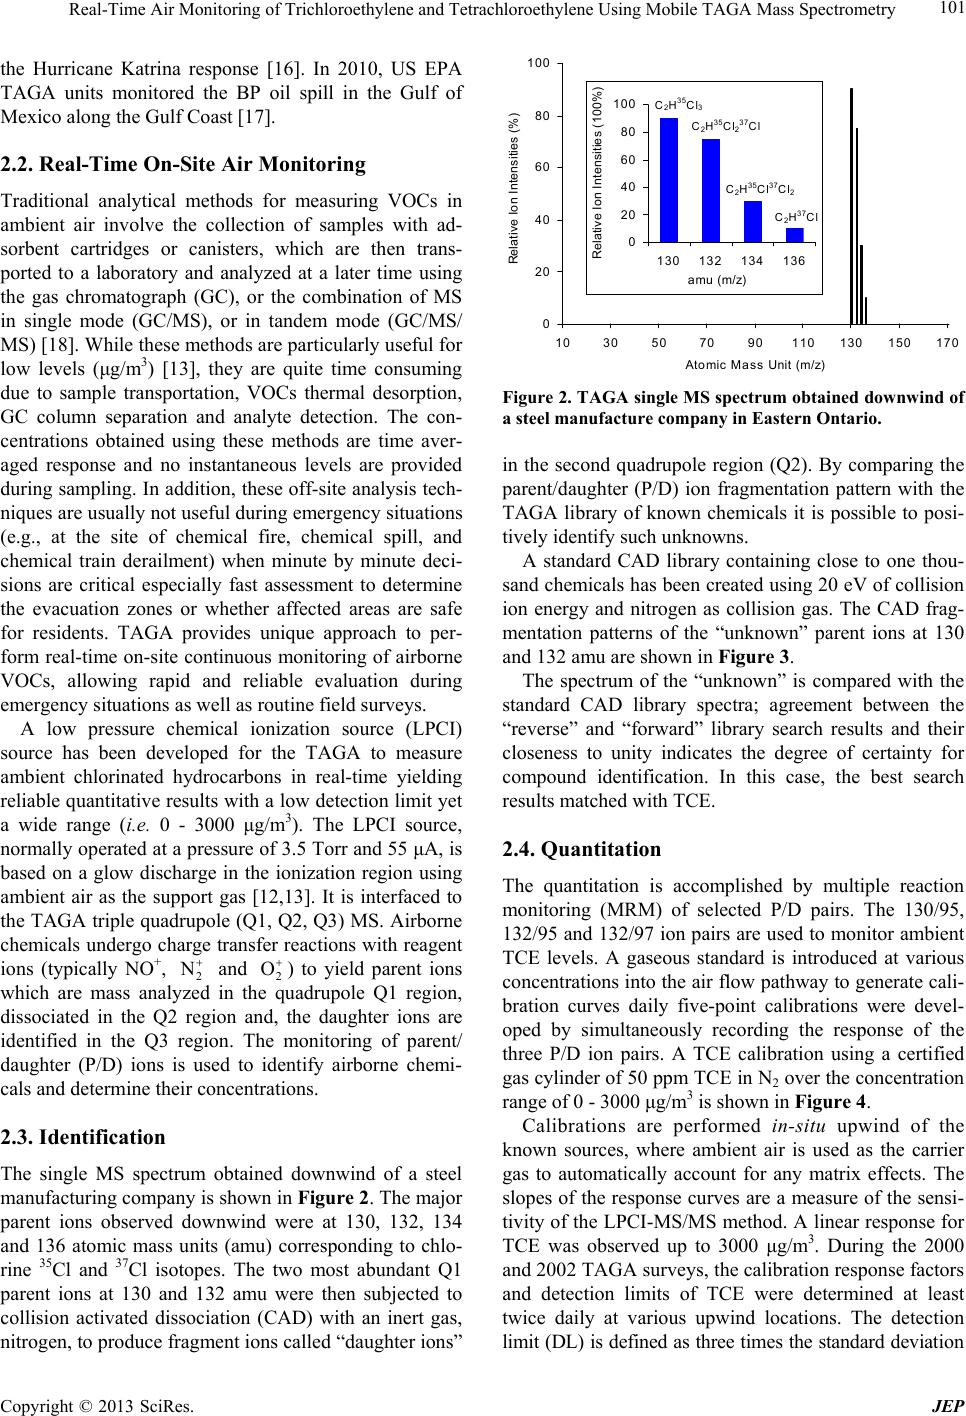 Real-Time Air Monitoring of Trichloroethylene and Tetrachloroethylene Using Mobile TAGA Mass Spectrometry 101 the Hurricane Katrina response [16]. In 2010, US EPA TAGA units monitored the BP oil spill in the Gulf of Mexico along the Gulf Coast [17]. 2.2. Real-Time On-Site Air Monitoring Traditional analytical methods for measuring VOCs in ambient air involve the collection of samples with ad- sorbent cartridges or canisters, which are then trans- ported to a laboratory and analyzed at a later time using the gas chromatograph (GC), or the combination of MS in single mode (GC/MS), or in tandem mode (GC/MS/ MS) [18]. While these methods are particularly useful for low levels (μg/m3) [13], they are quite time consuming due to sample transportation, VOCs thermal desorption, GC column separation and analyte detection. The con- centrations obtained using these methods are time aver- aged response and no instantaneous levels are provided during sampling. In addition, these off-site analysis tech- niques are usually not useful during emergency situations (e.g., at the site of chemical fire, chemical spill, and chemical train derailment) when minute by minute deci- sions are critical especially fast assessment to determine the evacuation zones or whether affected areas are safe for residents. TAGA provides unique approach to per- form real-time on-site continuous monitoring of airborne VOCs, allowing rapid and reliable evaluation during emergency situations as well as routine field surveys. A low pressure chemical ionization source (LPCI) source has been developed for the TAGA to measure ambient chlorinated hydrocarbons in real-time yielding reliable quantitative results with a low detection limit yet a wide range (i.e. 0 - 3000 μg/m3). The LPCI source, normally operated at a pressure of 3.5 Torr and 55 μA, is based on a glow discharge in the ionization region using ambient air as the support gas [12,13]. It is interfaced to the TAGA triple quadrupole (Q1, Q2, Q3) MS. Airborne chemicals undergo charge transfer reactions with reagent ions (typically NO+, 2 and 2 O) to yield parent ions which are mass analyzed in the quadrupole Q1 region, dissociated in the Q2 region and, the daughter ions are identified in the Q3 region. The monitoring of parent/ daughter (P/D) ions is used to identify airborne chemi- cals and determine their concentrations. N 2.3. Identification The single MS spectrum obtained downwind of a steel manufacturing company is shown in Figure 2. The major parent ions observed downwind were at 130, 132, 134 and 136 atomic mass units (amu) corresponding to chlo- rine 35Cl and 37Cl isotopes. The two most abundant Q1 parent ions at 130 and 132 amu were then subjected to collision activated dissociation (CAD) with an inert gas, nitrogen, to produce fragment ions called “daughter ions” 0 20 40 60 80 100 1030507090110 130 150 170 Atomic Ma s s Unit (m/z) Relative Ion Intensities (%) 0 20 40 60 80 100 130 132 134 136 Relative Ion Intensities (100%) amu (m/z) C2H35Cl237Cl C2H35Cl3 C2H35Cl37Cl2 C2H37Cl Figure 2. TAGA single MS spectrum obtained downwind of a steel manufacture company in Eastern Ontario. in the second quadrupole region (Q2). By comparing the parent/daughter (P/D) ion fragmentation pattern with the TAGA library of known chemicals it is possible to posi- tively identify such unknowns. A standard CAD library containing close to one thou- sand chemicals has been created using 20 eV of collision ion energy and nitrogen as collision gas. The CAD frag- mentation patterns of the “unknown” parent ions at 130 and 132 amu are shown in Fi gure 3. The spectrum of the “unknown” is compared with the standard CAD library spectra; agreement between the “reverse” and “forward” library search results and their closeness to unity indicates the degree of certainty for compound identification. In this case, the best search results matched with TCE. 2.4. Quantitation The quantitation is accomplished by multiple reaction monitoring (MRM) of selected P/D pairs. The 130/95, 132/95 and 132/97 ion pairs are used to monitor ambient TCE levels. A gaseous standard is introduced at various concentrations into the air flow pathway to generate cali- bration curves daily five-point calibrations were devel- oped by simultaneously recording the response of the three P/D ion pairs. A TCE calibration using a certified gas cylinder of 50 ppm TCE in N2 over the concentration range of 0 - 3000 μg/m3 is shown in Fi gure 4. Calibrations are performed in-situ upwind of the known sources, where ambient air is used as the carrier gas to automatically account for any matrix effects. The slopes of the response curves are a measure of the sensi- tivity of the LPCI-MS/MS method. A linear response for TCE was observed up to 3000 μg/m3. During the 2000 and 2002 TAGA surveys, the calibration response factors and detection limits of TCE were determined at least twice daily at various upwind locations. The detection limit (DL) is defined as three tmes the standard deviation i Copyright © 2013 SciRes. JEP 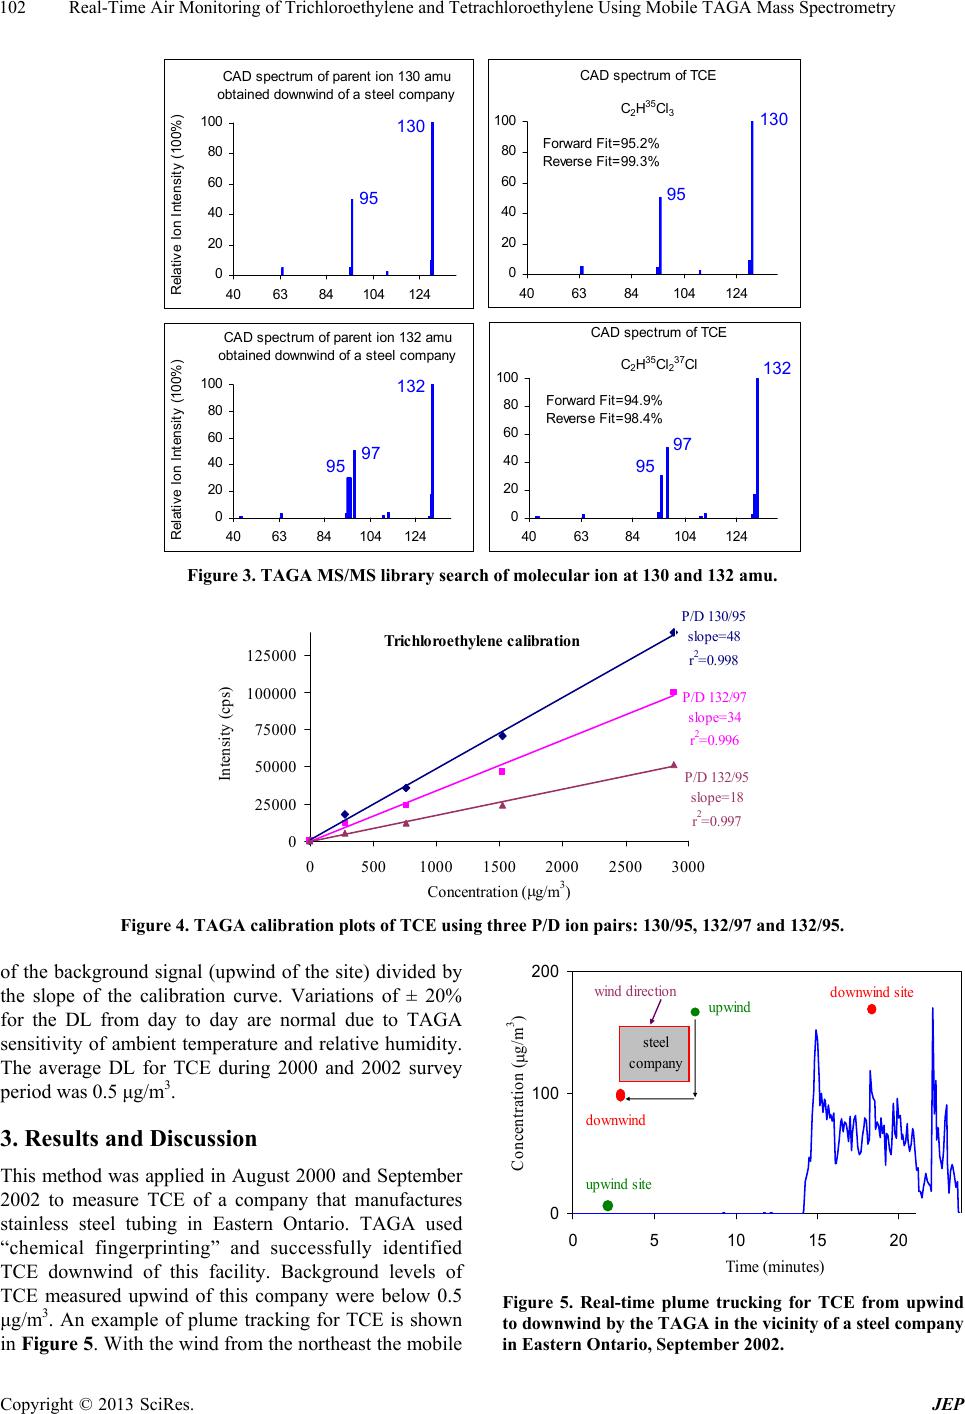 Real-Time Air Monitoring of Trichloroethylene and Tetrachloroethylene Using Mobile TAGA Mass Spectrometry Copyright © 2013 SciRes. JEP 102 0 20 40 60 80 100 406384104 124 130 95 C 2 H 35 Cl 3 Forward F i t = 9 5. 2% Reverse Fit=99.3% 0 20 40 60 80 100 406384104 124 132 95 97 C 2 H 35 Cl 237 Cl Forward F i t=94. 9% Reverse F i t=98. 4% CAD spec t rum of TCE CA D spectrum of TCE 0 20 40 60 80 100 406384104 124 Relative Ion Intensity (100%) CAD spect rum of parent i on 132 amu obt ai ne d downwi nd of a ste el company 132 95 97 0 20 40 60 80 100 406384104124 Relative Ion Intensity (100%) 95 130 CAD spect rum of parent i o n 130 amu obt ai ned downwi nd of a steel company Figure 3. TAGA MS/MS library search of molecular ion at 130 and 132 amu. Tr ichloroethylen e calibration 0 25000 50000 75000 100000 125000 050010001500 20002500 3000 Concentration (g/m 3 ) Intensity (cps ) P/D 130/95 slope=48 r 2 =0.998 P/D 132/97 slope=34 r 2 = 0.996 P/D 132/95 slope=18 r 2 = 0.997 Figure 4. TAGA calibration plots of TCE using three P/D ion pairs: 130/95, 132/97 and 132/95. 0 100 200 0510 15 20 Time (minutes) Concentration (g/m 3 ) upwind site of the background signal (upwind of the site) divided by the slope of the calibration curve. Variations of ± 20% for the DL from day to day are normal due to TAGA sensitivity of ambient temperature and relative humidity. The average DL for TCE during 2000 and 2002 survey period was 0.5 μg/m3. 3. Results and Discussion This method was applied in August 2000 and September 2002 to measure TCE of a company that manufactures stainless steel tubing in Eastern Ontario. TAGA used “chemical fingerprinting” and successfully identified TCE downwind of this facility. Background levels of TCE measured upwind of this company were below 0.5 μg/m3. An example of plume tracking for TCE is shown in Figure 5. With the wind from the northeast the mobile downwind site wind directio n upwind steel company downwind Figure 5. Real-time plume trucking for TCE from upwind to downwind by the TAGA in the vicinity of a steel company in Eastern Ontario, September 2002. 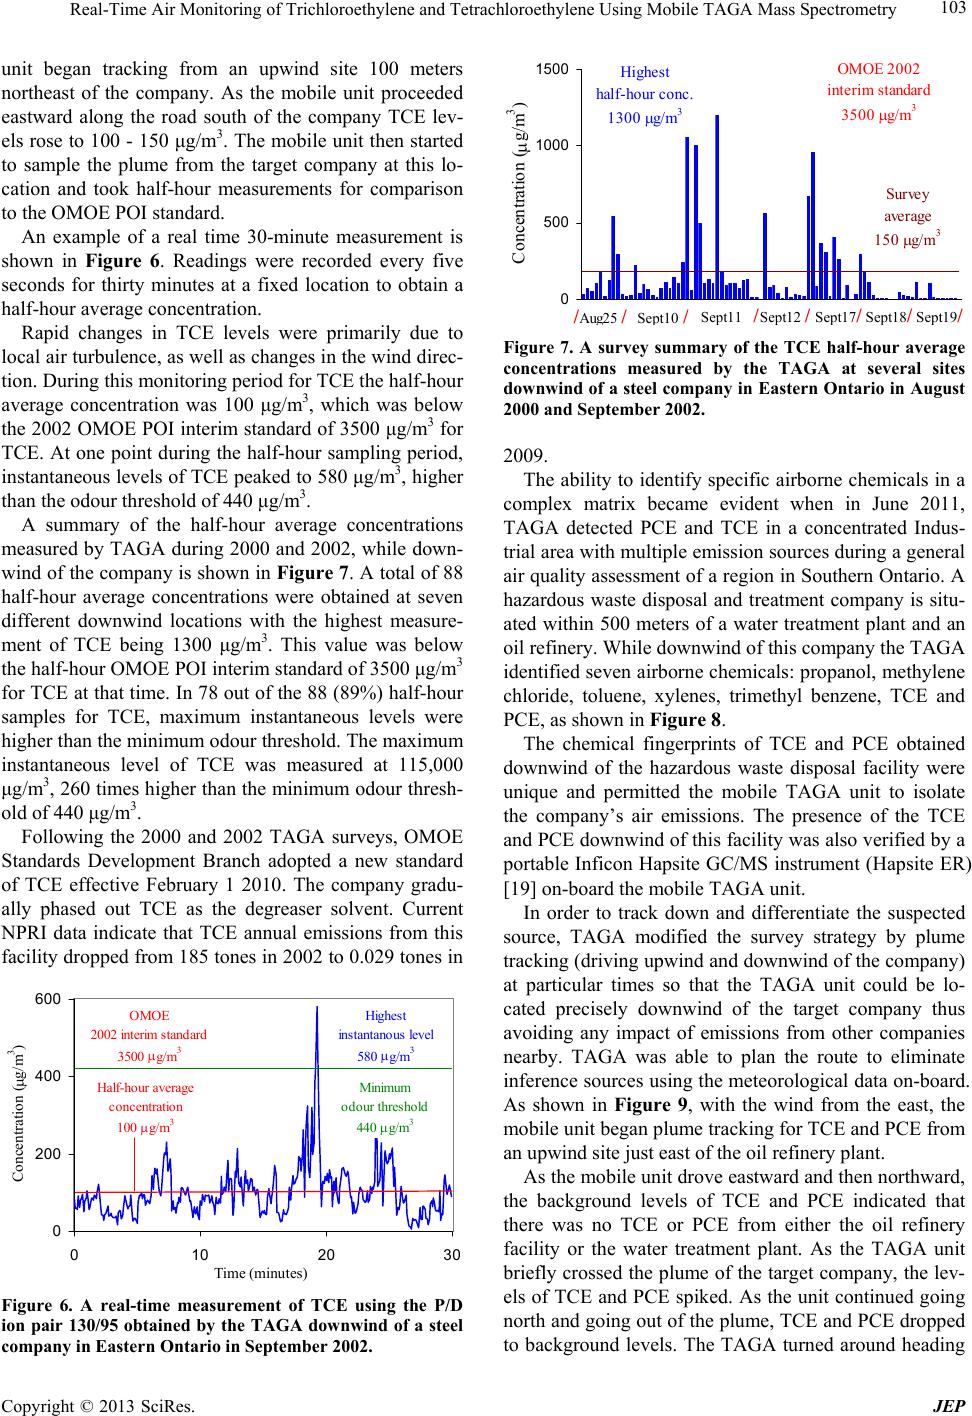 Real-Time Air Monitoring of Trichloroethylene and Tetrachloroethylene Using Mobile TAGA Mass Spectrometry 103 unit began tracking from an upwind site 100 meters northeast of the company. As the mobile unit proceeded eastward along the road south of the company TCE lev- els rose to 100 - 150 μg/m3. The mobile unit then started to sample the plume from the target company at this lo- cation and took half-hour measurements for comparison to the OMOE POI standard. An example of a real time 30-minute measurement is shown in Figure 6. Readings were recorded every five seconds for thirty minutes at a fixed location to obtain a half-hour average concentration. Rapid changes in TCE levels were primarily due to local air turbulence, as well as changes in the wind direc- tion. During this monitoring period for TCE the half-hour average concentration was 100 μg/m3, which was below the 2002 OMOE POI interim standard of 3500 μg/m3 for TCE. At one point during the half-hour sampling period, instantaneous levels of TCE peaked to 580 μg/m3, higher than the odour threshold of 440 μg/m3. A summary of the half-hour average concentrations measured by TAGA during 2000 and 2002, while down- wind of the company is shown in Figure 7. A total of 88 half-hour average concentrations were obtained at seven different downwind locations with the highest measure- ment of TCE being 1300 μg/m3. This value was below the half-hour OMOE POI interim standard of 3500 μg/m3 for TCE at that time. In 78 out of the 88 (89%) half-hour samples for TCE, maximum instantaneous levels were higher than the minimum odour threshold. The maximum instantaneous level of TCE was measured at 115,000 μg/m3, 260 times higher than the minimum odour thresh- old of 440 μg/m3. Following the 2000 and 2002 TAGA surveys, OMOE Standards Development Branch adopted a new standard of TCE effective February 1 2010. The company gradu- ally phased out TCE as the degreaser solvent. Current NPRI data indicate that TCE annual emissions from this facility dropped from 185 tones in 2002 to 0.029 tones in 0 200 400 600 010203 0 Concentration (g/m 3 ) Half-hour average concentration 100 g/m 3 Minimum odour threshold 440 g/m 3 Highest instantanous level 580 g/m 3 OMOE 2002 interim standard 3500 g/m 3 Time (minutes) Figure 6. A real-time measurement of TCE using the P/D ion pair 130/95 obtained by the TAGA downwind of a steel company in Eastern Ontario in September 2002. 0 500 1000 1500 Concentration (g/m 3 ) / Au OMOE 2002 interim standard 3500 g/m 3 Highest half-hour conc. 1300 g/m 3 Survey ave rage 150 g/m 3 t11 Se / t12 Se / g 25 Se / p t10 Se / p p p t17 Se / p t18 Se / p t1 9 / Figure 7. A survey summary of the TCE half-hour average concentrations measured by the TAGA at several sites downwind of a steel company in Eastern Ontario in August 2000 and September 2002. 2009. The ability to identify specific airborne chemicals in a complex matrix became evident when in June 2011, TAGA detected PCE and TCE in a concentrated Indus- trial area with multiple emission sources during a general air quality assessment of a region in Southern Ontario. A hazardous waste disposal and treatment company is situ- ated within 500 meters of a water treatment plant and an oil refinery. While downwind of this company the TAGA identified seven airborne chemicals: propanol, methylene chloride, toluene, xylenes, trimethyl benzene, TCE and PCE, as shown in Figure 8. The chemical fingerprints of TCE and PCE obtained downwind of the hazardous waste disposal facility were unique and permitted the mobile TAGA unit to isolate the company’s air emissions. The presence of the TCE and PCE downwind of this facility was also verified by a portable Inficon Hapsite GC/MS instrument (Hapsite ER) [19] on-board the mobile TAGA unit. In order to track down and differentiate the suspected source, TAGA modified the survey strategy by plume tracking (driving upwind and downwind of the company) at particular times so that the TAGA unit could be lo- cated precisely downwind of the target company thus avoiding any impact of emissions from other companies nearby. TAGA was able to plan the route to eliminate inference sources using the meteorological data on-board. As shown in Figure 9, with the wind from the east, the mobile unit began plume tracking for TCE and PCE from an upwind site just east of the oil refinery plant. As the mobile unit drove eastward and then northward, the background levels of TCE and PCE indicated that there was no TCE or PCE from either the oil refinery facility or the water treatment plant. As the TAGA unit briefly crossed the plume of the target company, the lev- els of TCE and PCE spiked. As the unit continued going north and going out of the plume, TCE and PCE dropped to background levels. The TAGA turned around heading Copyright © 2013 SciRes. JEP 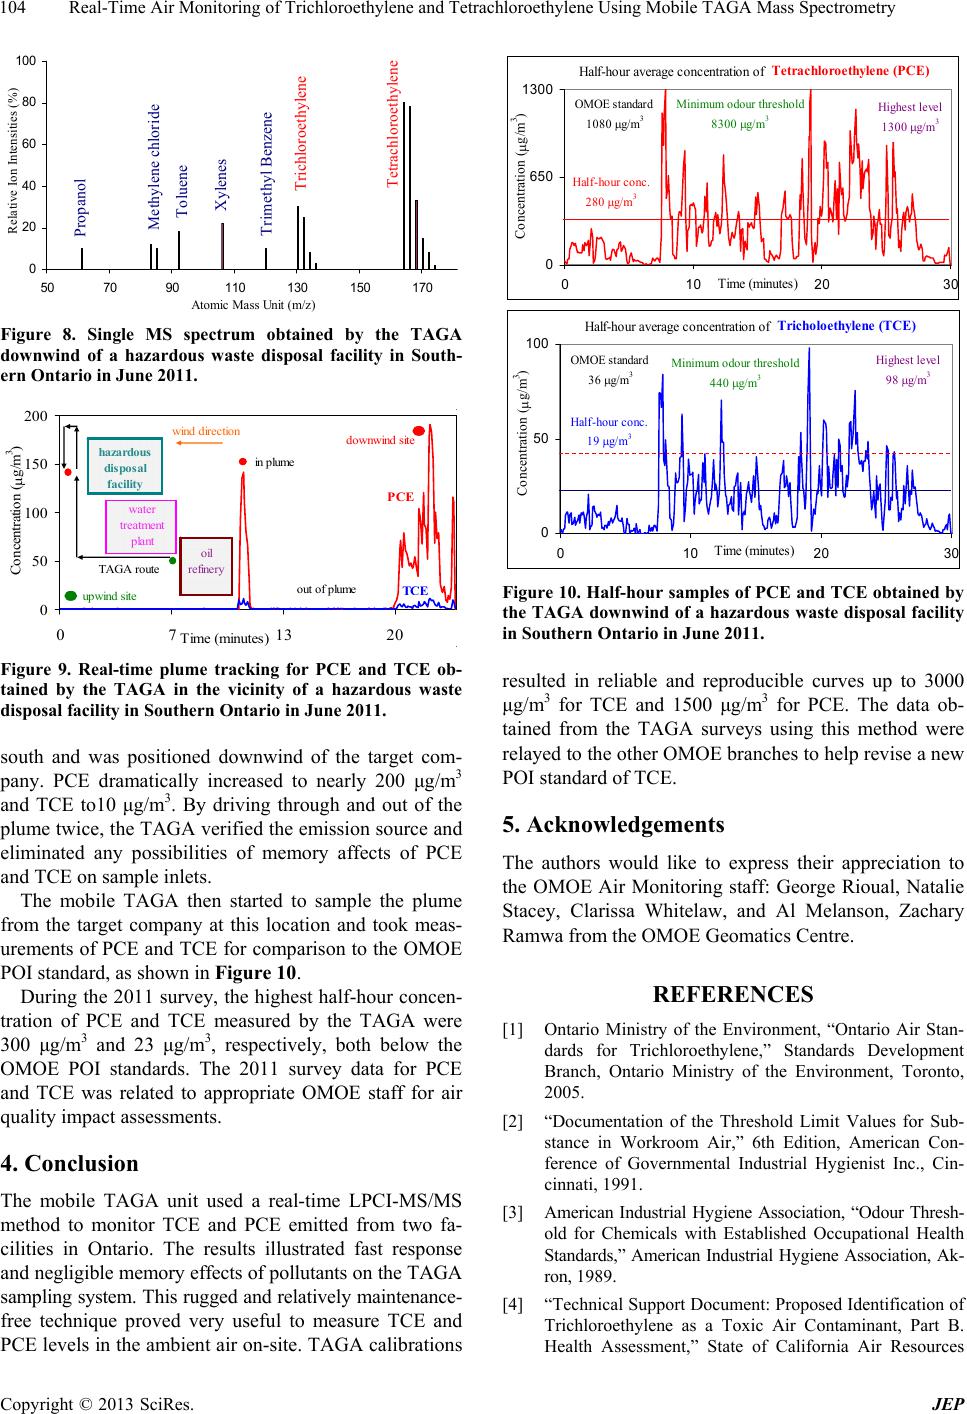 Real-Time Air Monitoring of Trichloroethylene and Tetrachloroethylene Using Mobile TAGA Mass Spectrometry 104 0 20 40 60 80 100 507090110 130150 170 Atomic Mass Unit ( m/z ) Relative Ion Intensities (%) Trichloroethylene Tetrachloroeth Xylenes Toluene Propanol Methylene chloride Trimethyl Benzene y lene Figure 8. Single MS spectrum obtained by the TAGA downwind of a hazardous waste disposal facility in South- ern Ontario in June 2011. 0 50 100 150 200 0713 20 Concentration (g/m 3 ) upwind siteout of plume in plume wind directiondownwind site hazard ous disposal facility oil refinery water treatment p lant PCE TCE Time ( minutes ) TAGA route Figure 9. Real-time plume tracking for PCE and TCE ob- tained by the TAGA in the vicinity of a hazardous waste disposal facility in Southern Ontario in June 2011. south and was positioned downwind of the target com- pany. PCE dramatically increased to nearly 200 μg/m3 and TCE to10 μg/m3. By driving through and out of the plume twice, the TAGA verified the emission source and eliminated any possibilities of memory affects of PCE and TCE on sample inlets. The mobile TAGA then started to sample the plume from the target company at this location and took meas- urements of PCE and TCE for comparison to the OMOE POI standard, as shown in Figure 10. During the 2011 survey, the highest half-hour concen- tration of PCE and TCE measured by the TAGA were 300 μg/m3 and 23 μg/m3, respectively, both below the OMOE POI standards. The 2011 survey data for PCE and TCE was related to appropriate OMOE staff for air quality impact assessments. 4. Conclusion The mobile TAGA unit used a real-time LPCI-MS/MS method to monitor TCE and PCE emitted from two fa- cilities in Ontario. The results illustrated fast response and negligible memory effects of pollutants on the TAGA sampling system. This rugged and relatively maintenance- free technique proved very useful to measure TCE and PCE levels in the ambient air on-site. TAGA calibrations 0 50 100 0102030 Half-hour average concentration of Tri choloet hylene (TCE) Highest level 98 g/m3 Half-hour conc. 19 g/m3 Minimum odour threshold 440 g/m3 OMOE standard 36 g/m3 Concentration (g/m 3 ) Time (minutes) 0 650 1300 0 102030 Concentration ( g/m 3 ) Half-hour average concentration of Half-hour conc. 280 g/m3 Tetrachloroethylene (PCE) OMOE standard 1080 g/m 3 Minimum odour threshold 8300 g/m3 Highest level 1300 g/m 3 Time (minutes) Figure 10. Half-hour samples of PCE and TCE obtained by the TAGA downwind of a hazardous waste disposal facility in Southern Ontario in June 2011. resulted in reliable and reproducible curves up to 3000 μg/m3 for TCE and 1500 μg/m3 for PCE. The data ob- tained from the TAGA surveys using this method were relayed to the other OMOE branches to help revise a new POI standard of TCE. 5. Acknowledgements The authors would like to express their appreciation to the OMOE Air Monitoring staff: George Rioual, Natalie Stacey, Clarissa Whitelaw, and Al Melanson, Zachary Ramwa from the OMOE Geomatics Centre. REFERENCES [1] Ontario Ministry of the Environment, “Ontario Air Stan- dards for Trichloroethylene,” Standards Development Branch, Ontario Ministry of the Environment, Toronto, 2005. [2] “Documentation of the Threshold Limit Values for Sub- stance in Workroom Air,” 6th Edition, American Con- ference of Governmental Industrial Hygienist Inc., Cin- cinnati, 1991. [3] American Industrial Hygiene Association, “Odour Thresh- old for Chemicals with Established Occupational Health Standards,” American Industrial Hygiene Association, Ak- ron, 1989. [4] “Technical Support Document: Proposed Identification of Trichloroethylene as a Toxic Air Contaminant, Part B. Health Assessment,” State of California Air Resources Copyright © 2013 SciRes. JEP 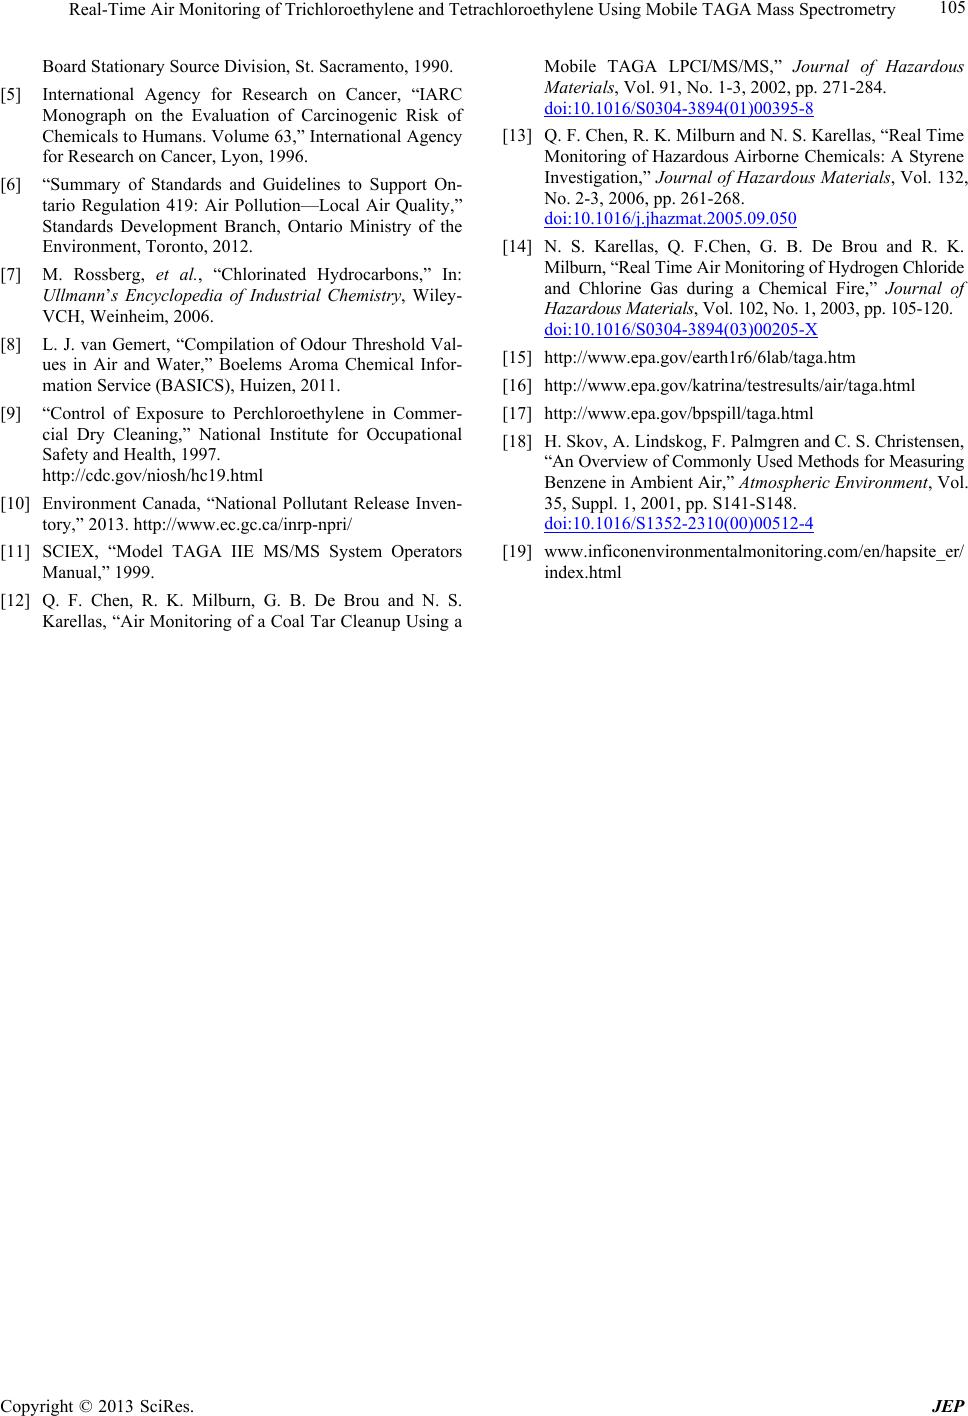 Real-Time Air Monitoring of Trichloroethylene and Tetrachloroethylene Using Mobile TAGA Mass Spectrometry Copyright © 2013 SciRes. JEP 105 Board Stationary Source Division, St. Sacramento, 1990. [5] International Agency for Research on Cancer, “IARC Monograph on the Evaluation of Carcinogenic Risk of Chemicals to Humans. Volume 63,” International Agency for Research on Cancer, Lyon, 1996. [6] “Summary of Standards and Guidelines to Support On- tario Regulation 419: Air Pollution—Local Air Quality,” Standards Development Branch, Ontario Ministry of the Environment, Toronto, 2012. [7] M. Rossberg, et al., “Chlorinated Hydrocarbons,” In: Ullmann’s Encyclopedia of Industrial Chemistry, Wiley- VCH, Weinheim, 2006. [8] L. J. van Gemert, “Compilation of Odour Threshold Val- ues in Air and Water,” Boelems Aroma Chemical Infor- mation Service (BASICS), Huizen, 2011. [9] “Control of Exposure to Perchloroethylene in Commer- cial Dry Cleaning,” National Institute for Occupational Safety and Health, 1997. http://cdc.gov/niosh/hc19.html [10] Environment Canada, “National Pollutant Release Inven- tory,” 2013. http://www.ec.gc.ca/inrp-npri/ [11] SCIEX, “Model TAGA IIE MS/MS System Operators Manual,” 1999. [12] Q. F. Chen, R. K. Milburn, G. B. De Brou and N. S. Karellas, “Air Monitoring of a Coal Tar Cleanup Using a Mobile TAGA LPCI/MS/MS,” Journal of Hazardous Materials, Vol. 91, No. 1-3, 2002, pp. 271-284. doi:10.1016/S0304-3894(01)00395-8 [13] Q. F. Chen, R. K. Milburn and N. S. Karellas, “Real Time Monitoring of Hazardous Airborne Chemicals: A Styrene Investigation,” Journal of Hazardous Materials, Vol. 132, No. 2-3, 2006, pp. 261-268. doi:10.1016/j.jhazmat.2005.09.050 [14] N. S. Karellas, Q. F.Chen, G. B. De Brou and R. K. Milburn, “Real Time Air Monitoring of Hydrogen Chloride and Chlorine Gas during a Chemical Fire,” Journal of Hazardous Materials, Vol. 102, No. 1, 2003, pp. 105-120. doi:10.1016/S0304-3894(03)00205-X [15] http://www.epa.gov/earth1r6/6lab/taga.htm [16] http://www.epa.gov/katrina/testresults/air/taga.html [17] http://www.epa.gov/bpspill/taga.html [18] H. Skov, A. Lindskog, F. Palmgren and C. S. Christensen, “An Overview of Commonly Used Methods for Measuring Benzene in Ambient Air,” Atmospheric Environment, Vol. 35, Suppl. 1, 2001, pp. S141-S148. doi:10.1016/S1352-2310(00)00512-4 [19] www.inficonenvironmentalmonitoring.com/en/hapsite_er/ index.html |