

Paper Menu >>
Journal Menu >>
 Modern Economy, 2013, 4, 513-519 http://dx.doi.org/10.4236/me.2013.48055 Published Online August 2013 (http://www.scirp.org/journal/me) Volume of Derivative Trading, Enterprise Value, and the Return on Assets Jin-Yong Yang Department of International Business, Hankuk University of Foreign Studies, Seoul, Korea Email: [email protected] Received April 24, 2013; revised May 24, 2013; accepted June 24, 2013 Copyright © 2013 Jin-Yong Yang. This is an open access article distributed under the Creative Commons Attribution License, which permits unrestricted use, distribution, and reproduction in any medium, provided the original work is properly cited. ABSTRACT We study how the volume of derivatives trading is associated with the return on assets (ROA), as well as the enterprise value proxied by abnormal return (AR), before and after the US Financial Crisis. Results suggest that before the crisis, the volume of over-the-counter trading, which tends to be less strictly regulated and thus can be more flexibly applied, is positively associated with AR and ROA, while exchange trading is not. After the financial crisis, exchange trading, which is more heavily regulated and thus has lower credit risks, is positively associated with AR and ROA. This implies that the kinds of derivatives products having a positive or negative effect on the enterprise value of financial institutions may vary according to each period of the economy. Therefore, in full consideration of the above, it is recommended that more appropriate alternatives to the regulations and inspections should be provided for derivatives products and trading methods of financial institutions. Keywords: Derivatives Trading Volume; Enterprise Value; Return on Assets 1. Introduction Derivatives trading can function positively for financial institutions. When market risks are relatively low, the volume of over-the-counter (OTC) trading of a financial institution, which tends to be less strictly regulated and thus can be more flexibly applied, is likely to have a pos- itive association with the return on assets (ROA), as well as the enterprise value proxied by abnormal return (AR), before and after the US Financial Crisis. However, when market risks are relatively high, this association would be less clear. Instead, the volume of exchange trading, which is more heavily regulated and thus has lower credit risks, is likely to have a positive association with AR or ROA. The goal of this paper is to test these hypotheses. The legislation of Commodity Futures Modernization Act (CFMA) in 2000 confirmed that OTC derivatives trading would not be regulated. Since then, OTC deriva- tives trading had actively grown until the U.S. Financial Crisis, which resulted in intensified regulation. Hence, this paper also studies the effects of derivatives trading according to economic circumstances in diverse ways. Because most of the major financial institutions se- lected as samples for the study were banks and/or hold- ing companies of the banks, ROA, which represents net profit during the term based on assets size can be ex- plained as the profit performance index of the banks. The AR is the realized return net of the expected return. This approach is also adopted in Ryu, Baek, Yang and Chae [1], closely related to this paper. Ryu, Baek, Yang and Chae [1] document a positive association between derivatives trading volume, both OTC and exchange, and AR and ROA for major U.S. financial institutions. In addition, they analyze a similar association by the type of financial institution on the business performance. This paper studies how the asso- ciation differs according to the market risks, in order to understand the mechanism of derivatives trading. This is meaningful especially because different regulations and supervisions have been applied for OTC and exchange derivatives. In addition, the derivatives market situation before and after the financial crisis has changed quite a bit and accordingly, it is expected that the effect on the business performance of the financial institutions that traded the derivatives would be different depending on the market situation. Numerous papers study the derivatives market. Ryu, Baek, Yang and Chae [1] document that an increase in exchange of OTC option trading volumes is positively associated with AR. However, an increase in futures and credit derivatives is negatively associated with AR. In C opyright © 2013 SciRes. ME 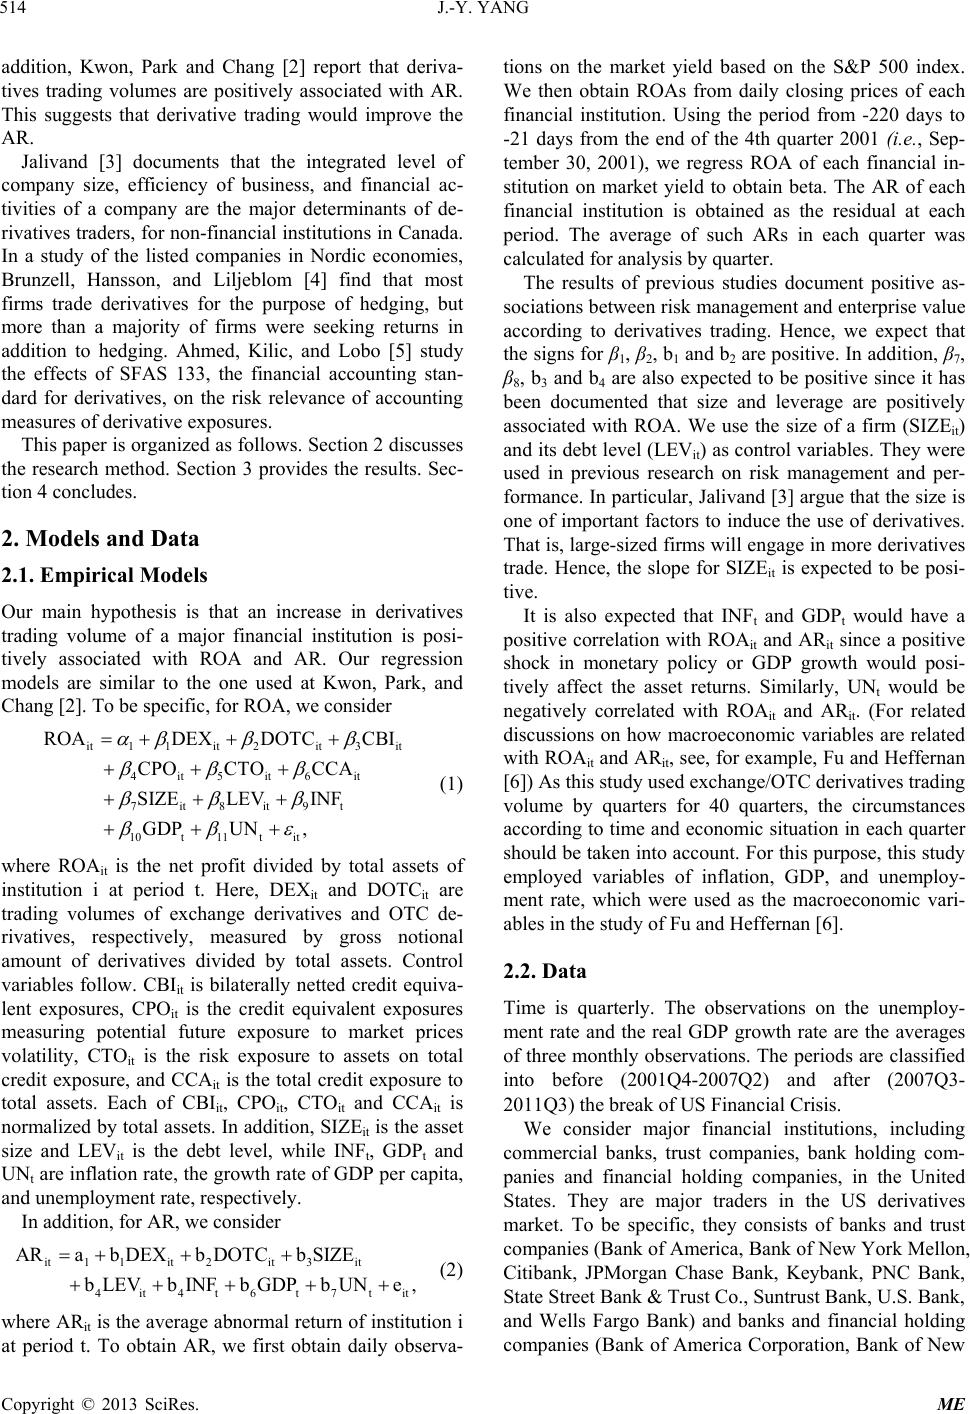 J.-Y. YANG 514 addition, Kwon, Park and Chang [2] report that deriva- tives trading volumes are positively associated with AR. This suggests that derivative trading would improve the AR. Jalivand [3] documents that the integrated level of company size, efficiency of business, and financial ac- tivities of a company are the major determinants of de- rivatives traders, for non-financial institutions in Canada. In a study of the listed companies in Nordic economies, Brunzell, Hansson, and Liljeblom [4] find that most firms trade derivatives for the purpose of hedging, but more than a majority of firms were seeking returns in addition to hedging. Ahmed, Kilic, and Lobo [5] study the effects of SFAS 133, the financial accounting stan- dard for derivatives, on the risk relevance of accounting measures of derivative exposures. This paper is organized as follows. Section 2 discusses the research method. Section 3 provides the results. Sec- tion 4 concludes. 2. Models and Data 2.1. Empirical Models Our main hypothesis is that an increase in derivatives trading volume of a major financial institution is posi- tively associated with ROA and AR. Our regression models are similar to the one used at Kwon, Park, and Chang [2]. To be specific, for ROA, we consider it1 1it2it3it 4it5it6 it 7it8it9t 10t11 t it ROADEXDOTC CBI CPO CTO CCA SIZELEV INF GDPUN , (1) where ROAit is the net profit divided by total assets of institution i at period t. Here, DEXit and DOTCit are trading volumes of exchange derivatives and OTC de- rivatives, respectively, measured by gross notional amount of derivatives divided by total assets. Control variables follow. CBIit is bilaterally netted credit equiva- lent exposures, CPOit is the credit equivalent exposures measuring potential future exposure to market prices volatility, CTOit is the risk exposure to assets on total credit exposure, and CCAit is the total credit exposure to total assets. Each of CBIit, CPOit, CTOit and CCAit is normalized by total assets. In addition, SIZEit is the asset size and LEVit is the debt level, while INFt, GDPt and UNt are inflation rate, the growth rate of GDP per capita, and unemployment rate, respectively. In addition, for AR, we consider it1 1it2it3it 4 it4t6t7tit ARab DEXbDOTCb SIZE b LEVb INFb GDPbUNe, (2) where ARit is the average abnormal return of institution i at period t. To obtain AR, we first obtain daily observa- tions on the market yield based on the S&P 500 index. We then obtain ROAs from daily closing prices of each financial institution. Using the period from -220 days to -21 days from the end of the 4th quarter 2001 (i.e., Sep- tember 30, 2001), we regress ROA of each financial in- stitution on market yield to obtain beta. The AR of each financial institution is obtained as the residual at each period. The average of such ARs in each quarter was calculated for analysis by quarter. The results of previous studies document positive as- sociations between risk management and enterprise value according to derivatives trading. Hence, we expect that the signs for β1, β2, b1 and b2 are positive. In addition, β7, β8, b3 and b4 are also expected to be positive since it has been documented that size and leverage are positively associated with ROA. We use the size of a firm (SIZEit) and its debt level (LEVit) as control variables. They were used in previous research on risk management and per- formance. In particular, Jalivand [3] argue that the size is one of important factors to induce the use of derivatives. That is, large-sized firms will engage in more derivatives trade. Hence, the slope for SIZEit is expected to be posi- tive. It is also expected that INFt and GDPt would have a positive correlation with ROAit and ARit since a positive shock in monetary policy or GDP growth would posi- tively affect the asset returns. Similarly, UNt would be negatively correlated with ROAit and ARit. (For related discussions on how macroeconomic variables are related with ROAit and ARit, see, for example, Fu and Heffernan [6]) As this study used exchange/OTC derivatives trading volume by quarters for 40 quarters, the circumstances according to time and economic situation in each quarter should be taken into account. For this purpose, this study employed variables of inflation, GDP, and unemploy- ment rate, which were used as the macroeconomic vari- ables in the study of Fu and Heffernan [6]. 2.2. Data Time is quarterly. The observations on the unemploy- ment rate and the real GDP growth rate are the averages of three monthly observations. The periods are classified into before (2001Q4-2007Q2) and after (2007Q3- 2011Q3) the break of US Financial Crisis. We consider major financial institutions, including commercial banks, trust companies, bank holding com- panies and financial holding companies, in the United States. They are major traders in the US derivatives market. To be specific, they consists of banks and trust companies (Bank of America, Bank of New York Mellon, Citibank, JPMorgan Chase Bank, Keybank, PNC Bank, State Street Bank & Trust Co., Suntrust Bank, U.S. Bank, and Wells Fargo Bank) and banks and financial holding companies (Bank of America Corporation, Bank of New Copyright © 2013 SciRes. ME 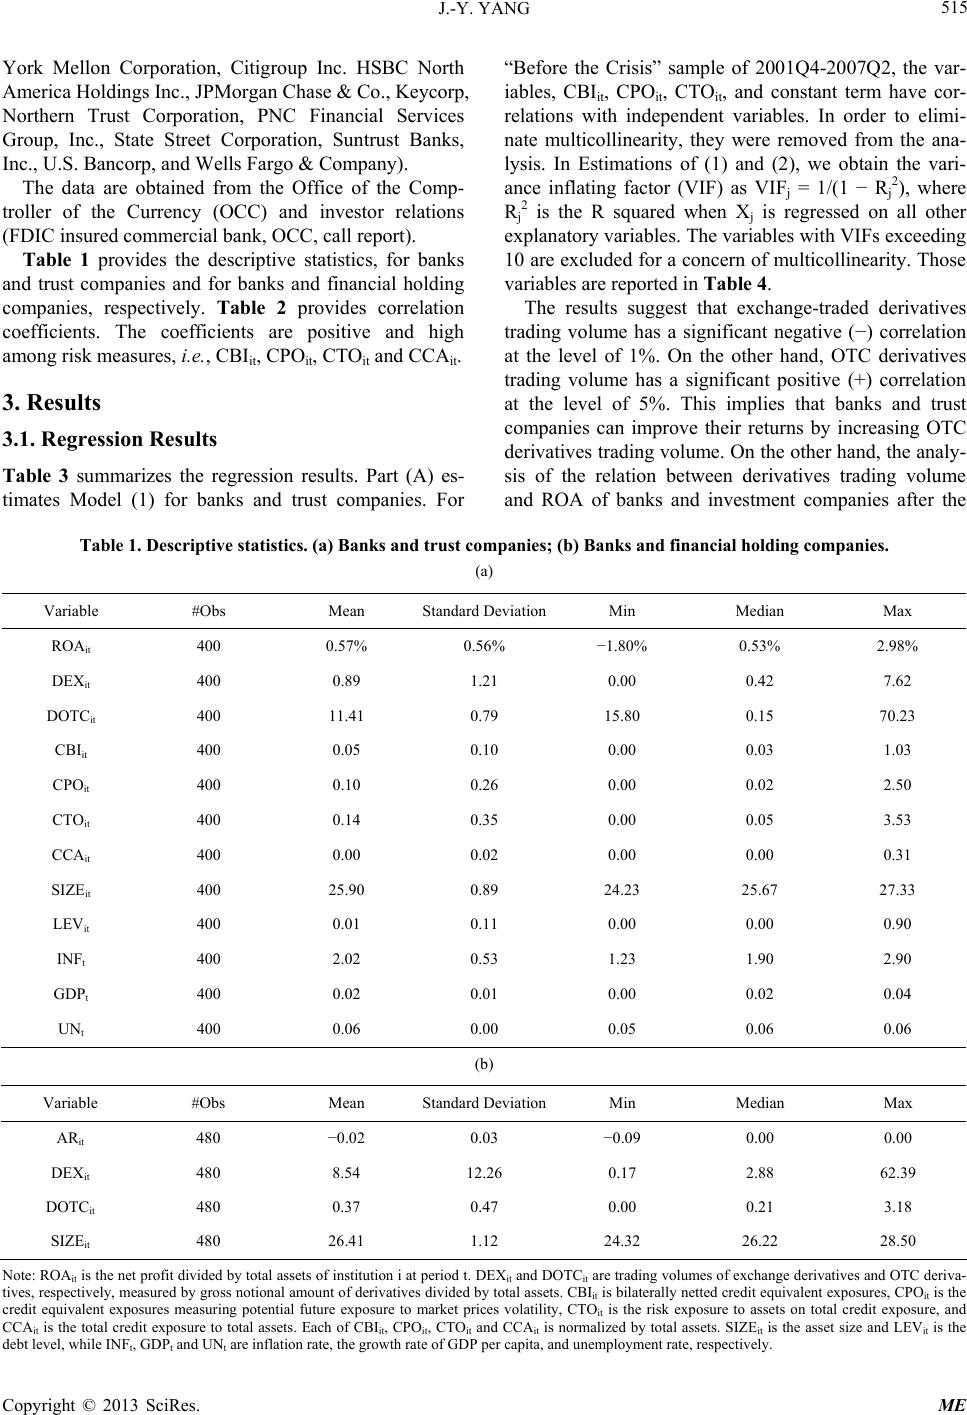 J.-Y. YANG Copyright © 2013 SciRes. ME 515 York Mellon Corporation, Citigroup Inc. HSBC North America Holdings Inc., JPMorgan Chase & Co., Keycorp, Northern Trust Corporation, PNC Financial Services Group, Inc., State Street Corporation, Suntrust Banks, Inc., U.S. Bancorp, and Wells Fargo & Company). The data are obtained from the Office of the Comp- troller of the Currency (OCC) and investor relations (FDIC insured commercial bank, OCC, call report). Table 1 provides the descriptive statistics, for banks and trust companies and for banks and financial holding companies, respectively. Table 2 provides correlation coefficients. The coefficients are positive and high among risk measures, i.e., CBIit, CPOit, CTOit and CCAit. 3. Results 3.1. Regression Results Table 3 summarizes the regression results. Part (A) es- timates Model (1) for banks and trust companies. For “Before the Crisis” sample of 2001Q4-2007Q2, the var- iables, CBIit, CPOit, CTOit, and constant term have cor- relations with independent variables. In order to elimi- nate multicollinearity, they were removed from the ana- lysis. In Estimations of (1) and (2), we obtain the vari- ance inflating factor (VIF) as VIFj = 1/(1 − R j 2), where Rj 2 is the R squared when Xj is regressed on all other explanatory variables. The variables with VIFs exceeding 10 are excluded for a concern of multicollinearity. Those variables are reported in Table 4 . The results suggest that exchange-traded derivatives trading volume has a significant negative (−) correlation at the level of 1%. On the other hand, OTC derivatives trading volume has a significant positive (+) correlation at the level of 5%. This implies that banks and trust companies can improve their returns by increasing OTC derivatives trading volume. On the other hand, the analy- sis of the relation between derivatives trading volume and ROA of banks and investment companies after the Table 1. Descriptive statistics. (a) Banks and trust companies; (b) Banks and financial holding companies. (a) Variable #Obs Mean Standard DeviationMin Median Max ROAit 400 0.57% 0.56% −1.80% 0.53% 2.98% DEXit 400 0.89 1.21 0.00 0.42 7.62 DOTCit 400 11.41 0.79 15.80 0.15 70.23 CBIit 400 0.05 0.10 0.00 0.03 1.03 CPOit 400 0.10 0.26 0.00 0.02 2.50 CTOit 400 0.14 0.35 0.00 0.05 3.53 CCAit 400 0.00 0.02 0.00 0.00 0.31 SIZEit 400 25.90 0.89 24.23 25.67 27.33 LEVit 400 0.01 0.11 0.00 0.00 0.90 INFt 400 2.02 0.53 1.23 1.90 2.90 GDPt 400 0.02 0.01 0.00 0.02 0.04 UNt 400 0.06 0.00 0.05 0.06 0.06 (b) Variable #Obs Mean Standard DeviationMin Median Max ARit 480 −0.02 0.03 −0.09 0.00 0.00 DEXit 480 8.54 12.26 0.17 2.88 62.39 DOTCit 480 0.37 0.47 0.00 0.21 3.18 SIZEit 480 26.41 1.12 24.32 26.22 28.50 Note: ROAit is the net profit divided by total assets of institution i at period t. DEXit and DOTCit are trading volumes of exchange derivatives and OTC deriva- tives, respectively, measured by gross notional amount of derivatives divided by total assets. CBIit is bilaterally netted credit equivalent exposures, CPOit is the credit equivalent exposures measuring potential future exposure to market prices volatility, CTOit is the risk exposure to assets on total credit exposure, and CCAit is the total credit exposure to total assets. Each of CBIit, CPOit, CTOit and CCAit is normalized by total assets. SIZEit is the asset size and LEVit is the debt level, while INFt, GDPt and UNt are inflation rate, the growth rate of GDP per capita, and unemployment rate, respectively. 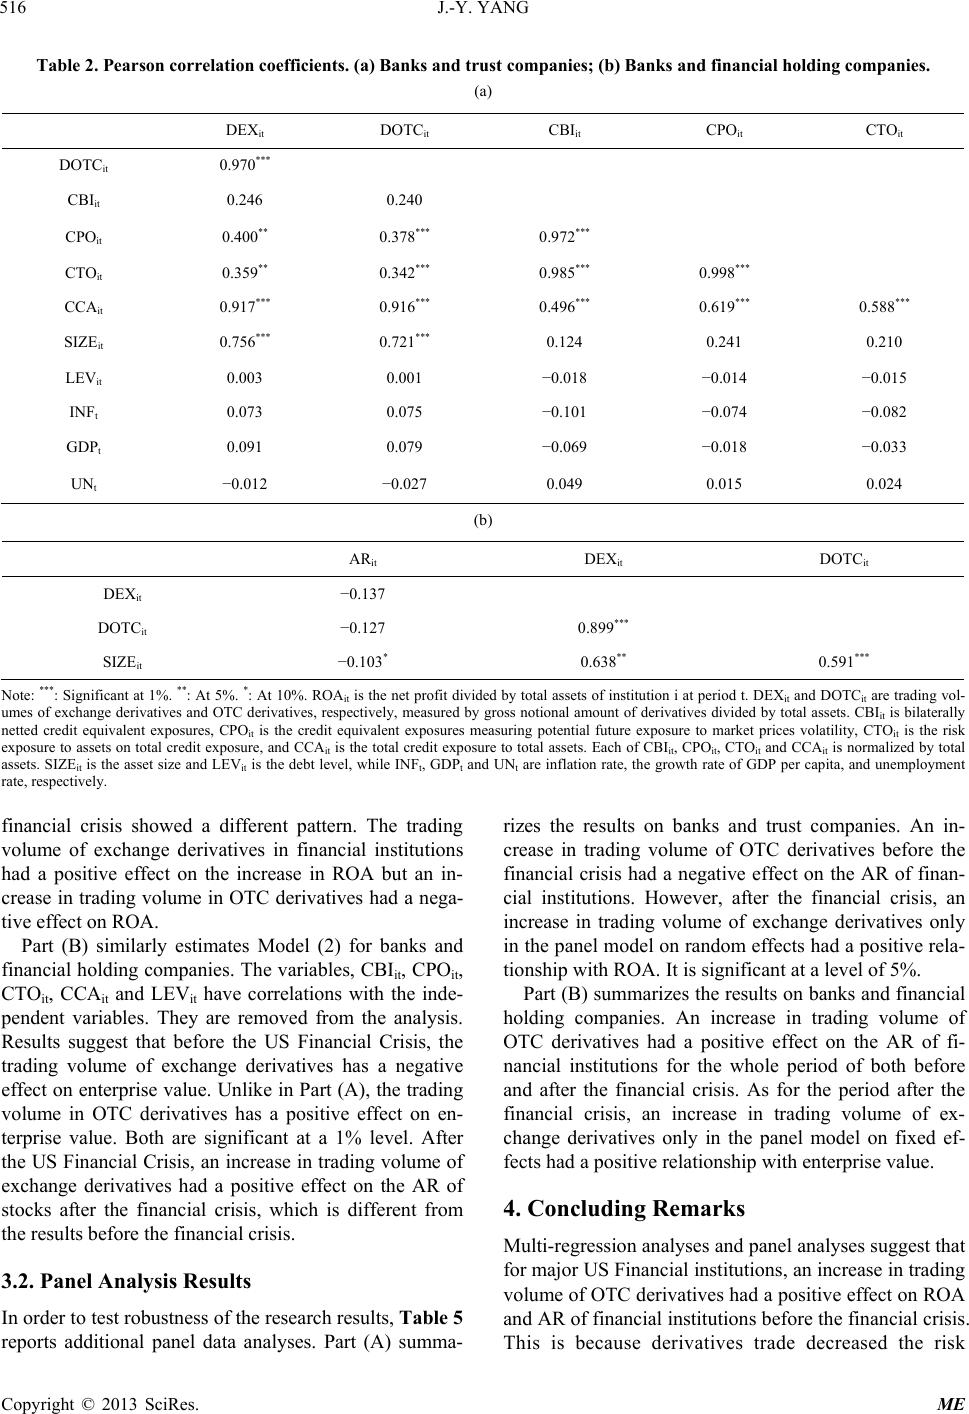 J.-Y. YANG 516 Table 2. Pearson correlation coefficients. (a) Banks and trust companies; (b) Banks and financial holding companies. (a) DEXit DOTCit CBIit CPOit CTOit DOTCit 0.970*** CBIit 0.246 0.240 CPOit 0.400** 0.378*** 0.972*** CTOit 0.359** 0.342*** 0.985*** 0.998*** CCAit 0.917*** 0.916*** 0.496*** 0.619*** 0.588*** SIZEit 0.756*** 0.721*** 0.124 0.241 0.210 LEVit 0.003 0.001 −0.018 −0.014 −0.015 INFt 0.073 0.075 −0.101 −0.074 −0.082 GDPt 0.091 0.079 −0.069 −0.018 −0.033 UNt −0.012 −0.027 0.049 0.015 0.024 (b) ARit DEXit DOTCit DEXit −0.137 DOTCit −0.127 0.899*** SIZEit −0.103* 0.638** 0.591*** Note: ***: Significant at 1%. **: At 5%. *: At 10%. ROAit is the net profit divided by total assets of institution i at period t. DEXit and DOTCit are trading vol- umes of exchange derivatives and OTC derivatives, respectively, measured by gross notional amount of derivatives divided by total assets. CBIit is bilaterally netted credit equivalent exposures, CPOit is the credit equivalent exposures measuring potential future exposure to market prices volatility, CTOit is the risk exposure to assets on total credit exposure, and CCAit is the total credit exposure to total assets. Each of CBIit, CPOit, CTOit and CCAit is normalized by total assets. SIZEit is the asset size and LEVit is the debt level, while INFt, GDPt and UNt are inflation rate, the growth rate of GDP per capita, and unemployment rate, respectively. financial crisis showed a different pattern. The trading volume of exchange derivatives in financial institutions had a positive effect on the increase in ROA but an in- crease in trading volume in OTC derivatives had a nega- tive effect on ROA. Part (B) similarly estimates Model (2) for banks and financial holding companies. The variables, CBIit, CPOit, CTOit, CCAit and LEVit have correlations with the inde- pendent variables. They are removed from the analysis. Results suggest that before the US Financial Crisis, the trading volume of exchange derivatives has a negative effect on enterprise value. Unlike in Part (A), the trading volume in OTC derivatives has a positive effect on en- terprise value. Both are significant at a 1% level. After the US Financial Crisis, an increase in trading volume of exchange derivatives had a positive effect on the AR of stocks after the financial crisis, which is different from the results before the financial crisis. 3.2. Panel Analysis Results In order to test robustness of the research results, Table 5 reports additional panel data analyses. Part (A) summa- rizes the results on banks and trust companies. An in- crease in trading volume of OTC derivatives before the financial crisis had a negative effect on the AR of finan- cial institutions. However, after the financial crisis, an increase in trading volume of exchange derivatives only in the panel model on random effects had a positive rela- tionship with ROA. It is significant at a level of 5%. Part (B) summarizes the results on banks and financial holding companies. An increase in trading volume of OTC derivatives had a positive effect on the AR of fi- nancial institutions for the whole period of both before and after the financial crisis. As for the period after the financial crisis, an increase in trading volume of ex- change derivatives only in the panel model on fixed ef- fects had a positive relationship with enterprise value. 4. Concluding Remarks Multi-regression analyses and panel analyses suggest that for major US Financial institutions, an increase in trading volume of OTC derivatives had a positive effect on ROA and AR of financial institutions before the financial crisis. is is because derivatives trade decreased the risk T h Copyright © 2013 SciRes. ME 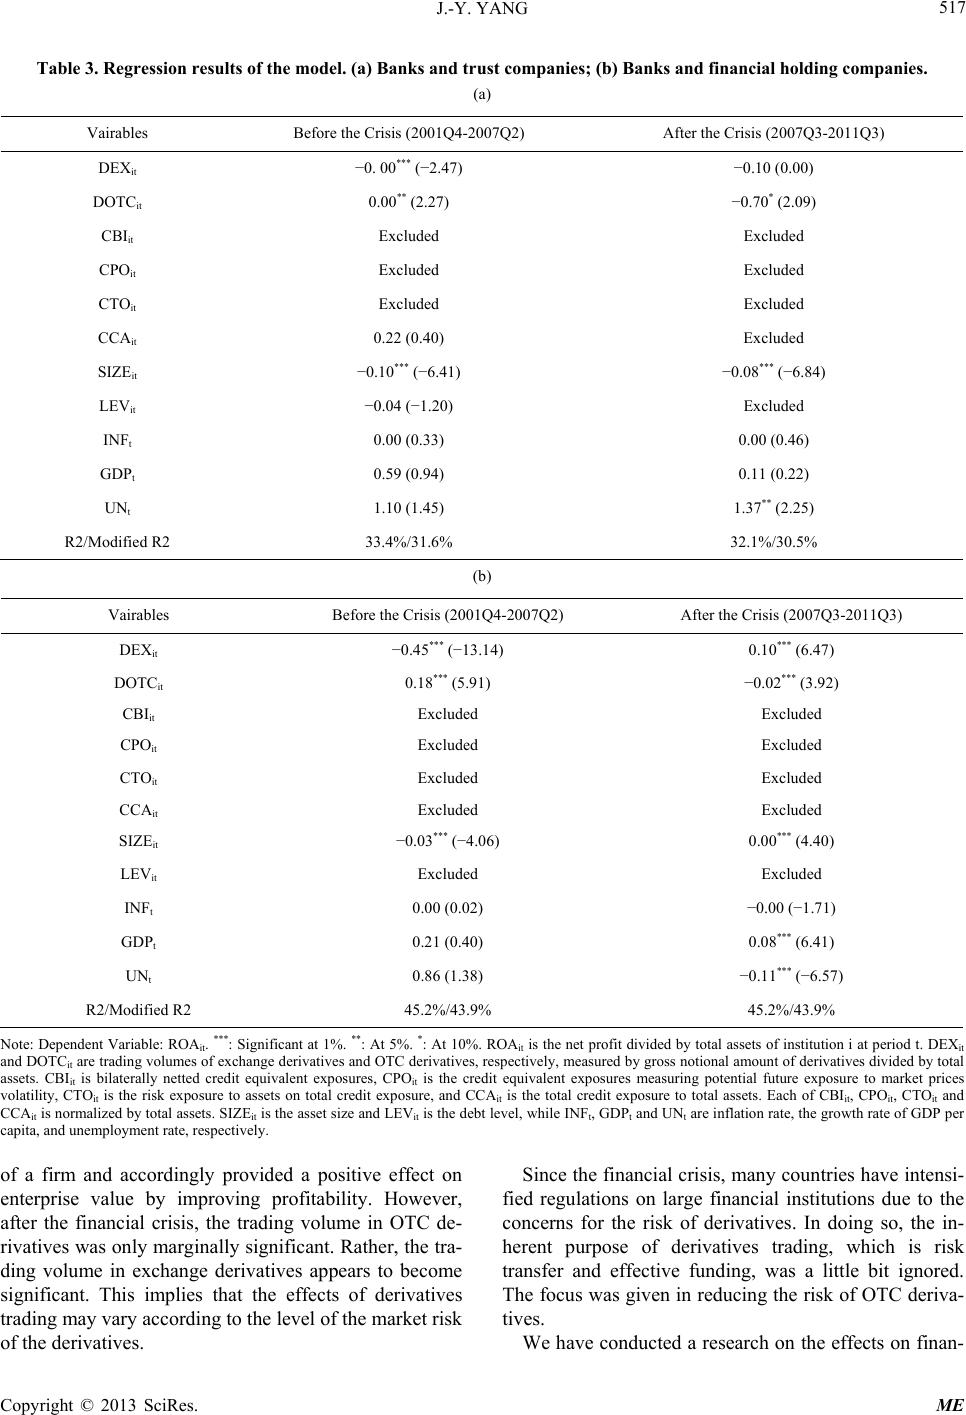 J.-Y. YANG 517 Table 3. Regression results of the model. (a) Banks and trust companies; (b) Banks and financial holding companies. (a) Vairables Before the Crisis (2001Q4-2007Q2) After the Crisis (2007Q3-2011Q3) DEXit −0. 00*** (−2.47) −0.10 (0.00) DOTCit 0.00** (2.27) −0.70* (2.09) CBIit Excluded Excluded CPOit Excluded Excluded CTOit Excluded Excluded CCAit 0.22 (0.40) Excluded SIZEit −0.10*** (−6.41) −0.08*** (−6.84) LEVit −0.04 (−1.20) Excluded INFt 0.00 (0.33) 0.00 (0.46) GDPt 0.59 (0.94) 0.11 (0.22) UNt 1.10 (1.45) 1.37** (2.25) R2/Modified R2 33.4%/31.6% 32.1%/30.5% (b) Vairables Before the Crisis (2001Q4-2007Q2) After the Crisis (2007Q3-2011Q3) DEXit −0.45*** (−13.14) 0.10*** (6.47) DOTCit 0.18*** (5.91) −0.02*** (3.92) CBIit Excluded Excluded CPOit Excluded Excluded CTOit Excluded Excluded CCAit Excluded Excluded SIZEit −0.03*** (−4.06) 0.00*** (4.40) LEVit Excluded Excluded INFt 0.00 (0.02) −0.00 (−1.71) GDPt 0.21 (0.40) 0.08*** (6.41) UNt 0.86 (1.38) −0.11*** (−6.57) R2/Modified R2 45.2%/43.9% 45.2%/43.9% Note: Dependent Variable: ROAit. ***: Significant at 1%. **: At 5%. *: At 10%. ROAit is the net profit divided by total assets of institution i at period t. DEXit and DOTCit are trading volumes of exchange derivatives and OTC derivatives, respectively, measured by gross notional amount of derivatives divided by total assets. CBIit is bilaterally netted credit equivalent exposures, CPOit is the credit equivalent exposures measuring potential future exposure to market prices volatility, CTOit is the risk exposure to assets on total credit exposure, and CCAit is the total credit exposure to total assets. Each of CBIit, CPOit, CTOit and CCAit is normalized by total assets. SIZEit is the asset size and LEVit is the debt level, while INFt, GDPt and UNt are inflation rate, the growth rate of GDP per capita, and unemployment rate, respectively. of a firm and accordingly provided a positive effect on enterprise value by improving profitability. However, after the financial crisis, the trading volume in OTC de- rivatives was only marginally significant. Rather, the tra- ding volume in exchange derivatives appears to become significant. This implies that the effects of derivatives trading may vary according to the level of the market risk of the derivatives. Since the financial crisis, many countries have intensi- fied regulations on large financial institutions due to the concerns for the risk of derivatives. In doing so, the in- herent purpose of derivatives trading, which is risk transfer and effective funding, was a little bit ignored. The focus was given in reducing the risk of OTC deriva- tives. We have conducted a reseach on the effects on finan- r Copyright © 2013 SciRes. ME 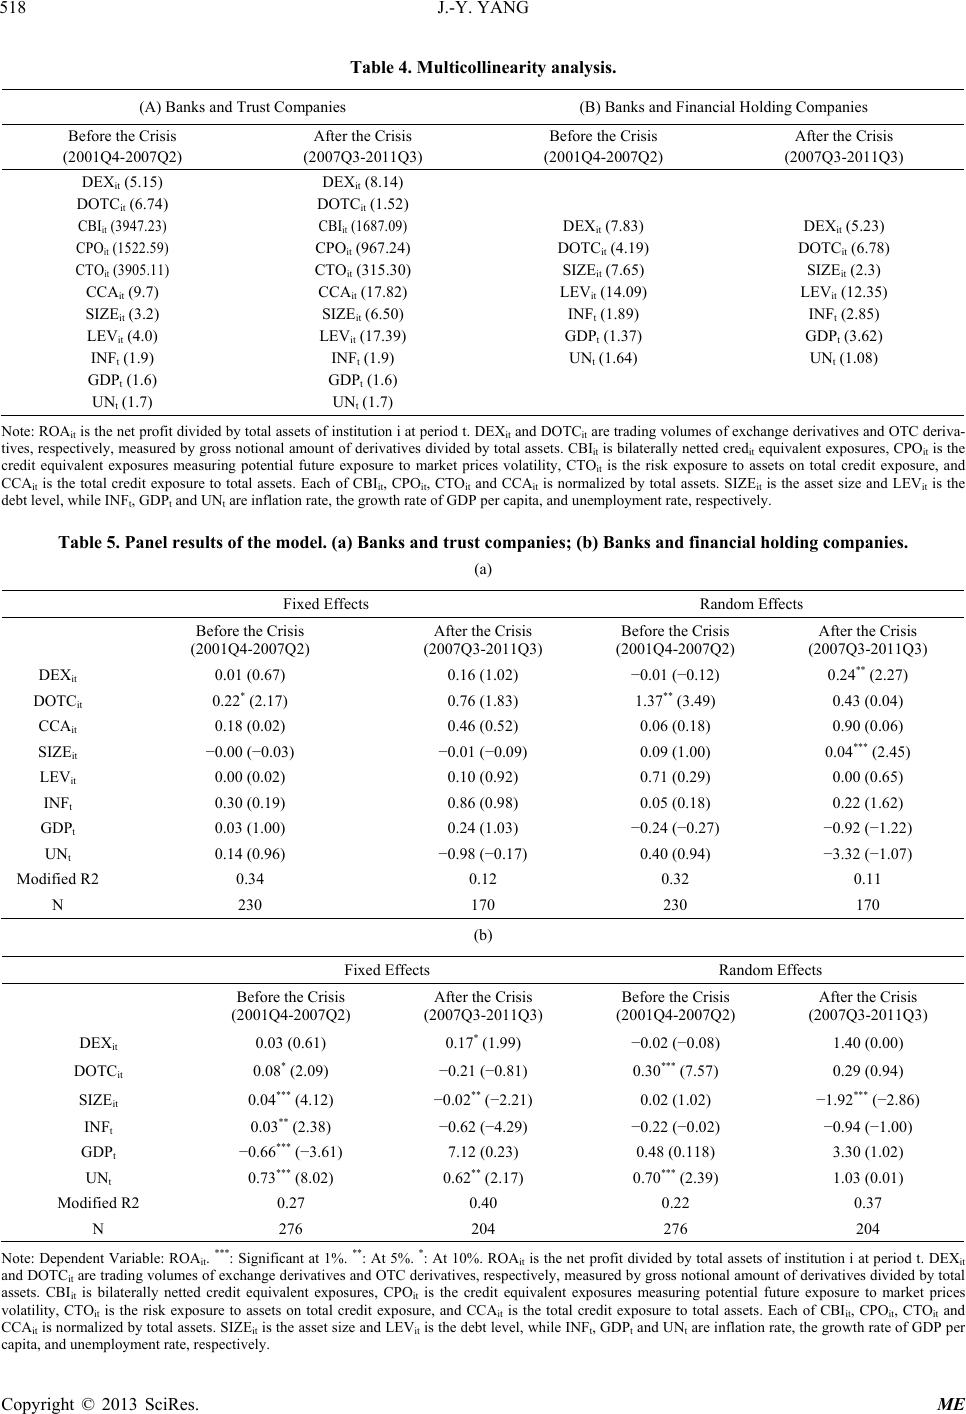 J.-Y. YANG 518 Table 4. Multicollinearity analysis. (A) Banks and Trust Companies (B) Banks and Financial Holding Companies Before the Crisis (2001Q4-2007Q2) After the Crisis (2007Q3-2011Q3) Before the Crisis (2001Q4-2007Q2) After the Crisis (2007Q3-2011Q3) DEXit (5.15) DOTCit (6.74) CBI it (3947.23) CPO it (1522.59) CTO it (3905.11) CCAit (9.7) SIZEit (3.2) LEVit (4.0) INFt (1.9) GDPt (1.6) UNt (1.7) DEXit (8.14) DOTCit (1.52) CBI it (1687.09) CPOit (967.24) CTOit (315.30) CCAit (17.82) SIZEit (6.50) LEVit (17.39) INFt (1.9) GDPt (1.6) UNt (1.7) DEXit (7.83) DOTCit (4.19) SIZEit (7.65) LEVit (14.09) INFt (1.89) GDPt (1.37) UNt (1.64) DEXit (5.23) DOTCit (6.78) SIZEit (2.3) LEVit (12.35) INFt (2.85) GDPt (3.62) UNt (1.08) Note: ROAit is the net profit divided by total assets of institution i at period t. DEXit and DOTCit are trading volumes of exchange derivatives and OTC deriva- tives, respectively, measured by gross notional amount of derivatives divided by total assets. CBIit is bilaterally netted credit equivalent exposures, CPOit is the credit equivalent exposures measuring potential future exposure to market prices volatility, CTOit is the risk exposure to assets on total credit exposure, and CCAit is the total credit exposure to total assets. Each of CBIit, CPOit, CTOit and CCAit is normalized by total assets. SIZEit is the asset size and LEVit is the debt level, while INFt, GDPt and UNt are inflation rate, the growth rate of GDP per capita, and unemployment rate, respectively. Table 5. Panel results of the model. (a) Banks and tr ust companies; (b) Banks and financial holding companies. (a) Fixed Effects Random Effects Before the Crisis (2001Q4-2007Q2) After the Crisis (2007Q3-2011Q3) Before the Crisis (2001Q4-2007Q2) After the Crisis (2007Q3-2011Q3) DEXit 0.01 (0.67) 0.16 (1.02) −0.01 (−0.12) 0.24** (2.27) DOTCit 0.22* (2.17) 0.76 (1.83) 1.37** (3.49) 0.43 (0.04) CCAit 0.18 (0.02) 0.46 (0.52) 0.06 (0.18) 0.90 (0.06) SIZEit −0.00 (−0.03) −0.01 (−0.09) 0.09 (1.00) 0.04*** (2.45) LEVit 0.00 (0.02) 0.10 (0.92) 0.71 (0.29) 0.00 (0.65) INFt 0.30 (0.19) 0.86 (0.98) 0.05 (0.18) 0.22 (1.62) GDPt 0.03 (1.00) 0.24 (1.03) −0.24 (−0.27) −0.92 (−1.22) UNt 0.14 (0.96) −0.98 (−0.17) 0.40 (0.94) −3.32 (−1.07) Modified R2 0.34 0.12 0.32 0.11 N 230 170 230 170 (b) Fixed Effects Random Effects Before the Crisis (2001Q4-2007Q2) After the Crisis (2007Q3-2011Q3) Before the Crisis (2001Q4-2007Q2) After the Crisis (2007Q3-2011Q3) DEXit 0.03 (0.61) 0.17* (1.99) −0.02 (−0.08) 1.40 (0.00) DOTCit 0.08* (2.09) −0.21 (−0.81) 0.30*** (7.57) 0.29 (0.94) SIZEit 0.04*** (4.12) −0.02** (−2.21) 0.02 (1.02) −1.92*** (−2.86) INFt 0.03** (2.38) −0.62 (−4.29) −0.22 (−0.02) −0.94 (−1.00) GDPt −0.66*** (−3.61) 7.12 (0.23) 0.48 (0.118) 3.30 (1.02) UNt 0.73*** (8.02) 0.62** (2.17) 0.70*** (2.39) 1.03 (0.01) Modified R2 0.27 0.40 0.22 0.37 N 276 204 276 204 Note: Dependent Variable: ROAit. ***: Significant at 1%. **: At 5%. *: At 10%. ROAit is the net profit divided by total assets of institution i at period t. DEXit and DOTCit are trading volumes of exchange derivatives and OTC derivatives, respectively, measured by gross notional amount of derivatives divided by total assets. CBIit is bilaterally netted credit equivalent exposures, CPOit is the credit equivalent exposures measuring potential future exposure to market prices volatility, CTOit is the risk exposure to assets on total credit exposure, and CCAit is the total credit exposure to total assets. Each of CBIit, CPOit, CTOit and CCAit is normalized by total assets. SIZEit is the asset size and LEVit is the debt level, while INFt, GDPt and UNt are inflation rate, the growth rate of GDP per apita, and unemployment rate, respectively. c Copyright © 2013 SciRes. ME 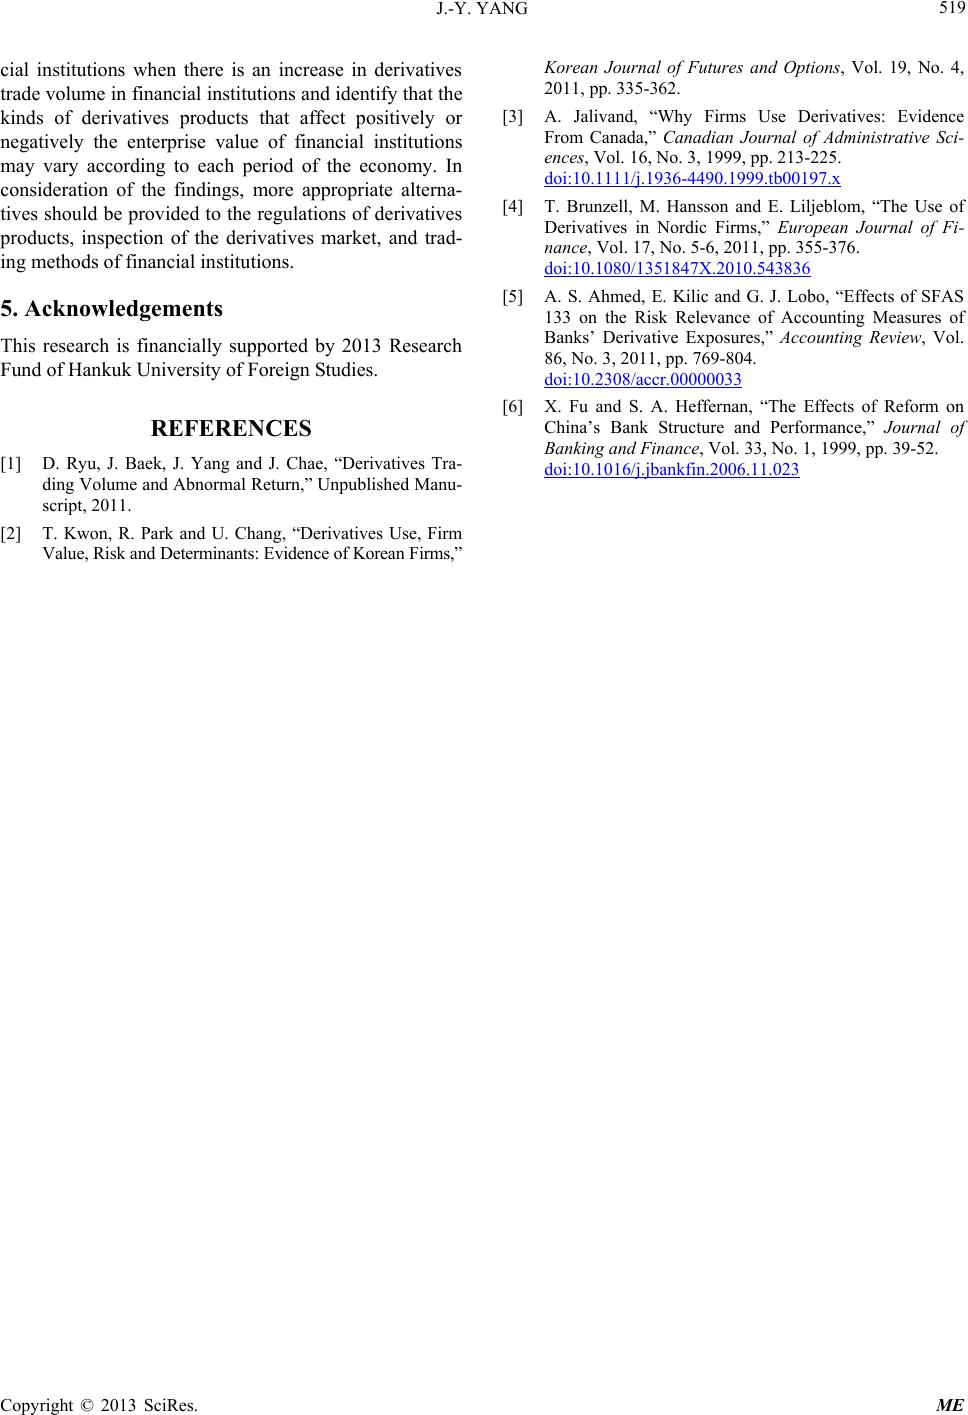 J.-Y. YANG 519 cial institutions when there is an increase in derivatives trade volume in financial institutions and identify that the kinds of derivatives products that affect positively or negatively the enterprise value of financial institutions may vary according to each period of the economy. In consideration of the findings, more appropriate alterna- tives should be provided to the regulations of derivatives products, inspection of the derivatives market, and trad- ing methods of financial institutions. 5. Acknowledgements This research is financially supported by 2013 Research Fund of Hankuk University of Foreign Studies. REFERENCES [1] D. Ryu, J. Baek, J. Yang and J. Chae, “Derivatives Tra- ding Volume and Abnormal Return,” Unpublished Manu- script, 2011. [2] T. Kwon, R. Park and U. Chang, “Derivatives Use, Firm Value, Risk and Determinants: Evidence of Korean Firms,” Korean Journal of Futures and Options, Vol. 19, No. 4, 2011, pp. 335-362. [3] A. Jalivand, “Why Firms Use Derivatives: Evidence From Canada,” Canadian Journal of Administrative Sci- ences, Vol. 16, No. 3, 1999, pp. 213-225. doi:10.1111/j.1936-4490.1999.tb00197.x [4] T. Brunzell, M. Hansson and E. Liljeblom, “The Use of Derivatives in Nordic Firms,” European Journal of Fi- nance, Vol. 17, No. 5-6, 2011, pp. 355-376. doi:10.1080/1351847X.2010.543836 [5] A. S. Ahmed, E. Kilic and G. J. Lobo, “Effects of SFAS 133 on the Risk Relevance of Accounting Measures of Banks’ Derivative Exposures,” Accounting Review, Vol. 86, No. 3, 2011, pp. 769-804. doi:10.2308/accr.00000033 [6] X. Fu and S. A. Heffernan, “The Effects of Reform on China’s Bank Structure and Performance,” Journal of Banking and Finance, Vol. 33, No. 1, 1999, pp. 39-52. doi:10.1016/j.jbankfin.2006.11.023 Copyright © 2013 SciRes. ME |