

Paper Menu >>
Journal Menu >>
 J. Biomedical Science and Engineering, 2010, 3, 1175-1181 doi:10.4236/jbise.2010.312153 Published Online December 2010 (http://www.SciRP.org/journal/jbise/ JBiSE ). Published Online December 2010 in SciRes. http://www.scirp.org/journal/JBiSE Chaotic features analysis of EEG signals during hallucination tasks of waterloo-stanford standard Elahe’ Yargholi1, Ali Motie Nasrabadi2 1Biomedical Engineering, Islamic Azad University, Science and Research Branch, Tehran, Iran; 2Biomedical Engineering, Shahed University, Tehran, Iran. Email: [email protected]; [email protected] Received 9 October 2010; revised 15 October 2010; accepted 20 October, 2010 ABSTRACT The present study looks carefully at EEG (Electroen- cephalograph) signals of people after the hypnosis inductions. Subjects were in three different categories of hypnotizability based on Waterloo-Stanford crite- ria; low, medium and high. Signals recorded during hallucination tasks of Waterloo-Stanford standard were applied to study the underlying dynamics of tasks and investigate the influence of hypnosis depth and concentration on recorded signals. To fulfill this objective, chaotic methods were employed; Higuchi dimension and correlation dimension. The results of the study indicate channels whose chaotic features are significantly different among people with various levels of hypnotizability. Moreover, a great consis- tency exists among channels involved in each task with brain’s dominant hemisphere and brain lobes’ functions. Another considerable result of the study was that the medium hypnotizable subjects were mostly affected by inductions and instructions of the hypnotizer (more than low or high hypnotizable sub- jects). The present study demonstrates a remarkable innovation in the analysis of hypnotic EEG; investi- gating the EEG signals of the hypnotized as doing hallucination tasks of Waterloo-Stanford standard orders. Keywords: Hypnosis; Hypnotizability; Waterloo-Stanford Standard; Fractal Dimension 1. INTRODUCTION To define hypno sis, it could be referred to a mental state produced through induction. Some people think of that as a kind of hypnoidal anesthesia while the various neu- rological researches reveal that hypnosis is a state of consciousness in which the individual enjoys the high degree of concentration [1] and as being isolated from peripheral environment, s/he is extremely suggestible. For the time being, hypnosis is applied in various fields such as medicine, psychology, dentistry and …. To make use of hypnosis as a therapeutic means, the patient should be appropriately receptive to hypnosis to get the required depth-point. It is the point at which the patient would take and accept the therapeutic instructions and could behave or act based on received inductions so that the therapy could be efficiently carried out. International standards are applied to assess/estimate the depth of hypnosis. According to the international standards, the individual goes under hypnosis, then the hypnotizer or- ders her/him to do a special task. How the patient fol- lows the order helps the hypnotizer to estimate the depth. This method may cause a hypnosis-depth decrease, so it is more beneficial to apply methods which estimate the hypnosis depth ordering the patient and this is what a great deal of researches aim at. In recent years due to advances in the field of bio- medical science, a large number of researches on hypno- sis and its impact upon different biosignals have been carried out. While under the influence of hypnosis, the body experiences physiological shifts such as the change in the rhythm of the heart, hypotension, resistance of peripheral vessels, electrical resistance of the skin, basic metabolism, body temperature, rate and depth of breath- ing et al. Hypnotic inductions can also change the tone of muscles and release of endocrine glands so it has led scholars to do various researches on hypnosis, applying EEG (Electroencephalograph), fMRI, PET, skin-resis- tance measurement, heart rate et al. since EEG signal recording, in comparison with other methods, is more readily accessible and easier to use, a lot of experts have applied it to hypnosis investigations. A wide variety of studies focused on the spectrum of the hypnotic EEG signals [1-17] while some recent re- searches were performed not applying the spectrum. Faber et al. studied the EEG signals during hand rising in both not hypnotized and hypnotized states [18]. Nas-  E. Yar gholi et al. / J. Biomedical Science and Engineering 3 (2010) 1175-1181 1176 rabadi studied EEG signals in different mental status (baseline, tasks, hypnosis) in people with different hyp- notizability [19]. Lee et al. applied fractal analysis to investigate EEG signals in both states of hypnotized and not hypnotized [20]. Solhjoo et al extracted fractal di- mensions of normal and hypnotic EEG signal to classify different mental tasks [21]. Baghdadi studied features extracted from hypnotic EEG using improved empirical mode decomposition (EMD) algorithm [22,23]. Ray investigated the difference between EEG signals’ fractal dimensions of lowly and highly hypnotizable subjects [2]. Behbahani analyzed the nature of hypnosis in right, left, back and frontal hemisphere in three groups of hypnotizable subjects by means of fuzzy similarity index method [24 ,25]. In researches carried out so far, different methods have been used to examine EEG signals of the hypno- tized subjects; However, most those researches applied the EEG signals during induction and investigating the EEG signals of the hypnotized as doing mental tasks (standard orders of Waterloo-Stanford) has not still been realized. Therefore in the pursuit of this purpose, the current study has been proposed. This study examined the recorded EEG signals of three groups of people whose hypnotizability leve ls ranged in low, medium and high hypnosis receptivity. The signal recording was done as they were doing the mental tasks (standard orders of Waterloo-Stanford) so, the impacts of hypnosis depth and concentration rate on recorded signals of these three groups of people -with different hypnotizability levels- could be properly examined and variation of dynamics throughout di fferent mental tasks would be investigat ed. The researches performed in the last 25 years indi- cates the existence of chaotic dynamics in both micro- scopic (neuron performance) and macroscopic levels (brain activities during sleep) [26,27], so obtaining the accurate and better results, through the application of chaotic methods to EEG investigation in the hypnotized could be expected. By the means of extracting and com- paring the chaotic features, the difference between the recorded EEG throughout the same activities but differ- ent hypnotizability depth-levels (low, medium and high) could be examined. Therefore in th is research, the exist- ing difference of the dominant dynamics in these three groups with different hypnotizability an d also the kind of differences have been studied. Should any distinction of the extracted chaotic features between these three hyp- notized groups observed, those differences could serve as the criteria for hypnosis-depth determination to exert appropriate inductions, EEG examination during hypno- sis provides the data for studying hypnosis stages and the transfer from one stage to another. 2. MATERIALS For the required data in the study, Nasrabadi data base [19] used. The data were obtained according to 20-10 standard consisting of 19 electrodes. The subjects of the study included 33 male participants with age range of 32 ± 6. The sampling was taken at 256 Hz. The subjects all featured in left-hemisphere dominancy. Being right- handed (writing with right hand) was the criterion to recognize the subjects as left-hemisphere dominants. The signal recording time was the same for all (16 pm-20 pm). Signal recording were taken twice and in 2 different situations: once in a state of being relaxed with their eyes closed-baseline signal- and for the second time, the recording was taken at the state of being hypnotized. To examine the shifts in the level of hypnosis, EEG sig- nals are required to be recorded under the state of hyp- nosis. To do so, following the whole stages of Water- loo-Stanford standard, a 45-minute audio file was pro- vided, the same audio file was utilized for hypnosis in- duction in all the subjects and there was no change in speech tone. So, all the subjects were placed under the equal circumstances. The first 15 minutes of audio file was assigned to the hypnosis induction. It starts includ- ing an individual- conscious and in normal state, then in order to determine the hypnotizability score, the partici- pant is asked to do 12 different tasks as the following respectively: 1) Hand lowering (ideomotors), 2) Moving hands together (ideomotors), 3) Experience of mosquito (hallucination), 4) Taste experience (hallucination), 5) Arm rigidity (challenge), 6) Dream (memory), 7) Arm immobilization (challenge), 8) Age regressi on (mem ory), 9) Music hallucination ( hall u ci nati on), 10) Negative vi sual (hall ucination), 11) Posthypnotic automatic writing (memory) and 12) Amnesia (memory). When tasks-performance ends, the scores of hypno- tizability and the depth of hypnosis are de termined based on each individual performance [28,29]. The EEG sig- nals of all electrodes have been recorded throughout induction and all tasks. In present research EEG signals of hallucination were chosen to investigate. 3. METHOD Parameters that represent chaotic behavior may be di- vided to two categories. The first category indicates dy- namic behavior. Maximum Lyapunov Exponent (MLE) is of this category. These parameters state how the sys- tem behaves oh the nearby trajectories. The second cat- Copyright © 2010 SciRes. JBiSE 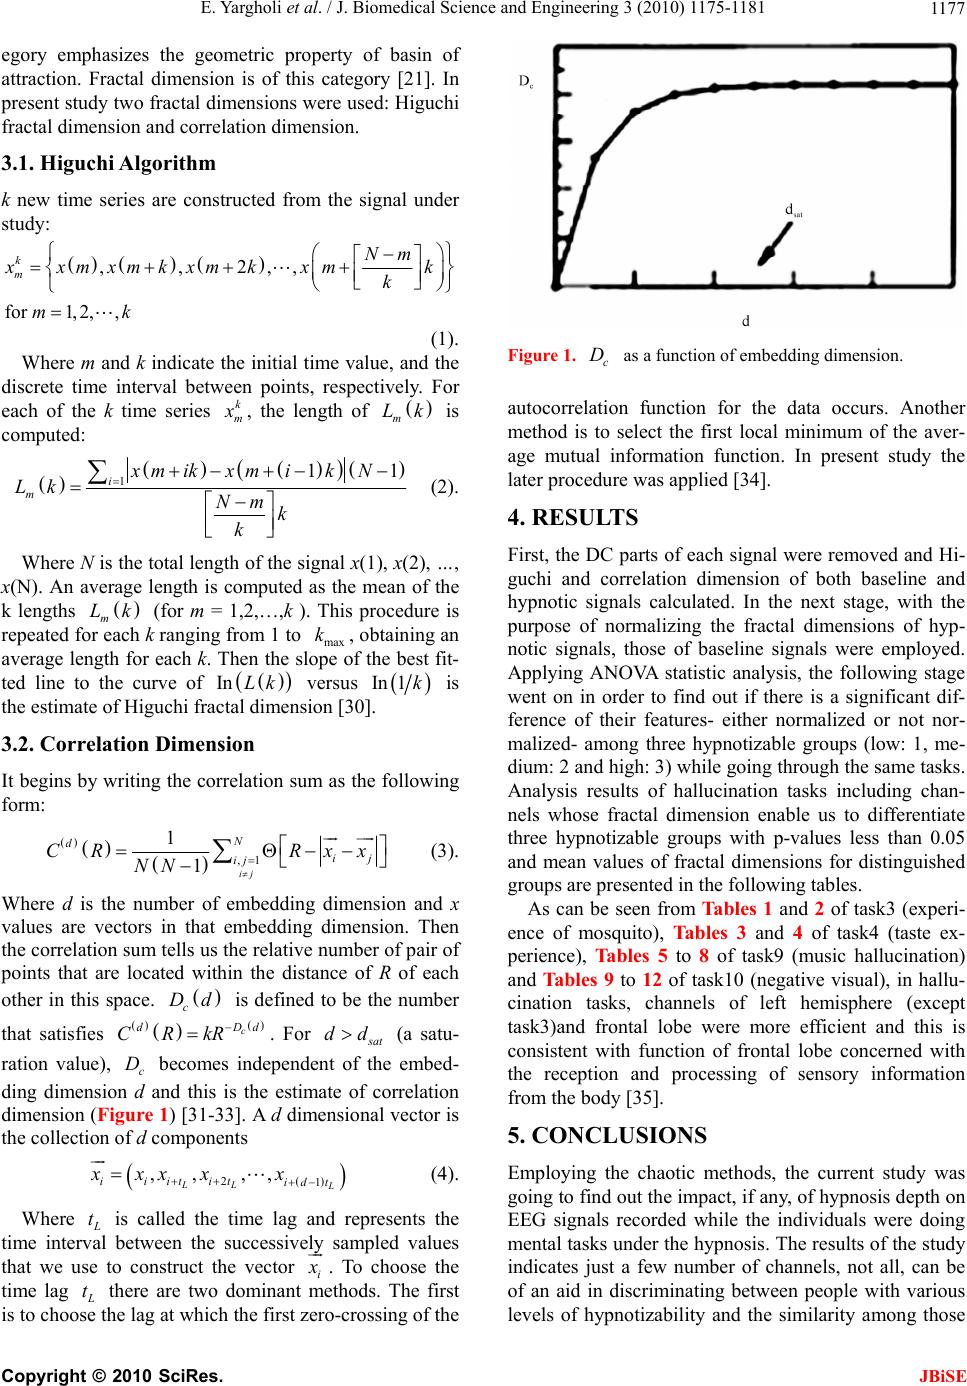 E. Yar gholi et al. / J. Biomedical Science and Engineering 3 (2010) 1175-1181 1177 egory emphasizes the geometric property of basin of attraction. Fractal dimension is of this category [21]. In present study two fractal dimensions were used: Higuchi fractal dimension and correlation dimension. 3.1. Higuchi Algorithm k new time series are constructed from the signal under study: ,,2,, for 1,2,, k mNm x xm xm kxmkxmk k mk (1). Where m and k indicate the initial time value, and the discrete time interval between points, respectively. For each of the k time series k m x , the length of m Lk is computed: 111 i m xm ikxmikN Lk Nm k k (2). Where N is the to tal length of the signal x(1), x(2), …, x(N). An average length is computed as the mean of the k lengths (for m = 1,2,…,k ). This procedure is repeated for each k ranging from 1 to max , obtaining an average length for each k. Then the slope of th e best fit- ted line to the curve of versus m Lk k In Lk In1 k is the estimate of Higuchi fractal dimension [30]. 3.2. Correlation Dimension It begins by writing the correlation sum as the following form: ,1 1 1ij N dij ij CR Rxx NN (3). Where d is the number of embedding dimension and x values are vectors in that embedding dimension. Then the correlation sum tells us the relative number of pair of points that are located within the distance of R of each other in this space. is defined to be the number that satisfies c Dd c D d dRCRk . For s at dd (a satu- ration value), becomes independent of the embed- ding dimension d and this is the estimate of correlation dimension (Figure 1) [31-33]. A d dimensional vector is the collection of d components c D 21 ,, ,, LL L iiitit id t xxxxx (4). Where L t is called the time lag and represents the time interval between the successively sampled values that we use to construct the vector i x . To choose the time lag L t there are two dominant methods. The first is to choose the lag at which the first zero-crossing of the Figure 1. as a function of embedding dimension. c D autocorrelation function for the data occurs. Another method is to select the first local minimum of the aver- age mutual information function. In present study the later procedure was applied [34]. 4. RESULTS First, the DC parts of each signal were removed and Hi- guchi and correlation dimension of both baseline and hypnotic signals calculated. In the next stage, with the purpose of normalizing the fractal dimensions of hyp- notic signals, those of baseline signals were employed. Applying ANOVA statistic analysis, the following stage went on in order to find out if there is a significant dif- ference of their features- either normalized or not nor- malized- among three hypnotizable groups (low: 1, me- dium: 2 and high: 3) while going through the same tasks. Analysis results of hallucination tasks including chan- nels whose fractal dimension enable us to differentiate three hypnotizable groups with p-values less than 0.05 and mean values of fractal dimensions for distinguished groups are presented in the following tables. As can be seen from Ta bles 1 and 2 of task3 (experi- ence of mosquito), Tables 3 and 4 of task4 (taste ex- perience), Tables 5 to 8 of task9 (music hallucination) and Table s 9 to 12 of task10 (negative visual), in hallu- cination tasks, channels of left hemisphere (except task3)and frontal lobe were more efficient and this is consistent with function of frontal lobe concerned with the reception and processing of sensory information from the body [35]. 5. CONCLUSIONS Employing the chaotic methods, the current study was going to find out the impact, if any, of hypnosis depth on EEG signals recorded while the individuals were doing mental tasks under the hypnosis. The results of the study indicates just a few number of channels, not all, can be of an aid in discriminating between people with various levels of hypnotizability and the similarity among those Copyright © 2010 SciRes. JBiSE 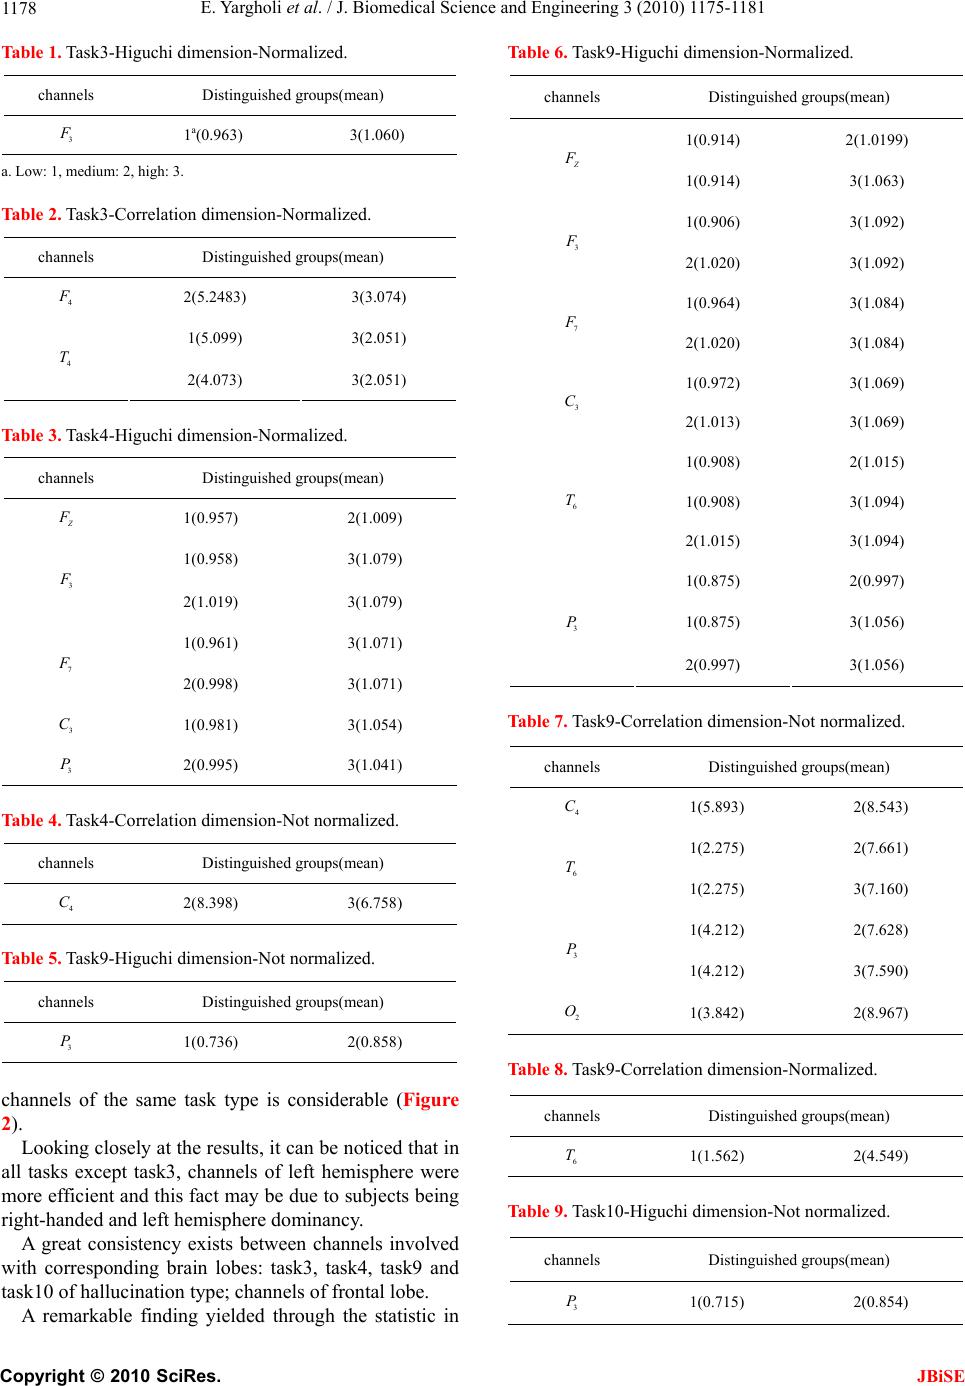 E. Yar gholi et al. / J. Biomedical Science and Engineering 3 (2010) 1175-1181 1178 Table 1. Task3-Higuchi dimension-Normalized. channels Distinguished groups(mean) 3 F 1a(0.963) 3(1.060) a. Low: 1, medium: 2, high : 3 . Table 2. Task3-Correlation dimension-Normalized. channels Distinguished groups(mean) 4 F 2(5.2483) 3(3.074) 1(5.099) 3(2.051) 4 T 2(4.073) 3(2.051) Table 3. Task4-Higuchi dimension-Normalized. channels Distinguished groups(mean) Z F 1(0.957) 2(1.009) 1(0.958) 3(1.079) 3 F 2(1.019) 3(1.079) 1(0.961) 3(1.071) 7 F 2(0.998) 3(1.071) 3 C 1(0.981) 3(1.054) 3 P 2(0.995) 3(1.041) Table 4. Task4-Correlation dimension-Not normalized. channels Distinguished groups(mean) 4 C 2(8.398) 3(6.758) Table 5. Task9-Higuchi dimension-Not normalized. channels Distinguished groups(mean) 3 P 1(0.736) 2(0.858) channels of the same task type is considerable (Figure 2). Looking closely at the results, it can be noticed that in all tasks except task3, channels of left hemisphere were more efficient and this fact may be due to subjects being right-handed and left hemisphere dominancy. A great consistency exists between channels involved with corresponding brain lobes: task3, task4, task9 and task10 of hallucination type; channels of frontal lobe. A remarkable finding yielded through the statistic in Table 6. Task9-Higuchi dimension-Normalized. channels Distinguished groups(mean) 1(0.914) 2(1.0199) Z F 1(0.914) 3(1.063) 1(0.906) 3(1.092) 3 F 2(1.020) 3(1.092) 1(0.964) 3(1.084) 7 F 2(1.020) 3(1.084) 1(0.972) 3(1.069) 3 C 2(1.013) 3(1.069) 1(0.908) 2(1.015) 1(0.908) 3(1.094) 6 T 2(1.015) 3(1.094) 1(0.875) 2(0.997) 1(0.875) 3(1.056) 3 P 2(0.997) 3(1.056) Table 7. Task9-Correlation dimension-Not normalized. channels Distinguished groups(mean) 4 C 1(5.893) 2(8.543) 1(2.275) 2(7.661) 6 T 1(2.275) 3(7.160) 1(4.212) 2(7.628) 3 P 1(4.212) 3(7.590) 2 O 1(3.842) 2(8.967) Table 8. Task9-Correlation dimension-Normalized. channels Distinguished groups(mean) 6 T 1(1.562) 2(4.549) Table 9. Task10-Higuchi dimension-Not normalized. channels Distinguished groups(mean) 3 P 1(0.715) 2(0.854) Copyright © 2010 SciRes. JBiSE 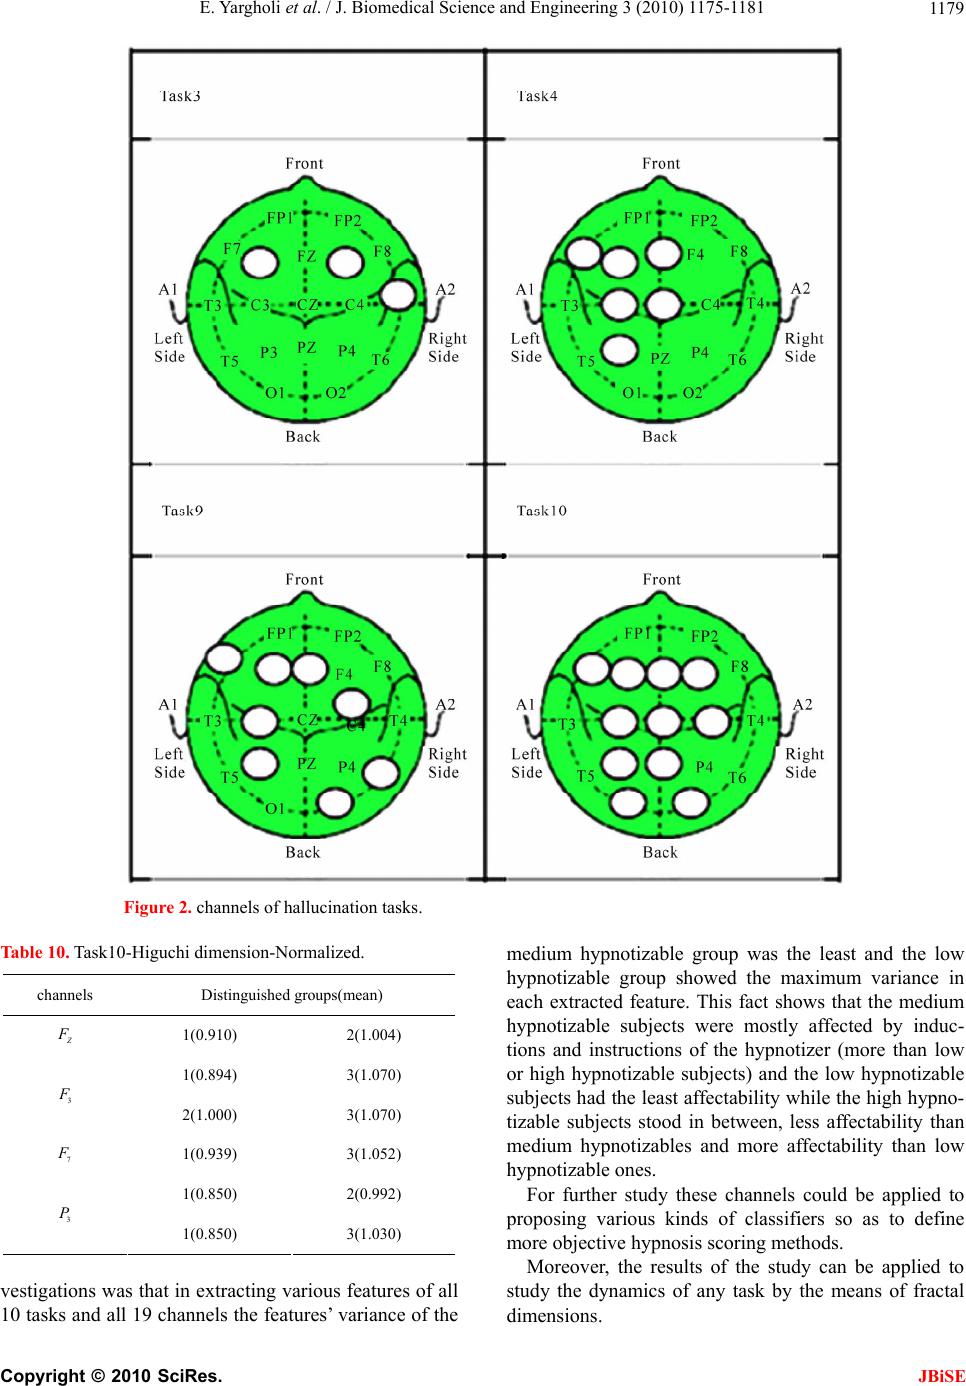 E. Yar gholi et al. / J. Biomedical Science and Engineering 3 (2010) 1175-1181 Copyright © 2010 SciRes. JBiSE 1179 Figure 2. channels of hallucination tasks. Table 10. Task10-Higuchi dimension-Normalized. channels Distinguished groups(mean) Z F 1(0.910) 2(1.004) 1(0.894) 3(1.070) 3 F 2(1.000) 3(1.070) 7 F 1(0.939) 3(1.052) 1(0.850) 2(0.992) 3 P 1(0.850) 3(1.030) vestigations was that in ex tracting various features of all 10 tasks and all 19 channels the features’ variance of the medium hypnotizable group was the least and the low hypnotizable group showed the maximum variance in each extracted feature. This fact shows that the medium hypnotizable subjects were mostly affected by induc- tions and instructions of the hypnotizer (more than low or high hypnotizable subjects) and the low hypnotizable subjects had the least affectability while the high hypno- tizable subjects stood in between, less affectability than medium hypnotizables and more affectability than low hypnotizable ones. For further study these channels could be applied to proposing various kinds of classifiers so as to define more objective hypnosis scoring methods. Moreover, the results of the study can be applied to study the dynamics of any task by the means of fractal dimensions. 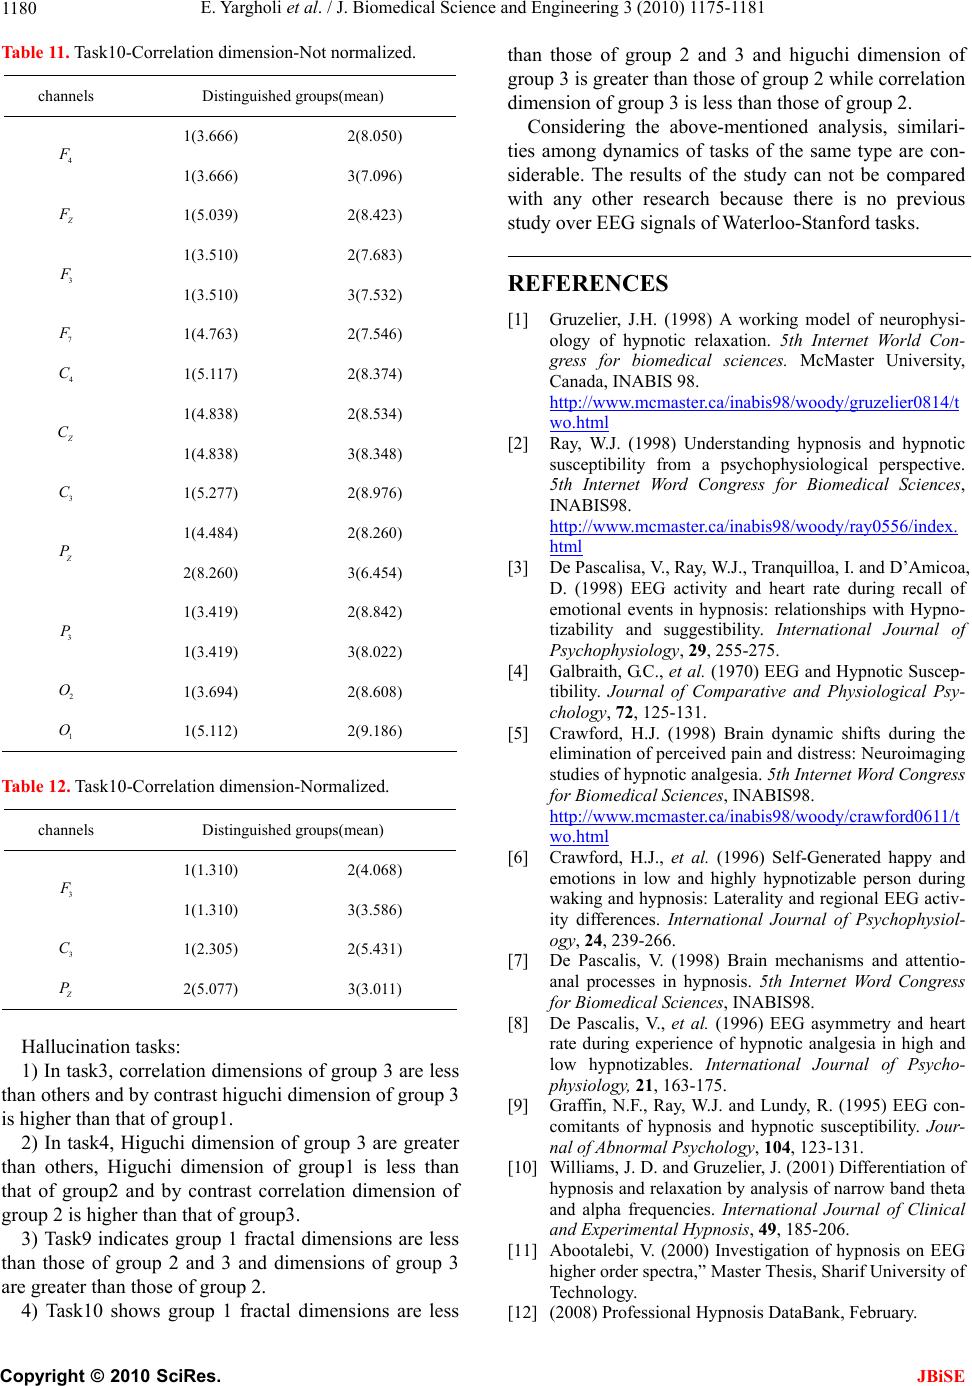 E. Yar gholi et al. / J. Biomedical Science and Engineering 3 (2010) 1175-1181 1180 Table 11. Task10-Correlation dimension-Not normalized. channels Distinguished groups(mean) 1(3.666) 2(8.050) 4 F 1(3.666) 3(7.096) Z F 1(5.039) 2(8.423) 1(3.510) 2(7.683) 3 F 1(3.510) 3(7.532) 7 F 1(4.763) 2(7.546) 4 C 1(5.117) 2(8.374) 1(4.838) 2(8.534) Z C 1(4.838) 3(8.348) 3 C 1(5.277) 2(8.976) 1(4.484) 2(8.260) Z P 2(8.260) 3(6.454) 1(3.419) 2(8.842) 3 P 1(3.419) 3(8.022) 2 O 1(3.694) 2(8.608) 1 O 1(5.112) 2(9.186) Table 12. Task10-Correlation dimension-Normalized. channels Distinguished groups(mean) 1(1.310) 2(4.068) 3 F 1(1.310) 3(3.586) 3 C 1(2.305) 2(5.431) Z P 2(5.077) 3(3.011) Hallucination tasks: 1) In task3, correlation dimensions of group 3 are less than others and by contrast higuchi dimension of group 3 is higher than that of group1. 2) In task4, Higuchi dimension of group 3 are greater than others, Higuchi dimension of group1 is less than that of group2 and by contrast correlation dimension of group 2 is higher than that of group3. 3) Task9 indicates group 1 fractal dimensions are less than those of group 2 and 3 and dimensions of group 3 are greater than those of group 2. 4) Task10 shows group 1 fractal dimensions are less than those of group 2 and 3 and higuchi dimension of group 3 is greater than those of group 2 while correlation dimension of group 3 is less than those of group 2. Considering the above-mentioned analysis, similari- ties among dynamics of tasks of the same type are con- siderable. The results of the study can not be compared with any other research because there is no previous study over EEG signal s o f Wate rl oo -Sta nf or d tasks. REFERENCES [1] Gruzelier, J.H. (1998) A working model of neurophysi- ology of hypnotic relaxation. 5th Internet World Con- gress for biomedical sciences. McMaster University, Canada, INABIS 98. http://www.mcmaster.ca/inabis98/woody/gruzelier0814/t wo.html [2] Ray, W.J. (1998) Understanding hypnosis and hypnotic susceptibility from a psychophysiological perspective. 5th Internet Word Congress for Biomedical Sciences, INABIS98. http://www.mcmaster.ca/inabis98/woody/ray0556/index. html [3] De Pascalisa, V., Ray, W.J., Tranquilloa, I. and D’Amicoa, D. (1998) EEG activity and heart rate during recall of emotional events in hypnosis: relationships with Hypno- tizability and suggestibility. International Journal of Psychophysiology, 29, 255-275. [4] Galbraith, G.C., et al. (1970) EEG and Hypnotic Suscep- tibility. Journal of Comparative and Physiological Psy- chology, 72, 125-131. [5] Crawford, H.J. (1998) Brain dynamic shifts during the elimination of perceived pain and distress: Neuroimaging studies of hypnotic analgesia. 5th Internet Word Congress for Biomedical Sciences, INABIS98. http://www.mcmaster.ca/inabis98/woody/crawford0611/t wo.html [6] Crawford, H.J., et al. (1996) Self-Generated happy and emotions in low and highly hypnotizable person during waking and hypnosis: Laterality and regional EEG activ- ity differences. International Journal of Psychophysiol- ogy, 24, 239-266. [7] De Pascalis, V. (1998) Brain mechanisms and attentio- anal processes in hypnosis. 5th Internet Word Congress for Biomedical Sciences, INABIS98. [8] De Pascalis, V., et al. (1996) EEG asymmetry and heart rate during experience of hypnotic analgesia in high and low hypnotizables. International Journal of Psycho- physiology, 21, 163-175. [9] Graffin, N.F., Ray, W.J. and Lundy, R. (1995) EEG con- comitants of hypnosis and hypnotic susceptibility. Jour- nal of Abnormal Psychology, 104, 123-131. [10] Williams, J. D. and Gruzelier, J. (2001) Differentiation of hypnosis and relaxation by analysis of narrow band theta and alpha frequencies. International Journal of Clinical and Experimental Hypnosis, 49, 185-206. [11] Abootalebi, V. (2000) Investigation of hypnosis on EEG higher order spectra,” Master Thesis, Sharif University of Technology. [12] (2008) Professional Hypnosis DataBank, February. Copyright © 2010 SciRes. JBiSE  E. Yar gholi et al. / J. Biomedical Science and Engineering 3 (2010) 1175-1181 Copyright © 2010 SciRes. JBiSE 1181 http://www.altor.org [13] Lubar, J.F., Gordon, D.M., Harrist, R.S., et al. (1991) EEG correlates of hypnotic susceptibility based upon fast fourier power spectral analysis. Biofeedback and Self- Regulation, 16, 75-80. [14] Brady, B. and Stevens, L. (2000) Binaural-beat induced theta EEG activity and hypnotic susceptibility, American Journal of Clinical Hypnosis, 43, 53-69. [15] Fingelkurts, A.A., Fingelkurts, A.A., Kallio, S. and Rev- onsuo, A. (2007) Cortex functional connectivity as a neurophysiological correlates of hypnosis: An EEG case study. Neuropsychologia, 45, 1452-1462. [16] Dumas, R.A. (2007) EEG Alpha-Hypnotizability correla- tions: A review . Psychophysiology, 14, 431-438. [17] White, D., Ciorciari, J., Carbis, C. and Liley, D. (2009) EEG correlates of virtual reality hypnosis. International Journal of Clinical and Experimental Hypnosis, 57, 94-116. [18] Faber, P.L., Gianotti, L.R.R., Wohlgemuth, P. and Leh- mann, D. (2000) Frequency domain EEG source loca- tions during arm levitation under hypnosis: a pilot study. ISBET 2000, Millennium,Frankfurt on the Main, Ger- many. [19] Nasrabadi, A.M. (2003) Quantitative and qualitative evaluation of consciousness variation and depth of hyp- nosis through intelligent processing of EEG signals. Ph.D. Thesis, Amir Kabir University. [20] Lee, J.S., et al. (2007) Fractal analysis of EEG in hypno- sis and its relationship with hypnotizability,” Interna- tional Journal of Clinical and Experimental Hypnosis, 55, 14-31. [21] Solhjoo, S., Nasrabadi, A.M. and Golpayegani, M.R.H. (2005) EEG-based mental task classification in hypno- tized and normal subjects. Engineering in Medicine and Biology 27th Annual Conference, Shanghai, China, Sep- tember 1-4, 2041-2043. [22] Baghdadi, G. (2008) Hypnosis depth determination, using empirical mode decomposition. Master Thesis, Shahed University. [23] Baghdadi, G. and Nasrabadi, A.M. (2009) Estimating final depth of hypnosis using extracted fractal features by EMD algorithms. 17th Iranian Conference on Electrical Engineering. Iran University of Science and Technology, Tehran, Iran. [24] Behbahani, S. (2008) Analysis of hypnotic EEG signals using fuzzy si milarity in dex. Master Thesis, Isl amic Azad University, Science and Research Branch. [25] Behbahani, S. and Nasrabadi, A.M. (2009) Application of fuzzy similarity index method in processing of hypnosis. Journal of Biomedical Science and Engineering, 2, 359-362. [26] Aihara, K. and Matsumuto, G. (1986) Chaotic oscilla- tions and bifurcations in squid giant axon. chaos, Man- chester University Press. [27] Babloyantz, A., Salazar, J.M. and Nicolis, C. (1985) Evidence of chaotic dynamics of brain activity during the sleep cycle. Physics Letter A, 111, 152-156. [28] Bowers, K.S. (1998) Waterloo-Stanford group scale of hypnotic susceptibility, Form C: manual and response booklet. International Journal of Clinical Hypnosis, 46, 250-268. [29] Krisch, I., et al. (1998) Experimental scoring for the Wa- terloo-Stanford group scale. International Journal of Clinical Hypnosis, 46, 269-279. [30] Nasrabadi, A.M., Hashemi Golpaygani, M.R., Khalil- zadeh, M.A. and Sharifi, A. (2003) Comparision between linear and nonlinear EEG signal processing during dif- ferent mental activies. Scientific Journal of Amirkabir A, 55, 592-600. [31] Hillborn, R.C. (2001) Chaos and nonlinear dynamics. 2nd Edition, Oxford University Press, 379-381. [32] Grassberger, P. and Procaccia, I. (1983) Characterization of strange attractors. Physical Review Letters, 50, 346-349. [33] Grassberger, P. and Procaccia, I. (1983) Measuring the strangeness of strange attractors. Physica D, 9, 189-208. [34] Fraser, A.M. and Swinney, H.L. (1986) Independent co- ordinates for strange attractors from mutual information, Physical Review A, 33, 1134-1140. [35] Netter, F.H. (1983) The Ciba collection of medical illus- trations, Volume 1: Nervous System; Part 1: Anatomy and Physiology. CIBA Limited, West Caldwell. |