

Paper Menu >>
Journal Menu >>
 Materials Sciences and Applications, 2013, 4, 471-477 http://dx.doi.org/10.4236/msa.2013.48057 Published Online August 2013 (http://www.scirp.org/journal/msa) Copyright © 2013 SciRes. MSA 471 A Comparison of Bending Properties for Cellular Core Sandwich Panels Li Yang1, Ola Harrysson2, Harvey West2, Denis Cormier3 1Department of Industrial Engineering, University of Louisville, Louisville, USA; 2Department of Industrial & Systems Engineering, North Carolina State University, Raleigh, USA; 3Department of Industrial & Systems Engineering, Rochester Institute of Technology, Rochester, USA. Email: [email protected] Received May 15th, 2013; revised June 21st, 2013; accepted July 2nd, 2013 Copyright © 2013 Li Yang et al. This is an open access article distributed under the Creative Commons Attribution License, which permits unrestricted use, distribution, and reproduction in any medium, provided the original work is properly cited. ABSTRACT In this study, various sandwich panel structures with different reticulate lattice core geometries were designed and then fabricated in titanium via the electron beam melting (EBM) process. Bending tests were performed on the titanium sam- ples, and mechanical properties such as modulus, bending strength, and energy absorption were evaluated. Different failure mechanisms were observed, and it was found that sandwich structures with auxetic cores exhibited more homo- geneous deflection and bending compliance compared with other structures. It was also demonstrated that properties of auxetic sandwich structures can be tailored using different cell structure geometries to suit the needs of a given design application. Furthermore, it was found that other 3D cellular sandwich structures can also exhibit high stiffness and strength, which is desirable in potential applications. Keywords: Auxetic Structure; Cellular Structure; Sandwich Panels; Electron Beam Melting; Bending Properties 1. Introduction 3D cellular structures possess unique advantages with respect to specific strength, specific modulus, and energy absorption at low densities. They are therefore promising for applications that require light weight (e.g. aerospace, automotive, etc.). Two-dimensional cellular structures and foams are frequently used as sandwich structure cores in order to provide increased bending and shearing stiffness as well as energy absorption ability [1]. Among the range of possible cellular geometries, aux- etic structures are of specific interest to researchers. Aux- etic structures exhibit negative Poisson’s ratio in one or more directions. These structures have been shown to exhibit significantly improved shear performance com- pared with regular structures [2-4]. According to the the- ory of elasticity, the shear modulus of negative Poisson’s ratio structures could become even larger than the bulk moduli, making the structures ideal for use in sandwich panel cores [5-7]. Furthermore, auxetic structures exhibit synclastic bending [8-9], which also favors their potential applications in curved sandwich panels and sandwich skins for various applications. Traditionally, auxetic structures have been fabricated through multi-step processes in which specific control over the cell geometry (i.e. strut sizes and angles) is quite difficult. The relatively recent emergence of polymer and metal additive manufacturing processes has given engi- neers the ability to fabricate parts with precise cellular geometries directly from the CAD models. It therefore has become possible to fabricate these structures and to compare their experimentally determined material prop- erties with predicted values. In the current study, sandwich structures with re-en- trant auxetic cores as well as several other 3D reticulate cellular core geometries were designed in CAD and then fabricated via Arcam’s electron beam melting (EBM) process. Mechanical properties pertinent to sandwich structure performance were measured, including stiffness, strength and energy absorption. A comparison of the bending properties between different auxetic core de- signs is provided to evaluate their potential in structural applications. 2. Structural Designs The unit cell of the 3D re-entrant lattice auxetic structure used in this study is shown in Figure 1(a) [10,11]. This auxetic structure is an orthotropic structure with direc- tions x and y exhibiting identical properties due to the 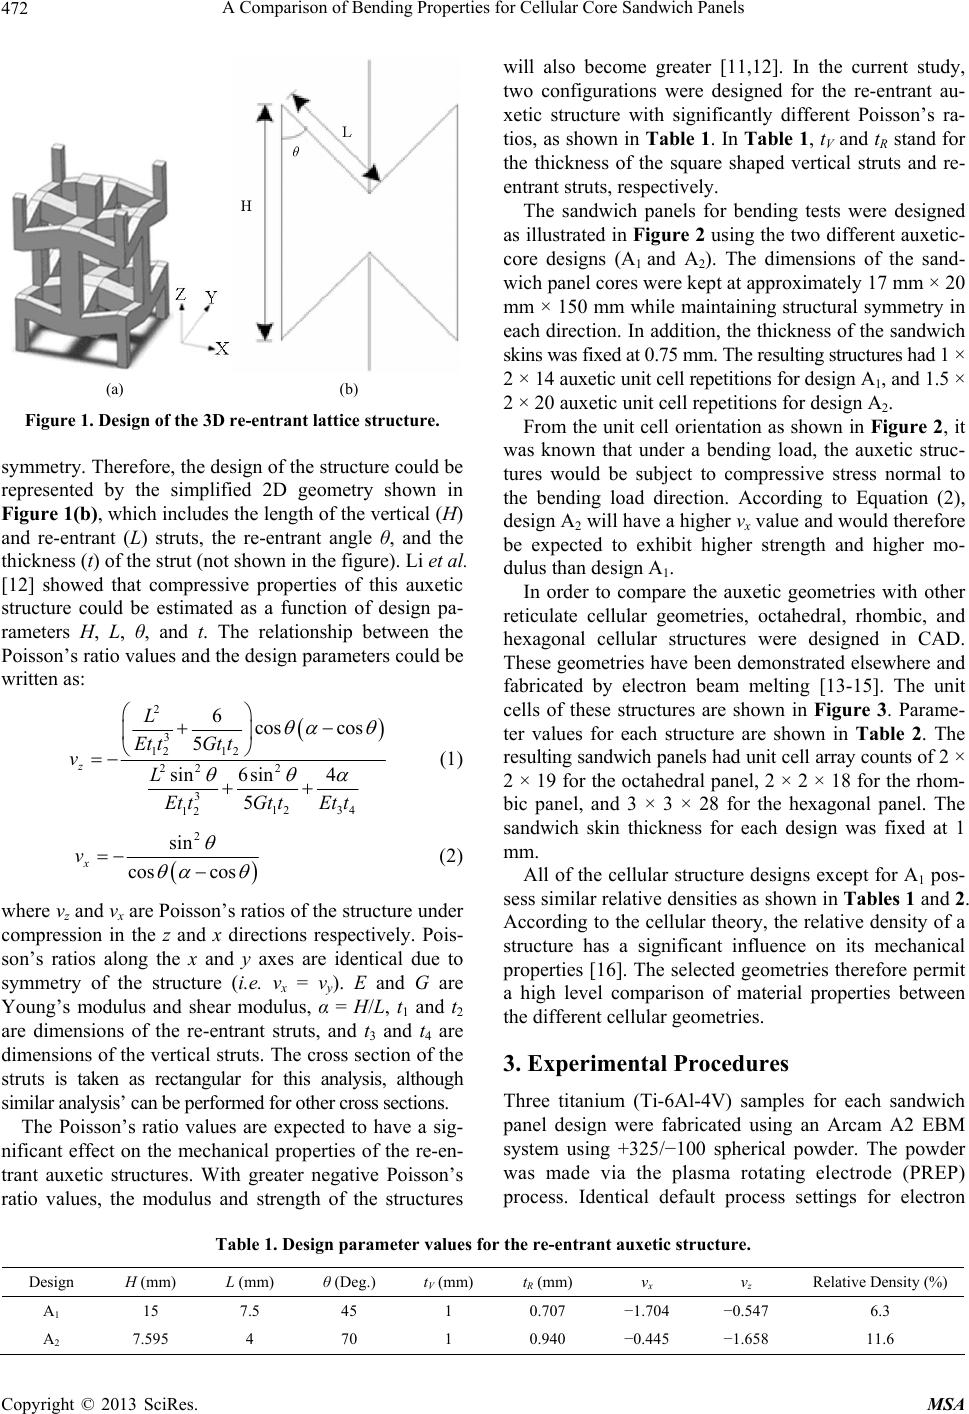 A Comparison of Bending Properties for Cellular Core Sandwich Panels Copyright © 2013 SciRes. MSA 472 (a) (b) Figure 1. Design of the 3D re-entrant lattice structure. symmetry. Therefore, the design of the structure could be represented by the simplified 2D geometry shown in Figure 1(b), which includes the length of the vertical (H) and re-entrant (L) struts, the re-entrant angle θ, and the thickness (t) of the strut (not shown in the figure). Li et al. [12] showed that compressive properties of this auxetic structure could be estimated as a function of design pa- rameters H, L, θ, and t. The relationship between the Poisson’s ratio values and the design parameters could be written as: 2 3 12 12 22 2 3 12 34 12 6cos cos 5 sin 6sin4 5 z L Gt t Et t vL Gt tEtt Et t (1) 2 sin cos cos x v (2) where νz and νx are Poisson’s ratios of the structure under compression in the z and x directions respectively. Pois- son’s ratios along the x and y axes are identical due to symmetry of the structure (i.e. νx = νy). E and G are Young’s modulus and shear modulus, α = H/L, t1 and t2 are dimensions of the re-entrant struts, and t3 and t4 are dimensions of the vertical struts. The cross section of the struts is taken as rectangular for this analysis, although similar analysis’ can be performed for other cross sections. The Poisson’s ratio values are expected to have a sig- nificant effect on the mechanical properties of the re-en- trant auxetic structures. With greater negative Poisson’s ratio values, the modulus and strength of the structures will also become greater [11,12]. In the current study, two configurations were designed for the re-entrant au- xetic structure with significantly different Poisson’s ra- tios, as shown in Table 1. In Table 1, tV and tR stand for the thickness of the square shaped vertical struts and re- entrant struts, respectively. The sandwich panels for bending tests were designed as illustrated in Figure 2 using the two different auxetic- core designs (A1 and A2). The dimensions of the sand- wich panel cores were kept at approximately 17 mm × 20 mm × 150 mm while maintaining structural symmetry in each direction. In addition, the thickness of the sandwich skins was fixed at 0.75 mm. The resulting structures had 1 × 2 × 14 auxetic unit cell repetitions for design A1, and 1.5 × 2 × 20 auxetic unit cell repetitions for design A2. From the unit cell orientation as shown in Figure 2, it was known that under a bending load, the auxetic struc- tures would be subject to compressive stress normal to the bending load direction. According to Equation (2), design A2 will have a higher νx value and would therefore be expected to exhibit higher strength and higher mo- dulus than design A1. In order to compare the auxetic geometries with other reticulate cellular geometries, octahedral, rhombic, and hexagonal cellular structures were designed in CAD. These geometries have been demonstrated elsewhere and fabricated by electron beam melting [13-15]. The unit cells of these structures are shown in Figure 3. Parame- ter values for each structure are shown in Table 2. The resulting sandwich panels had unit cell array counts of 2 × 2 × 19 for the octahedral panel, 2 × 2 × 18 for the rhom- bic panel, and 3 × 3 × 28 for the hexagonal panel. The sandwich skin thickness for each design was fixed at 1 mm. All of the cellular structure designs except for A1 pos- sess similar relative densities as shown in Ta ble s 1 and 2. According to the cellular theory, the relative density of a structure has a significant influence on its mechanical properties [16]. The selected geometries therefore permit a high level comparison of material properties between the different cellular geometries. 3. Experimental Procedures Three titanium (Ti-6Al-4V) samples for each sandwich panel design were fabricated using an Arcam A2 EBM system using +325/−100 spherical powder. The powder was made via the plasma rotating electrode (PREP) process. Identical default process settings for electron Table 1. Design parameter values for the re-entrant auxetic structure. Design H (mm) L (mm) θ (Deg.) tV (mm) tR (mm) νx νz Relative Density (%) A1 15 7.5 45 1 0.707 −1.704 −0.547 6.3 A2 7.595 4 70 1 0.940 −0.445 −1.658 11.6 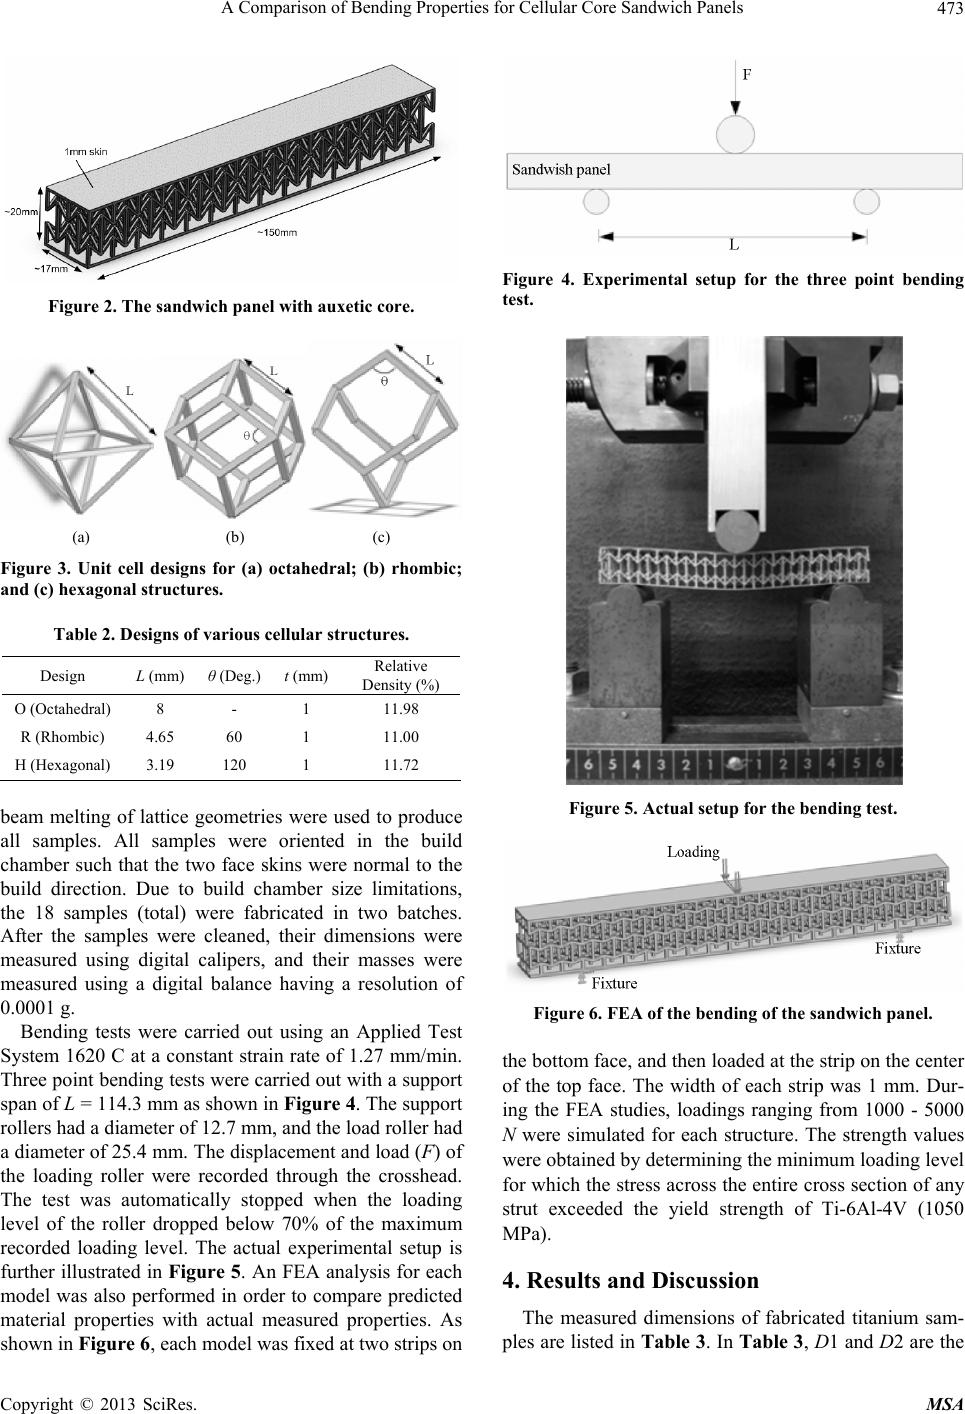 A Comparison of Bending Properties for Cellular Core Sandwich Panels Copyright © 2013 SciRes. MSA 473 Figure 2. The sandwich panel with auxetic core. (a) (b) (c) Figure 3. Unit cell designs for (a) octahedral; (b) rhombic; and (c) hexagonal structures. Table 2. Designs of various cellular structures. Design L (mm) θ (Deg.) t (mm) Relative Density (%) O (Octahedral) 8 - 1 11.98 R (Rhombic) 4.65 60 1 11.00 H (Hexagonal) 3.19 120 1 11.72 beam melting of lattice geometries were used to produce all samples. All samples were oriented in the build chamber such that the two face skins were normal to the build direction. Due to build chamber size limitations, the 18 samples (total) were fabricated in two batches. After the samples were cleaned, their dimensions were measured using digital calipers, and their masses were measured using a digital balance having a resolution of 0.0001 g. Bending tests were carried out using an Applied Test System 1620 C at a constant strain rate of 1.27 mm/min. Three point bending tests were carried out with a support span of L = 114.3 mm as shown in Figure 4. The support rollers had a diameter of 12.7 mm, and the load roller had a diameter of 25.4 mm. The displacement and load (F) of the loading roller were recorded through the crosshead. The test was automatically stopped when the loading level of the roller dropped below 70% of the maximum recorded loading level. The actual experimental setup is further illustrated in Figure 5. An FEA analysis for each model was also performed in order to compare predicted material properties with actual measured properties. As shown in Figure 6, each model was fixed at two strips on Figure 4. Experimental setup for the three point bending test. Figure 5. Actual setup for the bending test. Figure 6. FEA of the bending of the sandwich panel. the bottom face, and then loaded at the strip on the center of the top face. The width of each strip was 1 mm. Dur- ing the FEA studies, loadings ranging from 1000 - 5000 N were simulated for each structure. The strength values were obtained by determining the minimum loading level for which the stress across the entire cross section of any strut exceeded the yield strength of Ti-6Al-4V (1050 MPa). 4. Results and Discussion The measured dimensions of fabricated titanium sam- ples are listed in Tab le 3. In Table 3, D1 and D2 are the  A Comparison of Bending Properties for Cellular Core Sandwich Panels Copyright © 2013 SciRes. MSA 474 Table 3. Actual parameters of the samples made by EBM. Design D1 (mm) D2 (mm) L (mm) Mass (g) Relative Density (%) A1 20.405 ± 0.259 22.538 ± 0.125 148.675 ± 0.155 45.063 ± 2.688 14.87 ± 0.81 A2 19.829 ± 0.153 16.222 ± 0.029 150.334 ± 0.140 45.852 ± 1.504 21.40 ± 0.60 O 23.292 ± 0.116 17.052 ± 0.029 151.875 ± 0.125 48.646 ± 0.616 18.20 ± 0.22 R 19.668 ± 0.205 17.230 ± 0.039 144.848 ± 0.073 41.647 ± 1.965 19.15 ± 0.73 H 20.616 ± 0.106 17.729 ± 0.000 160.274 ± 0.076 52.112 ± 1.242 20.08 ± 0.38 overall thickness and width of the sandwich panels, and L is the total length. It could be seen that the dimensions of the samples were quite consistent, indicating stable process quality. The relative densities of the samples were significantly larger than 0.1 due to the existence of the surface skins. All the designs, except for A1, had measured relative densities close to 0.2. The thickness of the sandwich skins for auxetic de- signs A1 and A2 were around 0.75 mm, while the thick- ness of the skins for the other sandwich structures were very close to 1 mm. According to the classic theory of sandwich panels, skin thickness is the dominant factor for the performance of the structure. However, prelimi- nary FEA results with the designed structures showed that the skin thickness hada minimal effect on the bend- ing modulus of the sandwich panels. It is hypothesized that this is due to the very low relative density of the core structure which leads to large compliance that accom- modates local deflections of the two skin panels. Fur- thermore, preliminary study showed that for auxetic sand- wich structures, the dominant failure mode during bending was core shear, which is in turn determined by the geome- tries of individual struts rather than the surface skin. During bending, the upper region of the sandwich panel is subject to compressive stress, while the lower region is subject to tensile stress. For regular core struc- tures, compressive stresses result in lateral expansion. As a consequence, localized stress concentrations and poten- tial wrinkling on the face skins can be expected. Con- versely, auxetic structures with negative Poisson’s ratios exhibit lateral shrinkage (or inward movement) under compression and will therefore better accommodate ma- croscopic structural deformation. Figure 7(a) shows the auxetic sandwich panel defor- mation during testing, whereas Figure 7(b) shows the corresponding FEA simulation result. Figures 7(a) and (b) both show very little localized deformation during bending. Instead, the deflection is distributed along the length of the sandwich panel homogeneously. Whereas sandwich panels with foam cores typically fail via face yield, core shear, indentation, delamination and face wrinkle [5], the auxetic sandwich panels failed by frac- ture of vertical struts under the combination of bending and tension. Failure occurred at the vertical struts located roughly at the middle section between the loading roller and the support roller where the local deformation was at its maximum as seen in Figure 7(a). Because of the highly homogeneous distribution of deflection and stress, this auxetic sandwich structure could potentially be use- ful for applications such as structural beams. Since the vertical struts are subject to critical failure, new designs involving non-uniform strut sizes could be applied to fur- ther improve the structural performance. Figure 8 shows the deflection of the other sandwich structures in FEA simulation. Again, the tested titanium structures exhibited similar behavior as that predicted from the FEA studies. It is apparent that for octahedral, rhombic and hexagonal sandwiches, the stress distribu- tions, and therefore the deformation of the structures, was largely concentrated at the surface area where the structure was loaded. Upon failure, face yield was observ- ed for all three of these geometries. Table 4 shows the bending strength and modulus re- sults, as well as the total energy absorption for each type of structure. The results for rhombic and octahedral sam- ples showed an unusually high variation in maximum force and therefore, the strength and the total energy ab- sorption. It is noted that in order to produce comparable relative densities between sample geometries, the rhom- bic and octahedral samples had fewer unit cell repetitions through the thickness of the samples. It is surmised that the small number of unit cell repetitions through the thickness of the samples contributed to this elevated de- gree of variance. All the other type of structures showed relatively consistent properties. Comparing A1 and A2, it is apparent that A2 exhibited significantly higher strength and modulus, as predicted. With higher νz value, the modulus of A2 is about 7 times that of A1, while the strength of A2 had an approximately 200% increase compared with A1. On the other hand, design A1 exhibited significantly higher resilience com- pared with A2. The maximum deflection for A1 was al- most twice as much as that of A2. Although design A1 could withstand much greater deflection than A2, design A2absorbed a considerable amount of energy during the bending, as also shown in Table 4. The octahedral, rhombic, and hexagonal sandwich panels showed relatively high strength and modulus val- 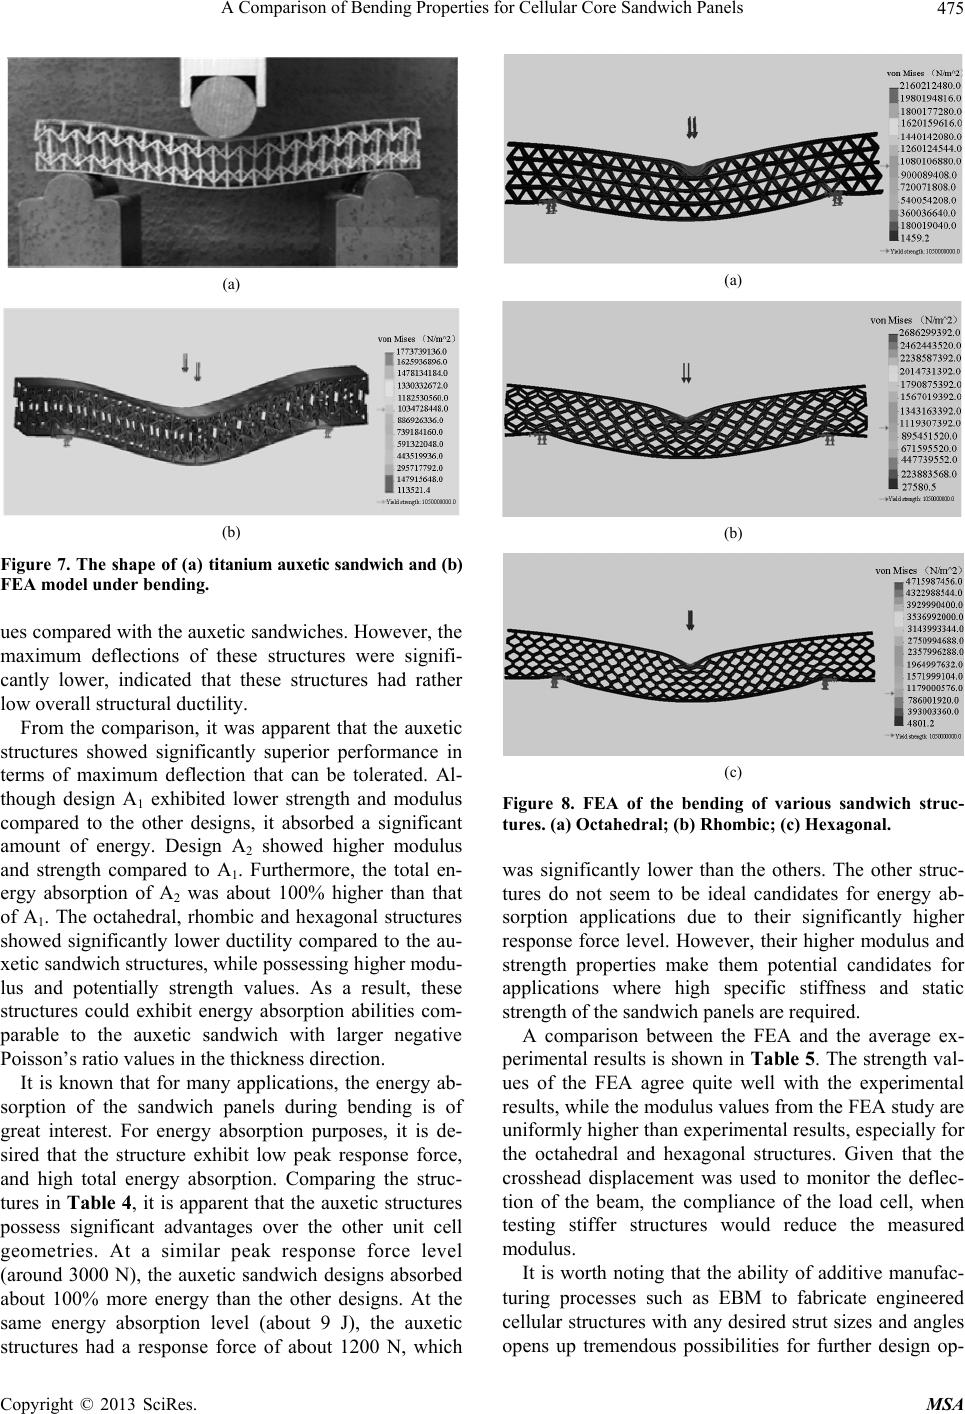 A Comparison of Bending Properties for Cellular Core Sandwich Panels Copyright © 2013 SciRes. MSA 475 (a) (b) Figure 7. The shape of (a) titanium auxetic sandwich and (b) FEA model under bending. ues compared with the auxetic sandwiches. However, the maximum deflections of these structures were signifi- cantly lower, indicated that these structures had rather low overall structural ductility. From the comparison, it was apparent that the auxetic structures showed significantly superior performance in terms of maximum deflection that can be tolerated. Al- though design A1 exhibited lower strength and modulus compared to the other designs, it absorbed a significant amount of energy. Design A2 showed higher modulus and strength compared to A1. Furthermore, the total en- ergy absorption of A2 was about 100% higher than that of A1. The octahedral, rhombic and hexagonal structures showed significantly lower ductility compared to the au- xetic sandwich structures, while possessing higher modu- lus and potentially strength values. As a result, these structures could exhibit energy absorption abilities com- parable to the auxetic sandwich with larger negative Poisson’s ratio values in the thickness direction. It is known that for many applications, the energy ab- sorption of the sandwich panels during bending is of great interest. For energy absorption purposes, it is de- sired that the structure exhibit low peak response force, and high total energy absorption. Comparing the struc- tures in Table 4, it is apparent that the auxetic structures possess significant advantages over the other unit cell geometries. At a similar peak response force level (around 3000 N), the auxetic sandwich designs absorbed about 100% more energy than the other designs. At the same energy absorption level (about 9 J), the auxetic structures had a response force of about 1200 N, which (a) (b) (c) Figure 8. FEA of the bending of various sandwich struc- tures. (a) Octahedral; (b) Rhombic; (c) Hexagonal. was significantly lower than the others. The other struc- tures do not seem to be ideal candidates for energy ab- sorption applications due to their significantly higher response force level. However, their higher modulus and strength properties make them potential candidates for applications where high specific stiffness and static strength of the sandwich panels are required. A comparison between the FEA and the average ex- perimental results is shown in Table 5 . The strength val- ues of the FEA agree quite well with the experimental results, while the modulus values from the FEA study are uniformly higher than experimental results, especially for the octahedral and hexagonal structures. Given that the crosshead displacement was used to monitor the deflec- tion of the beam, the compliance of the load cell, when testing stiffer structures would reduce the measured modulus. It is worth noting that the ability of additive manufac- turing processes such as EBM to fabricate engineered cellular structures with any desired strut sizes and angles opens up tremendous possibilities for further design op- 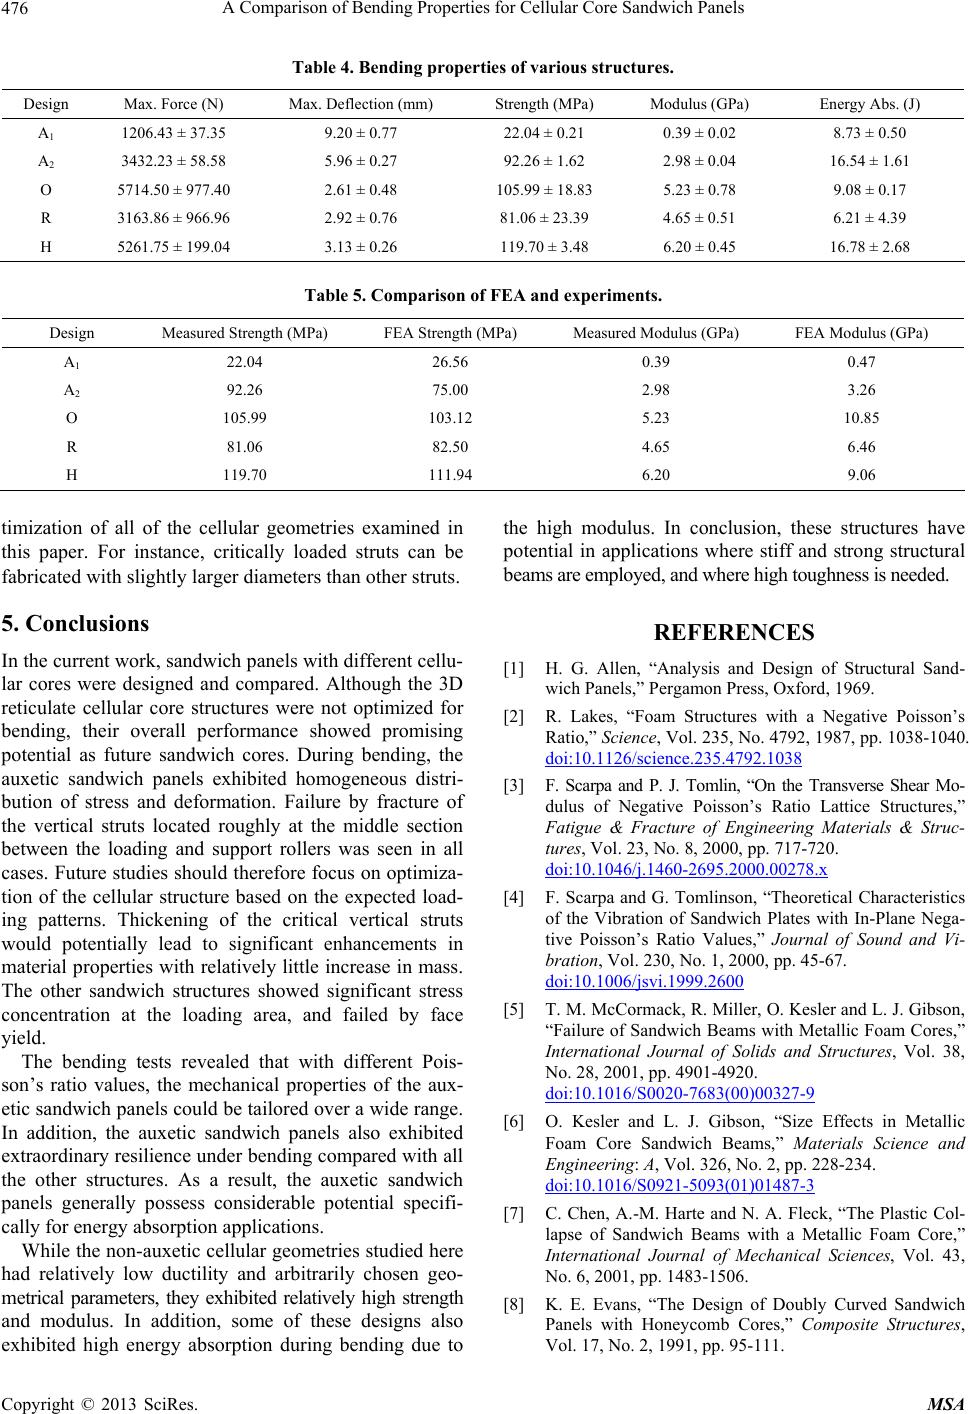 A Comparison of Bending Properties for Cellular Core Sandwich Panels Copyright © 2013 SciRes. MSA 476 Table 4. Bending properties of various struc tures. Design Max. Force (N) Max. Deflection (mm) Strength (MPa) Modulus (GPa) Energy Abs. (J) A1 1206.43 ± 37.35 9.20 ± 0.77 22.04 ± 0.21 0.39 ± 0.02 8.73 ± 0.50 A2 3432.23 ± 58.58 5.96 ± 0.27 92.26 ± 1.62 2.98 ± 0.04 16.54 ± 1.61 O 5714.50 ± 977.40 2.61 ± 0.48 105.99 ± 18.83 5.23 ± 0.78 9.08 ± 0.17 R 3163.86 ± 966.96 2.92 ± 0.76 81.06 ± 23.39 4.65 ± 0.51 6.21 ± 4.39 H 5261.75 ± 199.04 3.13 ± 0.26 119.70 ± 3.48 6.20 ± 0.45 16.78 ± 2.68 Table 5. Comparison of FEA and experiments. Design Measured Strength (MPa) FEA Strength (MPa) Measured Modulus (GPa) FEA Modulus (GPa) A1 22.04 26.56 0.39 0.47 A2 92.26 75.00 2.98 3.26 O 105.99 103.12 5.23 10.85 R 81.06 82.50 4.65 6.46 H 119.70 111.94 6.20 9.06 timization of all of the cellular geometries examined in this paper. For instance, critically loaded struts can be fabricated with slightly larger diameters than other struts. 5. Conclusions In the current work, sandwich panels with different cellu- lar cores were designed and compared. Although the 3D reticulate cellular core structures were not optimized for bending, their overall performance showed promising potential as future sandwich cores. During bending, the auxetic sandwich panels exhibited homogeneous distri- bution of stress and deformation. Failure by fracture of the vertical struts located roughly at the middle section between the loading and support rollers was seen in all cases. Future studies should therefore focus on optimiza- tion of the cellular structure based on the expected load- ing patterns. Thickening of the critical vertical struts would potentially lead to significant enhancements in material properties with relatively little increase in mass. The other sandwich structures showed significant stress concentration at the loading area, and failed by face yield. The bending tests revealed that with different Pois- son’s ratio values, the mechanical properties of the aux- etic sandwich panels could be tailored over a wide range. In addition, the auxetic sandwich panels also exhibited extraordinary resilience under bending compared with all the other structures. As a result, the auxetic sandwich panels generally possess considerable potential specifi- cally for energy absorption applications. While the non-auxetic cellular geometries studied here had relatively low ductility and arbitrarily chosen geo- metrical parameters, they exhibited relatively high strength and modulus. In addition, some of these designs also exhibited high energy absorption during bending due to the high modulus. In conclusion, these structures have potential in applications where stiff and strong structural beams are employed, and where high toughness is needed. REFERENCES [1] H. G. Allen, “Analysis and Design of Structural Sand- wich Panels,” Pergamon Press, Oxford, 1969. [2] R. Lakes, “Foam Structures with a Negative Poisson’s Ratio,” Science, Vol. 235, No. 4792, 1987, pp. 1038-1040. doi:10.1126/science.235.4792.1038 [3] F. Scarpa and P. J. Tomlin, “On the Transverse Shear Mo- dulus of Negative Poisson’s Ratio Lattice Structures,” Fatigue & Fracture of Engineering Materials & Struc- tures, Vol. 23, No. 8, 2000, pp. 717-720. doi:10.1046/j.1460-2695.2000.00278.x [4] F. Scarpa and G. Tomlinson, “Theoretical Characteristics of the Vibration of Sandwich Plates with In-Plane Nega- tive Poisson’s Ratio Values,” Journal of Sound and Vi- bration, Vol. 230, No. 1, 2000, pp. 45-67. doi:10.1006/jsvi.1999.2600 [5] T. M. McCormack, R. Miller, O. Kesler and L. J. Gibson, “Failure of Sandwich Beams with Metallic Foam Cores,” International Journal of Solids and Structures, Vol. 38, No. 28, 2001, pp. 4901-4920. doi:10.1016/S0020-7683(00)00327-9 [6] O. Kesler and L. J. Gibson, “Size Effects in Metallic Foam Core Sandwich Beams,” Materials Science and Engineering: A, Vol. 326, No. 2, pp. 228-234. doi:10.1016/S0921-5093(01)01487-3 [7] C. Chen, A.-M. Harte and N. A. Fleck, “The Plastic Col- lapse of Sandwich Beams with a Metallic Foam Core,” International Journal of Mechanical Sciences, Vol. 43, No. 6, 2001, pp. 1483-1506. [8] K. E. Evans, “The Design of Doubly Curved Sandwich Panels with Honeycomb Cores,” Composite Structures, Vol. 17, No. 2, 1991, pp. 95-111.  A Comparison of Bending Properties for Cellular Core Sandwich Panels Copyright © 2013 SciRes. MSA 477 [9] R. Lakes, “Advances in Negative Poisson’s Ratio Materi- als,” Advanced Materials, Vol. 5, No. 4, 1993, pp. 293- 296. doi:10.1002/adma.19930050416 [10] L. Yang, D. Cormier, H. West and K. Knowlson, “Non- Stochastic Ti-6Al-4V Foam Structure That Shows Nega- tive Poisson’s Ratios,” Materials Science and Engineer- ing: A, Vol. 558, 2012, pp. 579-585. doi:10.1016/j.msea.2012.08.053 [11] L. Yang, O. Harrysson, D. Cormier and H. West, “Com- pressive Properties of Ti-6Al-4V Auxetic Mesh Struc- tures Made by EBM Process,” Acta Materialia, Vol. 60, No. 8, 2012, pp. 3370-3379. doi:10.1016/j.actamat.2012.03.015 [12] L. Yang, O. Harrysson, D. Cormier and H. West, “Mod- eling of the Uniaxial Compression of a 3D Periodic Re- Entrant Honeycomb Structure,” Journal of Materials Sci- ence, Vol. 48, No. 4, 2012, pp. 1413-1422. doi:10.1007/s10853-012-6892-2 [13] O. L. A. Harrysson, O. Cansizoglu, D. J. Marcellin-Little, D. Cormier and H. West II, “Direct Metal Fabrication of Titanium Implants with Tailored Materials and Mechani- cal Properties Using Electron Beam Melting Technol- ogy,” Materials Science and Engineering: C, Vol. 28, No. 3, 2008, pp. 366-373. doi:10.1016/j.msec.2007.04.022 [14] O. Cansizoglu, O, Harrysson, D. Cormier, H. West and T. Mahale, “Properties of Ti-6Al-4V Non-Stochastic Lattice Structures Fabricated via Electron Beam Melting,” Mate- rials Science and Engineering: A, Vol. 492, No. 1-2, 2008, pp. 468-474. [15] O. Cansizoglu, “Mesh Structures with Tailored Properties and Applications in Hip Stems,” Ph.D. Dissertation, North Carolina State University, Raleigh, 2008. [16] L. J. Gibson, “Cellular Solids: Structure and Properties,” 2nd Edition, Cambridge University Press, New York, 1997. |