

Paper Menu >>
Journal Menu >>
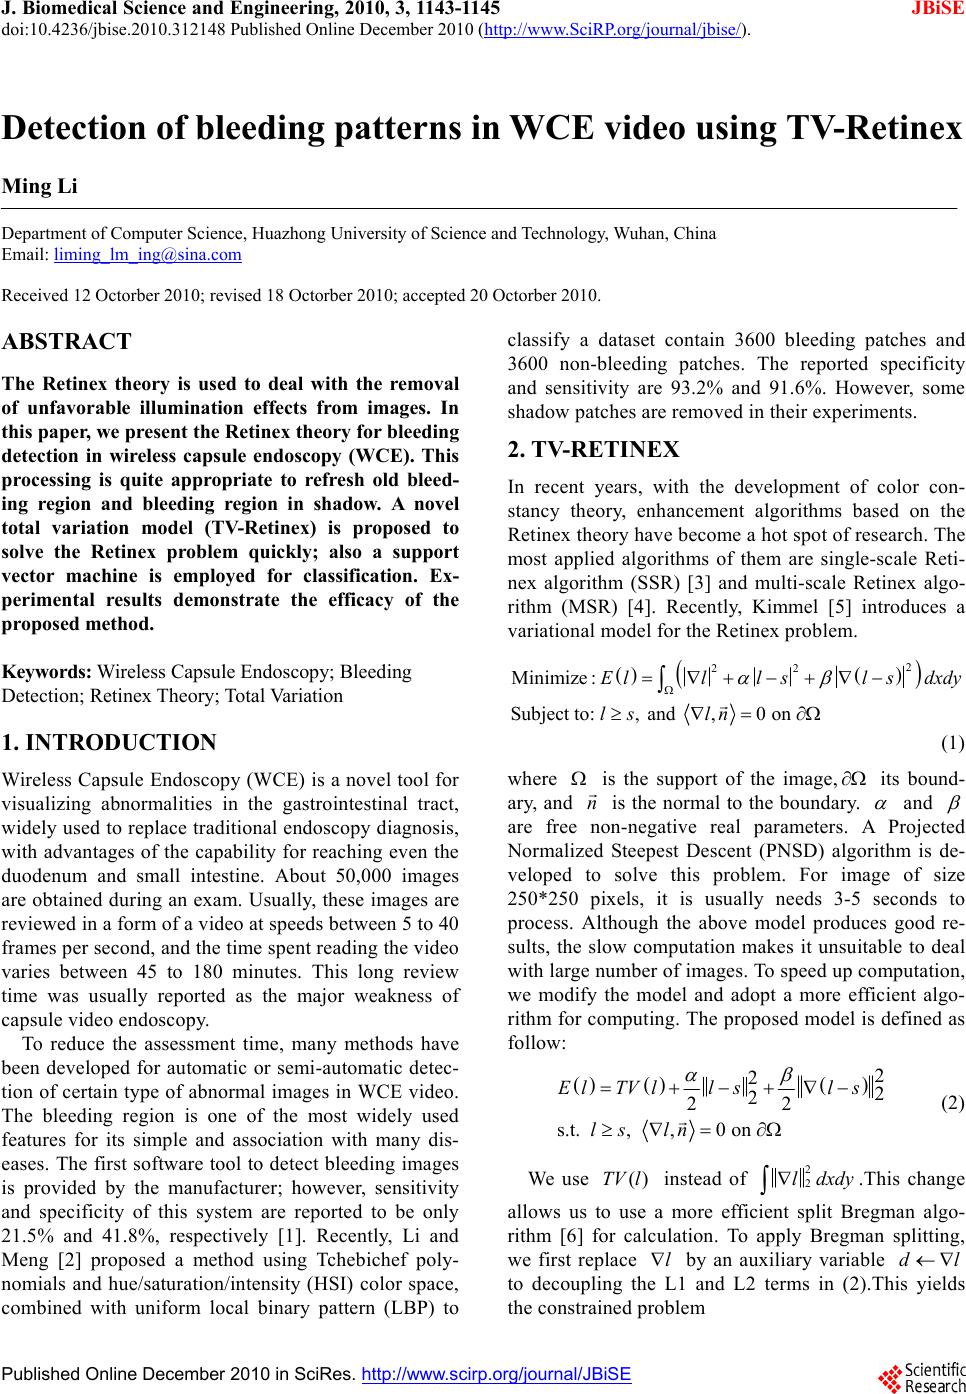 J. Biomedical Science and Engineering, 2010, 3, 1143-1145 doi:10.4236/jbise.2010.312148 Published Online December 2010 (http://www.SciRP.org/journal/jbise/ JBiSE ). Published Online December 2010 in SciRes. http://www.scirp.org/journal/JBiSE Detection of bleeding patterns in WCE video using TV-Retinex Ming Li Department of Computer Science, Huazhong University of Science and Technology, Wuhan, China Email: [email protected] Received 12 Octorber 2010; revised 18 Octorber 2010; accepted 20 Octorber 2010. ABSTRACT The Retinex theory is used to deal with the removal of unfavorable illumination effects from images. In this paper, we present the Retinex theory for bleeding detection in wireless capsule endoscopy (WCE). This processing is quite appropriate to refresh old bleed- ing region and bleeding region in shadow. A novel total variation model (TV-Retinex) is proposed to solve the Retinex problem quickly; also a support vector machine is employed for classification. Ex- perimental results demonstrate the efficacy of the proposed method. Keywords: Wireless Capsule Endoscopy; Bleeding Detection; Retinex Theory; Total Variation 1. INTRODUCTION Wireless Capsule Endoscopy (WCE) is a novel tool for visualizing abnormalities in the gastrointestinal tract, widely used to replace traditional endoscopy diagnosis, with advantages of the capability for reaching even the duodenum and small intestine. About 50,000 images are obtained during an exam. Usually, these images are reviewed in a form of a video at sp eeds between 5 to 40 frames per second, and the time spent reading the video varies between 45 to 180 minutes. This long review time was usually reported as the major weakness of capsule video endoscopy. To reduce the assessment time, many methods have been developed for automatic or semi-automatic detec- tion of certain type of abnormal images in WCE video. The bleeding region is one of the most widely used features for its simple and association with many dis- eases. The first software tool to detect bleeding images is provided by the manufacturer; however, sensitivity and specificity of this system are reported to be only 21.5% and 41.8%, respectively [1]. Recently, Li and Meng [2] proposed a method using Tchebichef poly- nomials and hue/saturation/intensity (HSI) color space, combined with uniform local binary pattern (LBP) to classify a dataset contain 3600 bleeding patches and 3600 non-bleeding patches. The reported specificity and sensitivity are 93.2% and 91.6%. However, some shadow patches are removed in their experiments. 2. TV-RETINEX In recent years, with the development of color con- stancy theory, enhancement algorithms based on the Retinex theory have become a hot spot of research. The most applied algorithms of them are single-scale Reti- nex algorithm (SSR) [3] and multi-scale Retinex algo- rithm (MSR) [4]. Recently, Kimmel [5] introduces a varia t ional mo d e l fo r th e R eti nex problem. 2 22 Minimize: Subject to: , and ,0 on Elllsl sdxdy ls ln (1) where is the support of the image, its bound- ary, and n is the normal to the boundary. and are free non-negative real parameters. A Projected Normalized Steepest Descent (PNSD) algorithm is de- veloped to solve this problem. For image of size 250*250 pixels, it is usually needs 3-5 seconds to process. Although the above model produces good re- sults, the slow computation makes it unsuitable to deal with large number of images. To speed up computation, we modify the model and adopt a more efficient algo- rithm for computing. The proposed model is defined as follow: 2 22 2 22 s.t. , ,0 on ElTVllsl s ls ln (2) We use instead of ()TV l2 2 ldxdy .This change allows us to use a more efficient split Bregman algo- rithm [6] for calculation. To apply Bregman splitting, we first replace l by an auxiliary variable dl to decoupling the L1 and L2 terms in (2).This yields the constrained problem 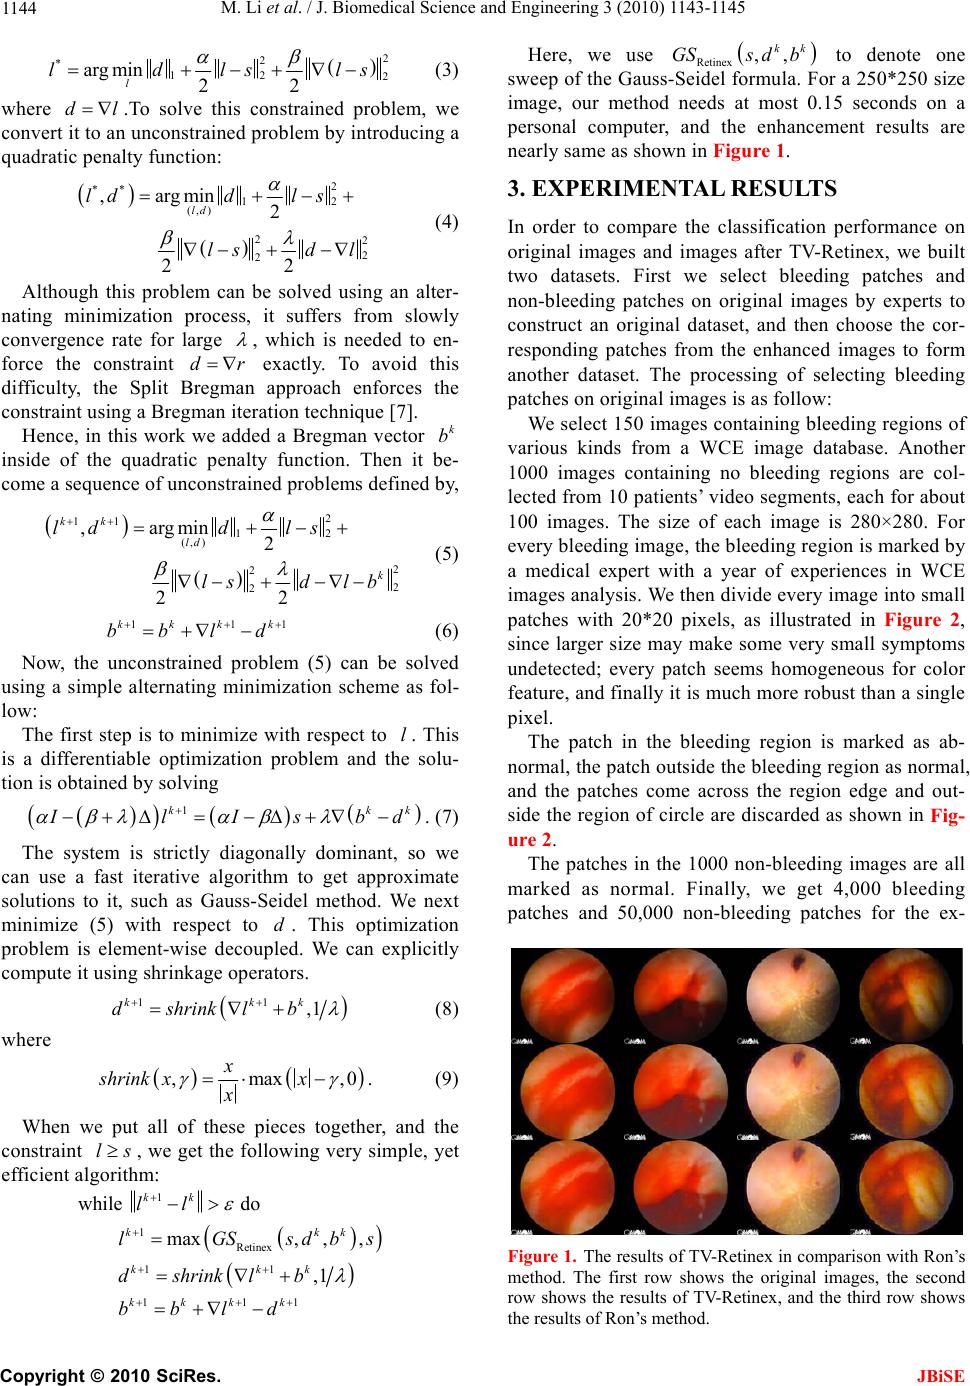 M. Li et al. / J. Biomedical Science and Engineering 3 (2010) 1143-1145 1144 2 2 *12 2 argmin 22 l ld lsls l (3) where .To solve this constrained problem, we convert it to an unconstrained problem by introducing a quadratic penalty function: d 2 ** 12 (, ) 22 2 2 ,argmin 2 22 ld ldd ls lsd l (4) Although this problem can be solved using an alter- nating minimization process, it suffers from slowly convergence rate for large , which is needed to en- force the constraint exactly. To avoid this difficulty, the Split Bregman approach enforces the constraint using a Bregman iteration technique [7]. dr Hence, in this work we added a Bregman vector inside of the quadratic penalty function. Then it be- come a sequence of unconstrained problems defined by, k b 2 11 12 (, ) 2 2 2 2 ,argmin 2 22 kk ld k ldd ls lsd lb (5) 11kkkk bbld 1 kk (6) Now, the unconstrained problem (5) can be solved using a simple alternating minimization scheme as fol- low: The first step is to minimize with respect to . This is a differentiable optimization problem and the solu- tion is obtained by solving l 1k I lIsbd . (7) The system is strictly diagonally dominant, so we can use a fast iterative algorithm to get approximate solutions to it, such as Gauss-Seidel method. We next minimize (5) with respect to d. This optimization problem is element-wise decoupled. We can explicitly compute it using shrinkage operators. 11 ,1 kk dshrinklb k (8) where ,max x shrink xx x ,0 . (9) When we put all of these pieces together, and the constraint , we get the following very simple, yet efficient algorithm: ls 1 1Retinex 11 111 while do max,,, ,1 kk kk kkk kkkk ll lGSsdb dshrinklb bbld k s Here, we use to denote one sweep of the Gauss-Seidel formula. For a 250*250 size image, our method needs at most 0.15 seconds on a personal computer, and the enhancement results are nearly same as shown in Figure 1. Retinex ,, kk GSs db 3. EXPERIMENTAL RESULTS In order to compare the classification performance on original images and images after TV-Retinex, we built two datasets. First we select bleeding patches and non-bleeding patches on original images by experts to construct an original dataset, and then choose the cor- responding patches from the enhanced images to form another dataset. The processing of selecting bleeding patch es on or iginal imag e s is as fo llo w : We select 150 images containing bleeding regions of various kinds from a WCE image database. Another 1000 images containing no bleeding regions are col- lected from 10 patients’ video segmen ts, each for about 100 images. The size of each image is 280×280. For every bleed ing image, the bleed ing region is mar ked by a medical expert with a year of experiences in WCE images analysis. We then divide every image into small patches with 20*20 pixels, as illustrated in Figure 2, since larger siz e may make s ome very sma ll symptoms undetected; every patch seems homogeneous for color feature, and finally it is much more robust than a single pixel. The patch in the bleeding region is marked as ab- normal, the patch outside the bleeding region as normal, and the patches come across the region edge and out- side the region of circle are discarded as shown in Fig- ure 2. The patches in the 1000 non-bleeding images are all marked as normal. Finally, we get 4,000 bleeding patches and 50,000 non-bleeding patches for the ex- Figure 1. The results of TV-Retinex in comparison with Ron’s method. The first row shows the original images, the second row shows the results of TV-Retinex, and the third row shows the results of Ron’s method. Copyright © 2010 SciRes. JBiSE 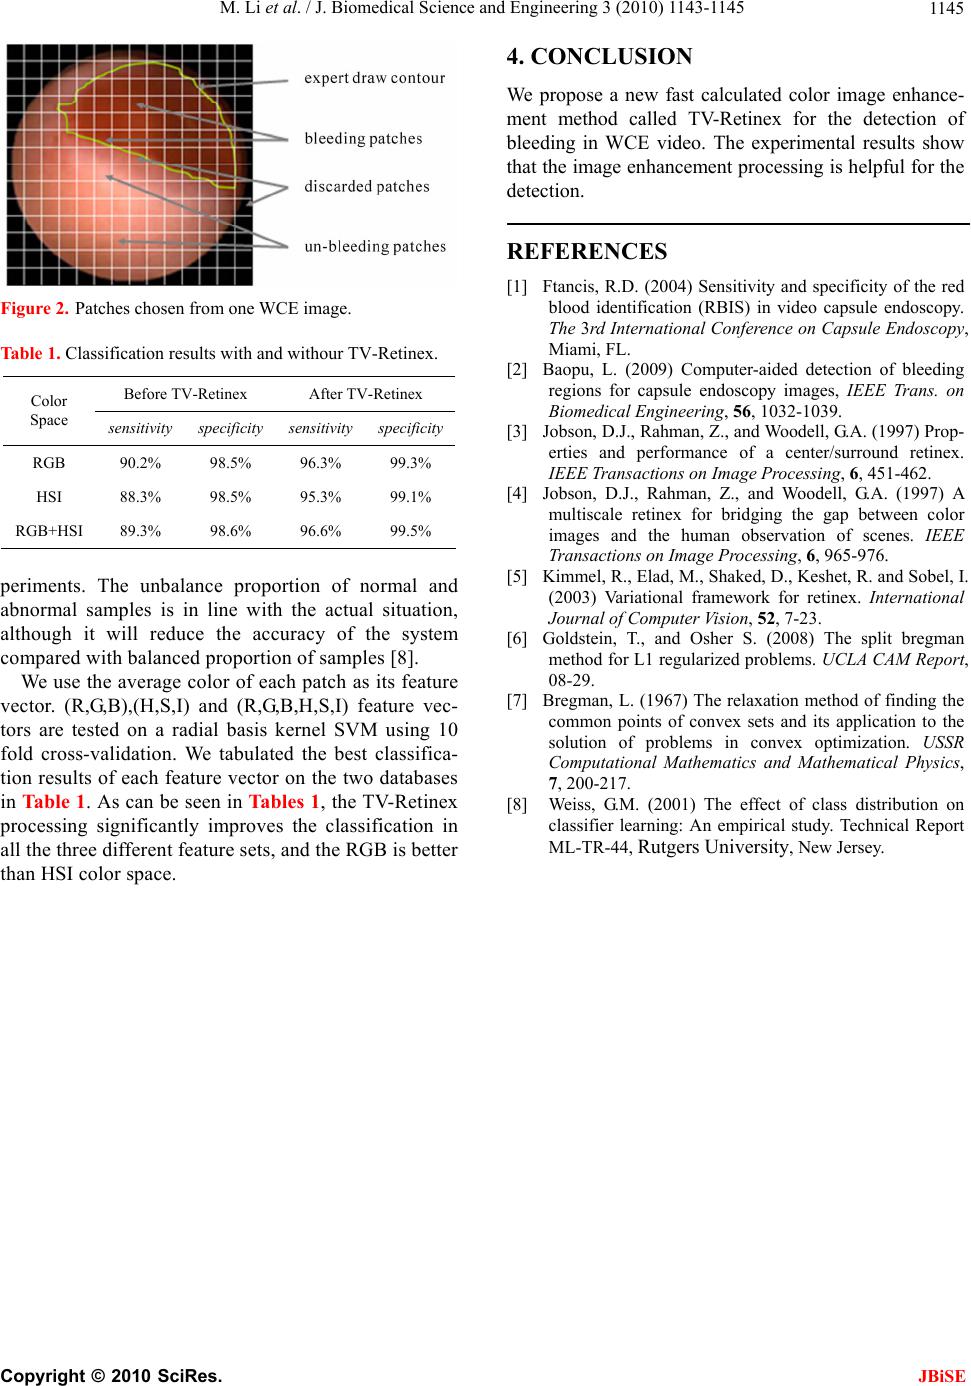 M. Li et al. / J. Biomedical Science and Engineering 3 (2010) 1143-1145 Copyright © 2010 SciRes. 1145 4. CONCLUSION We propose a new fast calculated color image enhance- ment method called TV-Retinex for the detection of bleeding in WCE video. The experimental results show that the image enhancement processing is helpful fo r the detection. REFERENCES [1] Ftancis, R.D. (2004) Sensitivity and specificity of the red blood identification (RBIS) in video capsule endoscopy. The 3rd International Conference on Capsule Endoscopy, Miami, FL. Figure 2. Patches chosen from one WCE image. Table 1. Classification results with and withour TV-Retinex. [2] Baopu, L. (2009) Computer-aided detection of bleeding regions for capsule endoscopy images, IEEE Trans. on Biomedical Engineering, 56, 1032-1039. Before TV-Retinex After TV-Retinex Color Space sensitivity specificity sensitivity specificity RGB 90.2% 98.5% 96.3% 99.3% HSI 88.3% 98.5% 95.3% 99.1% RGB+HSI 89.3% 98.6% 96.6% 99.5% [3] Jobson, D.J., Rahman, Z., and Woodell, G. A. (1997) Prop- erties and performance of a center/surround retinex. IEEE Transactions on Image Processing, 6, 451-462. [4] Jobson, D.J., Rahman, Z., and Woodell, G.A. (1997) A multiscale retinex for bridging the gap between color images and the human observation of scenes. IEEE Transactions on Image Processing, 6, 965-976. [5] Kimmel, R., Elad, M., Shaked, D., Keshet, R. and Sobel, I. (2003) Variational framework for retinex. International Journal of Computer Vision, 52, 7-23. periments. The unbalance proportion of normal and abnormal samples is in line with the actual situation, although it will reduce the accuracy of the system compared with balanced proportion of samples [8]. [6] Goldstein, T., and Osher S. (2008) The split bregman method for L1 regularized problems. UCLA CAM Report, 08-29. We use th e average color of each patch as its f eature vector. (R,G,B),(H,S,I) and (R,G,B,H,S,I) feature vec- tors are tested on a radial basis kernel SVM using 10 fold cross-validation. We tabulated the best classifica- tion results of each feature vector on the two databases in Table 1. As can be seen in Tabl es 1, the TV-Retinex processing significantly improves the classification in all the three different feature sets, and the RGB is better than HSI color space. [7] Bregman, L. (1967) The relaxation method of finding the common points of convex sets and its application to the solution of problems in convex optimization. USSR Computational Mathematics and Mathematical Physics, 7, 200-217. [8] Weiss, G.M. (2001) The effect of class distribution on classifier learning: An empirical study. Technical Report ML-TR-44, Rutgers University, New Jersey. JBiSE |