

Paper Menu >>
Journal Menu >>
 Engineering, 2013, 5, 58-62 doi:10.4236/eng.2013.55B012 Published Online May 2013 (http://www.scirp.org/journal/eng) The Design of the Fuzzy Inference System for the Determination of Attention Hye Jin Kim1, Sun K. Yoo2* 1Graduate School of Biomedical Engineering, Yonsei University, Seoul, Korea 2Department of Medical Engineering, College of Medicine, Yonsei University, Seoul, Korea Email: hjkim[email protected], *[email protected] Received 2013 ABSTRACT In this study, by using the response speed and the number of errors resulting from the children’s concentration test through the fuzzy inferenc e system and comparing it to the theta which is one of the EEG’s parameter to find the level of concentration. Targeting 21(Male 12, Female 9) healthy children between the ages of 10 - 14, the test was conducted one time with a duration of 14 minutes. For the first 5 minutes the children were listening to the Bach’s Air on a G string having a steady state and the next 9 minutes the children were subjected to the external stimuli audiogenic stimu- lation that induces attention co ncen tration. When the number 3 wa s heard, ch ildren w ere subjected to press down on the spacebar to check the response speed and the number of errors. By conducting computerized neurocognitive function test to compare the theta wave related to the concentration with th e response speed and the number of errors that deter- mines the attention con centration through the fuzzy system, the data from 15 children out of 21 have shown the results for the concentration. In order to check the concentration level, a fuzzy inference system which was designed by the user could be used. Keywords: Attention; Computerized Neuro-physiological Test; Fuzzy system 1. Introduction The modern society that is represented by knowledge • Information shows an interest on the importance of learning and learning for school aged children is growing more than anything else. The factors that affect the learning of children this time is the basic cognitive abili- ties to focus attention on a particular object or targ et. The children's ability to learn is in correlation between the attitude and the attention concentration and the restric- tions and the lack of the attention concentration is the primary cause of poor learning ability [1,2]. The attention con centration is an ability [3 ] to focu s on the consciousness from an internal • external stimuli, the process that focus selectively[4] on relevant stimuli ac- cording to the info rmation of the sensory receptors th at is required for learning will select its input and filtrative function [5,6]. Without the attentio n concentration, better information processing is not possible and decides what to focus on for ourselves and what information to transfer in meaningful form that can be stored from the sensory memory [7]. Children lacking the attention concentration have de- clining attention for the surroundings in daily life and their attention concentration becomes distracted and dis- turbed even with a small stimuli showing problems such as hyperactivity, unstable emotions or poor self-esteem [8]. Also, they can be focused on the things of their interest but monotonous and repetitive, and when performing a tedious task it seems difficult to concentrate con tinuously [9,10]. They cannot sit still du ring a school hour but run- ning around with friends or simply doing other behaviors can be cautioned but only for a little while and even tually they will again show an erratic behavior [11]. Therefore attention concentration is a mandatory basic skill that is needed for the school aged children and teenager’s learning, acquiring new information and adap tin g to lo cal communities [12]. Nowadays, computerized neuropsychological tools are commonly used to measure the attention concentration and such inspection tools contributes to more objective scoring results and interpretation, Compared to such tra- ditional rating scale, expenses can be reduced for the time it takes for the implementation of the inspection, grading and reporting results, with an advantage of ques- tions of the presenting time and inspection, controlling of conducting time and it is easy to standardize the implan- tation for the inspection [13]. *Corresponding author. Copyright © 2013 SciRes. ENG  H. J. KIM, S. K. YOO 59 In recent years, using computerized neuropsychological tests not only help to improve children's concentration but ADHD group and normal children, and may be used not for ADHD but neurocognitive function appearance for a group of pediatric metal disord ers [13]. In addition, it is useful to be clinically used for patients with brain damage which i s widely used i n va rious fields. However, the attention concentration test using a computerized neurocognitive program cannot be clear about how much it had induced the child to be focused on the test. To have more definitive interpretation many studies have been conducted together with a bio-signal measurement. Especially an analysis for concentration using an EEG is being conducted and the status of con- centration from a stimuli induced events can be seen through the alpha and theta wave in a median line of the brain [14], and also during a short-term concentration experimental test due to external stimuli and based on previous research results that have indicated an increase in the theta rhyth m, in order to find the level o f attention concentration, an EEG such as theta can be an important indicator [15]. Therefore, in this study using computerized neurocog- nitive program to perform a concentration test for the child who requires the attention concentration and by designing the Fuzzy Inference System that determines the level of concentration obtained from the response speed and the number of errors, in order to assess the system checking the level of concen tration during the test using definit e parameters theta wave was co nd uct e d . 2. Methods 2.1. Participants This test was conducted using health y students, 12 males and 9 females with total of 21 persons without a history of cardiovascular and neur ological disorders. An average age for the children was 11 with the range of 10-14 years of age and included elementary 3rd graders to freshmen of junior high school. The subjects were recruited through the Electronics and Telecommunications Research Insti- tute (ETRI) bulletin board. All subjects have performed the concentration inducing test using the external stimuli [16]. 2.2. Experimental Design An external stimuli that induces the attention concentra- tion, CNT4.0 (Computerized Neuro-physiological Test: Computerized Neurocognitive tests) commonly used in the hospital program was used [17]. The audiometry test used within the CNT program for this study was Audi- tory Continuous Performance Test which is one kind of CPT (Continuous Performance Test: Continuous Per- formance Test). This test was performed by having the subjects to listen to the target stimulation of the number ‘3’ where the subjects have to press the response button as fast as possible in order to measure the number of correct response, the number of omission errors and the number of false alarm errors. For the correct response is randomly presented 15 times every 60 seconds, distur- bance stimulation 5 times each and the response time was measured in the units of 1/100 seconds. The basic paradigm of CPT makes occasional target stimuli or possible to measure selective attention to rele- vant stimuli. Therefore, the CPT program performs the inspection by rapidly presenting the target stimuli or tar- get pattern while constantly changing and the time needed to perform the test will vary with each inspection but it was designed sufficiently to measure the attentive- ness [13,17]. The screen shown in Figure 1 was an actual CNT in- spection monitored using a CNT program and the resu lts of the correct response, the number of omission errors and the number of false alarm errors can be seen(Table 1 ) Figure 1. CNT hearing test results. Copyright © 2013 SciRes. ENG 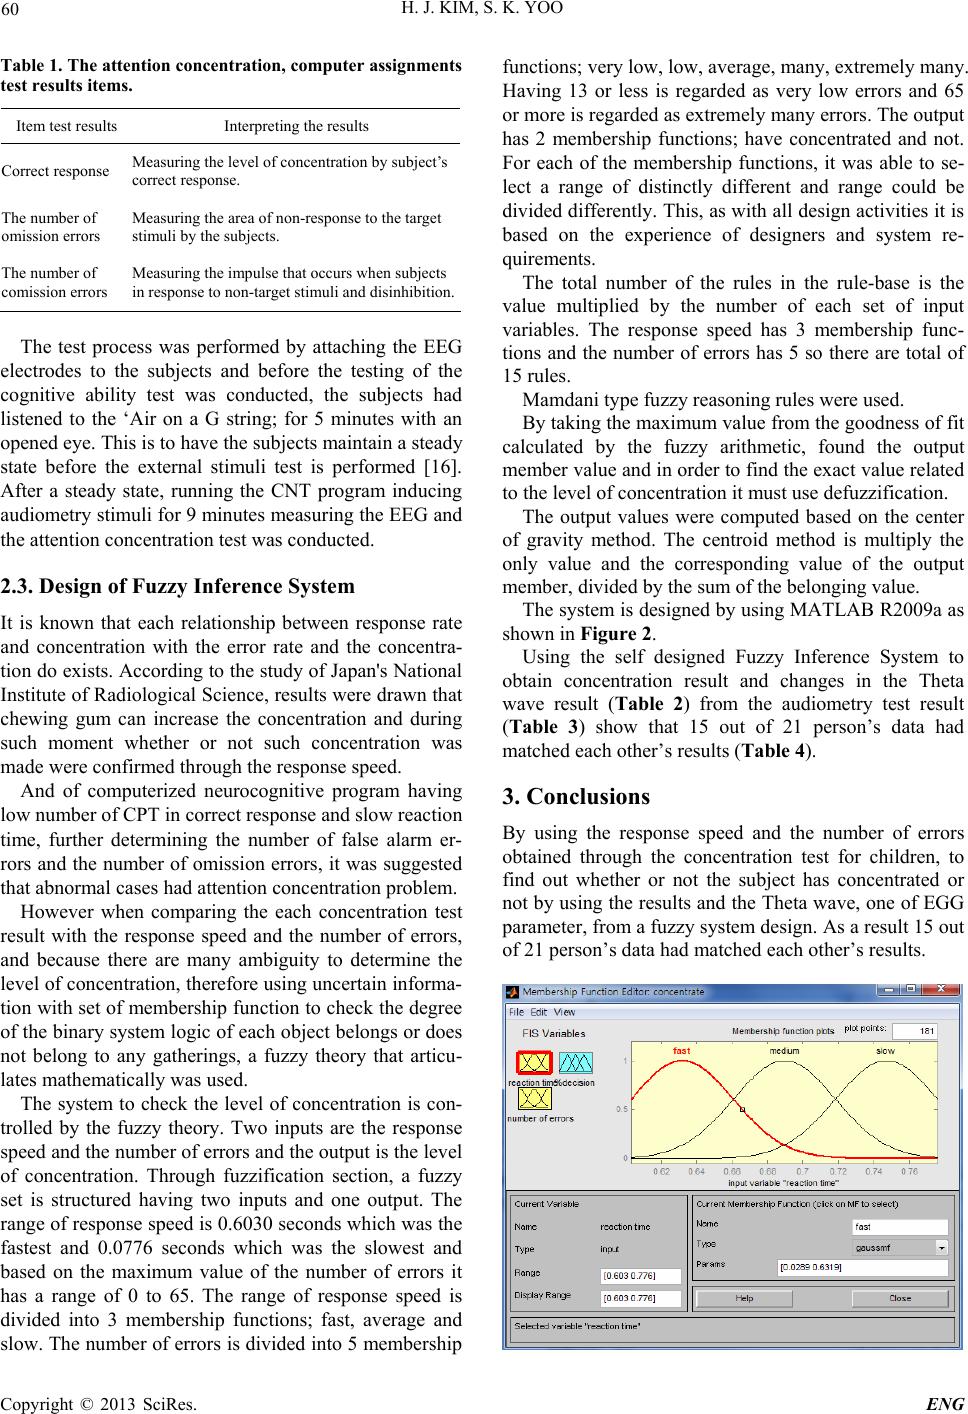 H. J. KIM, S. K. YOO 60 Table 1. The attention concentration, computer assignments test results items. Item test results Interpreting the results Correct response Measuring the lev el of concentration by subject’s correct response. The number of omission errors Measuring the area of non-response to the target stimuli by the s ubje cts. The number of comission errors Measuring the impulse that occurs when subjects in response to non-tar get stimuli and disinhibi t ion. The test process was performed by attaching the EEG electrodes to the subjects and before the testing of the cognitive ability test was conducted, the subjects had listened to the ‘Air on a G string; for 5 minutes with an opened eye. This is to have the subjects maintain a steady state before the external stimuli test is performed [16]. After a steady state, running the CNT program inducing audiometry stimuli for 9 minutes measuring the EEG and the attention con centration test was conducted. 2.3. Design of Fuzzy Inference System It is known that each relationship between response rate and concentration with the error rate and the concentra- tion do exists. According to the study of Japan's National Institute of Radiolog ical Science, results were drawn that chewing gum can increase the concentration and during such moment whether or not such concentration was made were confirmed th rough the response speed. And of computerized neurocognitive program having low number of CPT in correct response and slow reaction time, further determining the number of false alarm er- rors and the number of omission errors, it was suggested that abnormal cases had attention concentration problem. However when comparing the each concentration test result with the response speed and the number of errors, and because there are many ambiguity to determine the level of concentration, therefore using uncertain informa- tion with set of membership fu nction to check th e degree of the binary system logic of each object belongs or does not belong to any gatherings, a fuzzy theory that articu- lates mathematically was used. The system to check the level of concentration is con- trolled by the fuzzy theory. Two inputs are the response speed and the number of errors and the output is the level of concentration. Through fuzzification section, a fuzzy set is structured having two inputs and one output. The range of response speed is 0.6030 seconds which was the fastest and 0.0776 seconds which was the slowest and based on the maximum value of the number of errors it has a range of 0 to 65. The range of response speed is divided into 3 membership functions; fast, average and slow. The number of errors is divided into 5 membership functions; very low, low, average, many, extremely many. Having 13 or less is regarded as very low errors and 65 or more is regarded as extremely many errors. The output has 2 membership functions; have concentrated and not. For each of the membership functions, it was able to se- lect a range of distinctly different and range could be divided differently. This, as with all design activities it is based on the experience of designers and system re- quirements. The total number of the rules in the rule-base is the value multiplied by the number of each set of input variables. The response speed has 3 membership func- tions and the number of errors has 5 so there are total of 15 rules. Mamdani type fuzzy reasoning rules were used. By taking the maximum value from the goodness of fit calculated by the fuzzy arithmetic, found the output member value and in order to find the exact value related to the level of concentration it must use defuzzification. The output values were computed based on the center of gravity method. The centroid method is multiply the only value and the corresponding value of the output member, divided by the sum of the belonging value. The system is designed by using MATLAB R2009a as shown in Figure 2. Using the self designed Fuzzy Inference System to obtain concentration result and changes in the Theta wave result (Table 2) from the audiometry test result (Table 3) show that 15 out of 21 person’s data had matched each other’s results (Table 4). 3. Conclusions By using the response speed and the number of errors obtained through the concentration test for children, to find out whether or not the subject has concentrated or not by using the results and the Theta wave, one of EGG parameter, from a fuzzy system design. As a result 15 out of 21 person’s data had matched each other’s results. Copyright © 2013 SciRes. ENG 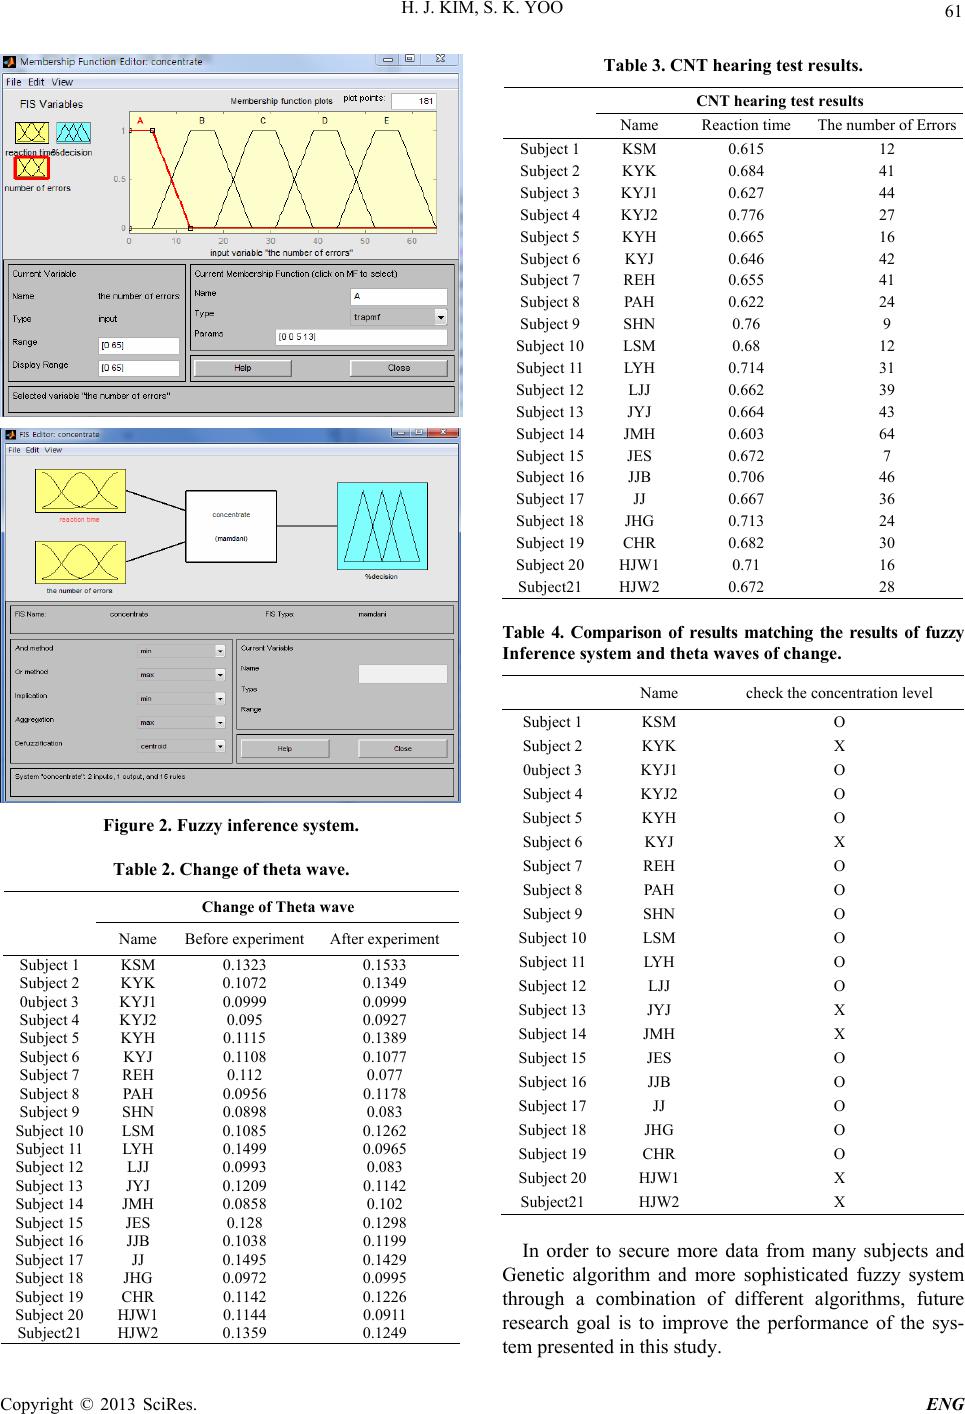 H. J. KIM, S. K. YOO 61 Figure 2. Fuzzy infe rence system. Table 2. Change of theta wave. Change of Theta wave Name Before experiment After experiment Subject 1 KSM 0.1323 0.1533 Subject 2 KYK 0.1072 0.1349 0ubject 3 KYJ1 0.0999 0.0999 Subject 4 KYJ2 0.095 0.0927 Subject 5 KYH 0.1115 0.1389 Subject 6 KYJ 0.1108 0.1077 Subject 7 REH 0.112 0.077 Subject 8 PAH 0.0956 0.1178 Subject 9 SHN 0.0898 0.083 Subject 10 LSM 0.1085 0.1262 Subject 11 LYH 0.1499 0.0965 Subject 12 LJJ 0.0993 0.083 Subject 13 JYJ 0.1209 0.1142 Subject 14 JMH 0.0858 0.102 Subject 15 JES 0.128 0.1298 Subject 16 JJB 0.1038 0.1199 Subject 17 JJ 0.1495 0.1429 Subject 18 JHG 0.0972 0.0995 Subject 19 CHR 0.1142 0.1226 Subject 20 HJW1 0.1144 0.0911 Subject21 HJW2 0.1359 0.1249 Table 3. CNT hearing test results. CNT hearing test results Name Reaction time The number of Er rors Subject 1 K S M 0.615 12 Subject 2 KYK 0.684 41 Subject 3 KYJ1 0.627 44 Subject 4 KYJ2 0.776 27 Subject 5 KYH 0.665 16 Subject 6 KYJ 0.646 42 Subject 7 REH 0.655 41 Subject 8 PAH 0.622 24 Subject 9 SHN 0.76 9 Subject 10LSM 0.68 12 Subject 11LYH 0.714 31 Subject 12LJJ 0.662 39 Subject 13JY J 0.664 43 Subject 14JMH 0.603 64 Subject 15JES 0.672 7 Subject 16JJ B 0.706 46 Subject 17JJ 0.667 36 Subject 18JHG 0.713 24 Subject 19CHR 0.682 30 Subject 20HJW1 0.71 16 Subject21HJW2 0.672 28 Table 4. Comparison of results matching the results of fuzzy Inference system and theta waves of change. Name check the concentratio n l ev el Subject 1 KSM O Subject 2 KYK X 0ubject 3 KYJ1 O Subject 4 KYJ2 O Subject 5 KYH O Subject 6 KYJ X Subject 7 REH O Subject 8 PAH O Subject 9 SHN O Subject 10 LSM O Subject 11 LYH O Subject 12 LJJ O Subject 13 JYJ X Subject 14 JMH X Subject 15 JES O Subject 16 JJB O Subject 17 JJ O Subject 18 JHG O Subject 19 CHR O Subject 20 HJW1 X Subject21 HJW2 X In order to secure more data from many subjects and Genetic algorithm and more sophisticated fuzzy system through a combination of different algorithms, future research goal is to improve the performance of the sys- tem presented in this study. Copyright © 2013 SciRes. ENG  H. J. KIM, S. K. YOO Copyright © 2013 SciRes. ENG 62 4. Acknowledgements This work was supported by the National Research Foundation of Korea (NRF) grant funded by the Korea government(MEST) (No.2010-0026833) REFERENCES [1] Choi Chun Ok, “The Effects of Attention Concentration Training Program on the ADHD Children’s Attention Concentration and Impulsiveness,” Graduate School of Education The Catholic University of Korea Seoul, Korea. 2000. [2] P. Grossman, “Respiration, Stress and Cardiovascular Function,” Psychology, Vol. 20, 1973, pp. 284-300. [3] S. A. Kirk and J. C. Chalfant, “Academic and Develop- mental Learning Disabilities: Attentional Disabili- ties,” Columbus Ohio : Love Publishing Company, 1984. [4] D. Reid and W. Hresko, “ A Cognitive Approach to Learning Disabilities, New York : Mcgraw Hill, 1981. [5] A. M. Wiliams and K. Davids, “Visual Search Strategy Selective Attention, and Expertise in Soccer,” Research Quartely of Exercise and Sport, Vol. 69, No. 2, 1998, pp. 111-1118. doi:10.1080/02701367.1998.10607677 [6] A. M. Wiliams, “Perceptual Skill in Soccer: Implications for Talent Identification and Development,” Journal of Sports Science, Vol. 18, 2000, pp. 737-750. doi:10.1080/02640410050120113 [7] C. Christiansen, “Occupational Therapy: Intervention for Life Performance,” In C. H. Christiansen, & C. M. Baum(Eds), “Occupational Therapy : Overcoming Hu- man Performance Deficits,” 1st edition, Thorofare, NJ: SLACK Inc., 1991. [8] E. J. S. Sonuga-Barke, K. Houlberg and M. Hall, “When is ‘Impulsiveness’ Not Impulsive? The Case of Hyperactive Children’s Cognitive Style,” Journal of child psychology and psychiatry, Vol. 35, 1994, pp.1247-1253. doi:10.1111/j.1469-7610.1994.tb01232.x [9] R. A. Berkly, “Attention-Deficit/Hyperactivity Disorder: A Handbook for Diagnosis and Treatment,” 2nd edition, New York: Guilford, 1998. [10] P. L. Frick, and B. B. Lancy, “The Nature and Character- istics of Attention Deficit Hyperactivity Disorder,” School Psychology Review, Vol. 20, 1991, pp.163-173. [11] Park Ah Chung, Vol. 287, 1993, pp. 22-25. [12] A. A. Rizzo and U. Buckwalter, “Psycho-Neuro-Physio- Logical Assessment and Rehabilitation in Virtual Envi- ronments: Cognition, Clinical, and Human Factors in Advanced Human Computer Interaction,” Amsterdam: IOS Press, 1997. [13] B. H. Koo and D. S. Bai, “Diagnostic Availability of a Computerized Neurocognitive Function Test for Children with ADHD,” Journal of Korean Soc Biol Ther Psychia- try, Vol. 12, No. 1, 2006, pp. 39-49. [14] W. Klimesch, “EEG Alpha and Theta Oscillations Reflect cognitive and Memory Performance: A Review and Analysis,” Brain Research Reviews, Vol. 29, No. 2-3, 1999, pp. 169-195. doi:10.1016/S0165-0173(98)00056-3 [15] B. Anatoly, N. Meir, K. Boris David and a Potential Method for the Evaluation of the Autonomic Nervous system,” Physiological Measurement, Vol. 19, No. 1, 1998, pp. 93-102. doi:10.1088/0967-3334/19/1/008 [16] W.–J. Choi, C.-K. Lee and S.-K. Yoo, “An Analysis of Correlation Between EEG Signal and HRV During At- tentional Status with Children Under 15 years,” Koean Journal of The Science of Emotion & Sensibility, Vol. 14, No. 2, 2011, pp. 269-278. [17] K. Jinsung, L. Jongbum, K. Wanseok, S. Hyounjin, B. Daiseg and L. Hyelin “The Validity and Reliability of Computerized Neuro Cognitive Function Test in the Ele- mentary School Child,” Korean Psychosomatic society, Vol. 11, No. 2, 2003, pp. 97-117. [18] J.-M. Shim, H.-H. Kim and Y.-s. Lee, “Effects of Com- puterized Neurocognitive Function Program Induced Memory and Attention for Patients with Stroke,” J Kor Soc Phys Ther, Vol. 19, No. 4, 2007, pp. 25-32. |