

Paper Menu >>
Journal Menu >>
 Engineering, 2013, 5, 53-57 doi:10.4236/eng.2013.55B011 Published Online May 2013 (http://www.scirp.org/journal/eng) Monitoring Mental Fatigue in Analog Space Environment Using Optical Brain Imaging Xuejun Jiao1,2, Jing Bai1, Shanguan g Chen2, Qijie Li2 1Tsinghua University, Beijing, China 2National Laboratory of Human Factors Engineering, China Astronaut Research and Training Centre, Beijing, China Email: [email protected] Received 2013 ABSTRACT Accurate assessment of mental fatigue level would improve operational safety and efficacy of astronauts for long-term space flight. Identification of neurophysiological markers can index impending overload or fatigue before performance decrements using neuroimaging technologies. The current study utilized functional near-infrared spectroscopy (fNIR) to investigate the relationship of hemodynamic response in prefrontal cortex with changes of mental fatigue level, task performance (reaction time) during n-back working memory task and routine work task in analog space environment. Results indicated that the information entropy of hemodynamic response is related to task performance and subjective self-reported measures; the reaction time is predicted by regression analysis; and the accuracy of mental fatigue classification approaches 90%. Since fNIR is a portable, wearable and minimally intrusive methodology, it has the potential to be deployed in future space environments to monitoring mental fatigue and assessing the effort of operators in field environments. Keywords: Mental Fatigue; Information Entropy; Modeling; fNIR 1. Introduction Mental fatigue refers to changes in the psycho-physio- logical state that people experience during and following the course of prolonged periods of demanding cognitive activity that require sustained mental efficiency. In other words, mental fatigue is limited solely to a mental state arising from a behavioral situation that includes a long- term continuous, repetitive performance of some mental task. Living in space is accompanied by a number of stress- ors, which can be classified as physiological stressors (e.g. microgravity, missing sunlight), psychological stressors (e.g. isolation, confinement) and task stressors (e.g. work overload, task stress). Astronauts are prone to tired at long flight. Mental fatigue can cause negative impact on work performance, alertness, cognitive ability and emotion, even impair mission success and mission safety during longer inhabitation of space, so mental fa- tigue detection and countermeasure are significant to manned space flight. Previous studies have aimed to find the sensitive indi- ces for evaluating mental fatigue based on performance and perceptual, electrophysiological, psychological and self-report measurements. Self-report and performance techniques cannot track the dynamically changing state of fatigue without confounding or compromising task performance. The current tendency in ergonomic re- search is to choose physiological measures (e.g. brain activity, heart rate variability, galvanic skin response)to assess mental fatigue state. fNIR is a non-invasive, non-ionizing, real-time moni- toring method used to determine oxygenation and hemodynamic in tissue [1]. fNIR is sensitive to changes in tissue oxygenation, both at the level of small blood vessels and capillaries and at the intracellular sites of oxygen uptake [2]. Owing to its ability to provide good temporal and spatial resolution of oxygen availability, this methodology may provide insights into mechanisms regulating regional tissue blood flow and metabolism during the performance of various tasks. Hemodynamic indexes are quit suitable for space environment because it can measure brain hemodynamic activity related to human brain activity with minimally intrusive, including sensorimotor, visual, auditory, and cognitive and lan- guage activity noninvasively [3], as well as measures of emotion and stress. Furthermore the instrumentation based on continuous wave (cw) technique is quit com- pact, so it can be made portable. The drawback of this method is that it can only measure hemodynamic changes which limit its applications, especially during long term measurement. So parameters which are not relevant to baseline need to be found. Copyright © 2013 SciRes. ENG 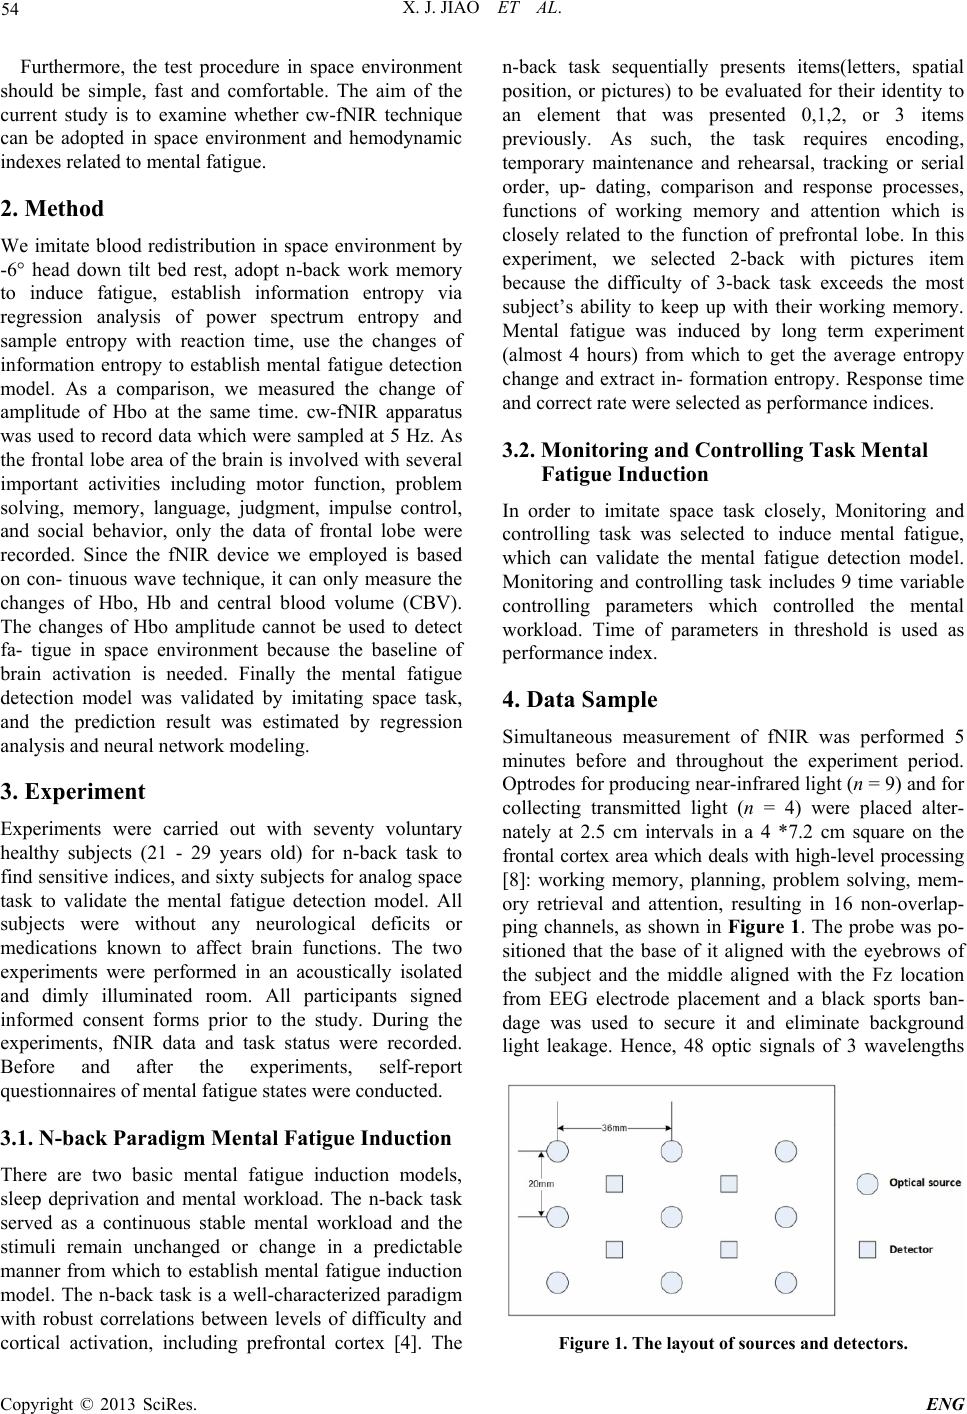 X. J. JIAO ET AL. 54 Furthermore, the test procedure in space environment should be simple, fast and comfortable. The aim of the current study is to examine whether cw-fNIR technique can be adopted in space environment and hemodynamic indexes related to mental fatigue. 2. Method We imitate blood redistribution in space environment by -6° head down tilt bed rest, adopt n-back work memory to induce fatigue, establish information entropy via regression analysis of power spectrum entropy and sample entropy with reaction time, use the changes of information entropy to establish mental fatigue detection model. As a comparison, we measured the change of amplitude of Hbo at the same time. cw-fNIR apparatus was used to record data which were sampled at 5 Hz. As the frontal lobe area of the brain is involved with several important activities including motor function, problem solving, memory, language, judgment, impulse control, and social behavior, only the data of frontal lobe were recorded. Since the fNIR device we employed is based on con- tinuous wave technique, it can only measure the changes of Hbo, Hb and central blood volume (CBV). The changes of Hbo amplitude cannot be used to detect fa- tigue in space environment because the baseline of brain activation is needed. Finally the mental fatigue detection model was validated by imitating space task, and the prediction result was estimated by regression analysis and neural network modeling. 3. Experiment Experiments were carried out with seventy voluntary healthy subjects (21 - 29 years old) for n-back task to find sensitive indices, and sixty subjects for analog space task to validate the mental fatigue detection model. All subjects were without any neurological deficits or medications known to affect brain functions. The two experiments were performed in an acoustically isolated and dimly illuminated room. All participants signed informed consent forms prior to the study. During the experiments, fNIR data and task status were recorded. Before and after the experiments, self-report questionnaires of mental fatigue states were conducted. 3.1. N-back Paradigm Mental Fatigue Induction There are two basic mental fatigue induction models, sleep deprivation and mental workload. The n-back task served as a continuous stable mental workload and the stimuli remain unchanged or change in a predictable manner from which to establish mental fatigue induction model. The n-back task is a well-characterized paradigm with robust correlations between levels of difficulty and cortical activation, including prefrontal cortex [4]. The n-back task sequentially presents items(letters, spatial position, or pictures) to be evaluated for their identity to an element that was presented 0,1,2, or 3 items previously. As such, the task requires encoding, temporary maintenance and rehearsal, tracking or serial order, up- dating, comparison and response processes, functions of working memory and attention which is closely related to the function of prefrontal lobe. In this experiment, we selected 2-back with pictures item because the difficulty of 3-back task exceeds the most subject’s ability to keep up with their working memory. Mental fatigue was induced by long term experiment (almost 4 hours) from which to get the average entropy change and extract in- formation entropy. Response time and correct rate were selected as performance indices. 3.2. Monitoring and Controlling Task Mental Fatigue Induction In order to imitate space task closely, Monitoring and controlling task was selected to induce mental fatigue, which can validate the mental fatigue detection model. Monitoring and controlling task includes 9 time variable controlling parameters which controlled the mental workload. Time of parameters in threshold is used as performance index. 4. Data Sample Simultaneous measurement of fNIR was performed 5 minutes before and throughout the experiment period. Optrodes for producing near-infrared light (n = 9) and for collecting transmitted light (n = 4) were placed alter- nately at 2.5 cm intervals in a 4 *7.2 cm square on the frontal cortex area which deals with high-level processing [8]: working memory, planning, problem solving, mem- ory retrieval and attention, resulting in 16 non-overlap- ping channels, as shown in Figure 1. The probe was po- sitioned that the base of it aligned with the eyebrows of the subject and the middle aligned with the Fz location from EEG electrode placement and a black sports ban- dage was used to secure it and eliminate background light leakage. Hence, 48 optic signals of 3 wavelengths Figure 1. The layout of sources and detectors. Copyright © 2013 SciRes. ENG 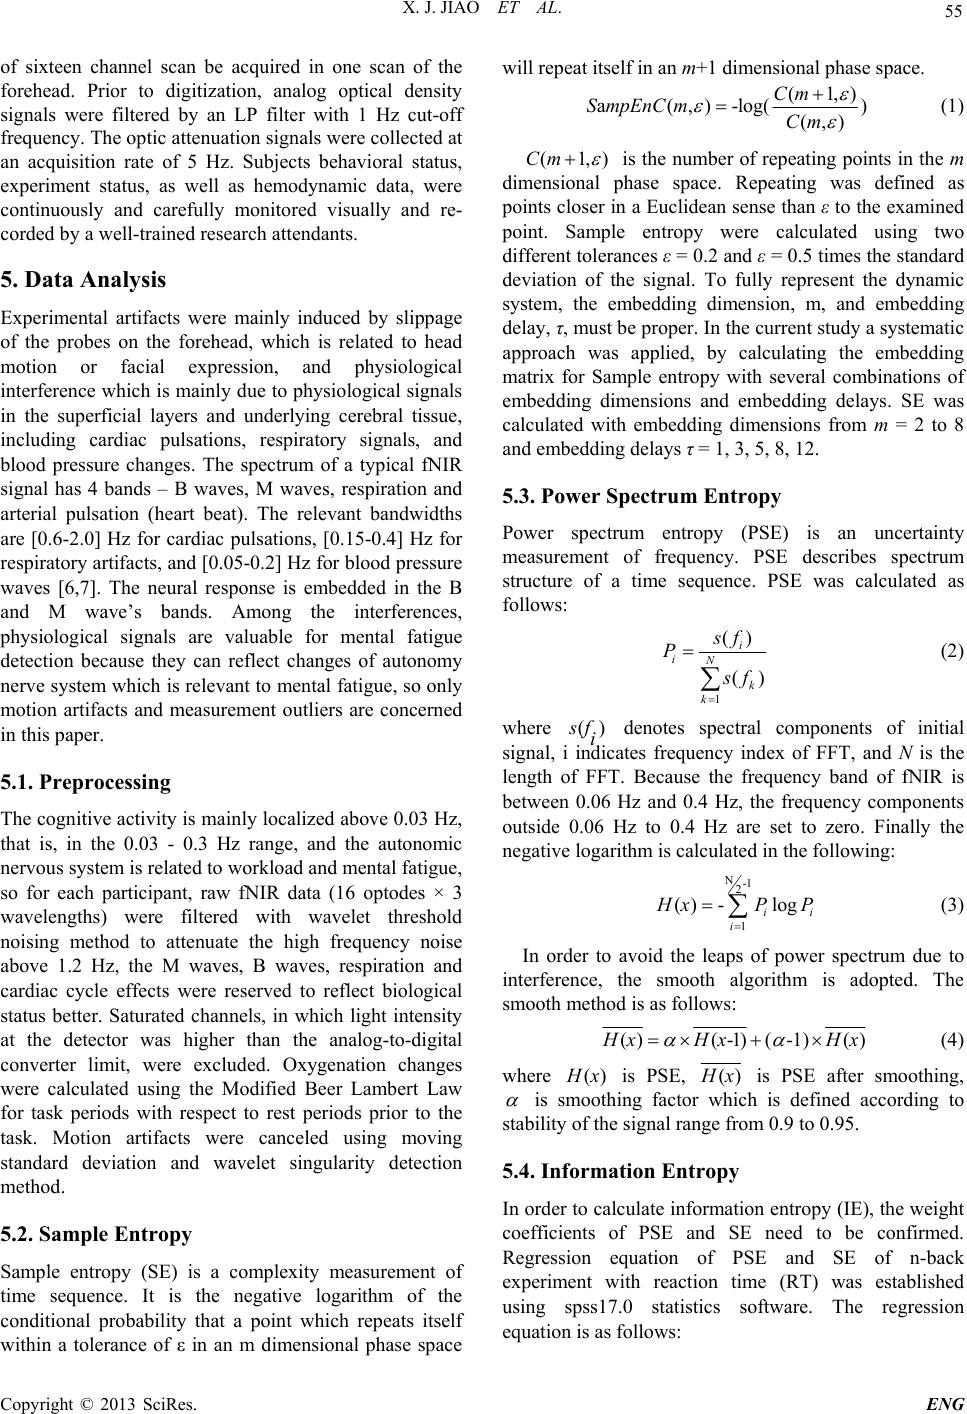 X. J. JIAO ET AL. 55 of sixteen channel scan be acquired in one scan of the forehead. Prior to digitization, analog optical density signals were filtered by an LP filter with 1 Hz cut-off frequency. The optic attenuation signals were collected at an acquisition rate of 5 Hz. Subjects behavioral status, experiment status, as well as hemodynamic data, were continuously and carefully monitored visually and re- corded by a well-trained research attendants. 5. Data Analysis Experimental artifacts were mainly induced by slippage of the probes on the forehead, which is related to head motion or facial expression, and physiological interference which is mainly due to physiological signals in the superficial layers and underlying cerebral tissue, including cardiac pulsations, respiratory signals, and blood pressure changes. The spectrum of a typical fNIR signal has 4 bands – B waves, M waves, respiration and arterial pulsation (heart beat). The relevant bandwidths are [0.6-2.0] Hz for cardiac pulsations, [0.15-0.4] Hz for respiratory artifacts, and [0.05-0.2] Hz for blood pressure waves [6,7]. The neural response is embedded in the B and M wave’s bands. Among the interferences, physiological signals are valuable for mental fatigue detection because they can reflect changes of autonomy nerve system which is relevant to mental fatigue, so only motion artifacts and measurement outliers are concerned in this paper. 5.1. Preprocessing The cognitive activity is mainly localized above 0.03 Hz, that is, in the 0.03 - 0.3 Hz range, and the autonomic nervous system is related to workload and mental fatigue, so for each participant, raw fNIR data (16 optodes × 3 wavelengths) were filtered with wavelet threshold noising method to attenuate the high frequency noise above 1.2 Hz, the M waves, B waves, respiration and cardiac cycle effects were reserved to reflect biological status better. Saturated channels, in which light intensity at the detector was higher than the analog-to-digital converter limit, were excluded. Oxygenation changes were calculated using the Modified Beer Lambert Law for task periods with respect to rest periods prior to the task. Motion artifacts were canceled using moving standard deviation and wavelet singularity detection method. 5.2. Sample Entropy Sample entropy (SE) is a complexity measurement of time sequence. It is the negative logarithm of the conditional probability that a point which repeats itself within a tolerance of ε in an m dimensional phase space will repeat itself in an m+1 dimensional phase space. (1,) a(, )-log() (,) Cm SmpEnCmCm (1) (1,Cm ) is the number of repeating points in the m dimensional phase space. Repeating was defined as points closer in a Euclidean sense than ε to the examined point. Sample entropy were calculated using two different tolerances ε = 0.2 and ε = 0.5 times the standard deviation of the signal. To fully represent the dynamic system, the embedding dimension, m, and embedding delay, τ, must be proper. In the current study a systematic approach was applied, by calculating the embedding matrix for Sample entropy with several combinations of embedding dimensions and embedding delays. SE was calculated with embedding dimensions from m = 2 to 8 and embedding delays τ = 1, 3, 5, 8, 12. 5.3. Power Spectrum Entropy Power spectrum entropy (PSE) is an uncertainty measurement of frequency. PSE describes spectrum structure of a time sequence. PSE was calculated as follows: 1 () () i iN k k s f P s f (2) where () s fi denotes spectral components of initial signal, i indicates frequency index of FFT, and N is the length of FFT. Because the frequency band of fNIR is between 0.06 Hz and 0.4 Hz, the frequency components outside 0.06 Hz to 0.4 Hz are set to zero. Finally the negative logarithm is calculated in the following: N-1 2 1 () -log i i i H xP P (3) In order to avoid the leaps of power spectrum due to interference, the smooth algorithm is adopted. The smooth method is as follows: ()(-1)( -1)() H xHx H x (4) where () H x is PSE, () H x is PSE after smoothing, is smoothing factor which is defined according to stability of the signal range from 0.9 to 0.95. 5.4. Information Entropy In order to calculate information entropy (IE), the weight coefficients of PSE and SE need to be confirmed. Regression equation of PSE and SE of n-back experiment with reaction time (RT) was established using spss17.0 statistics software. The regression equation is as follows: Copyright © 2013 SciRes. ENG 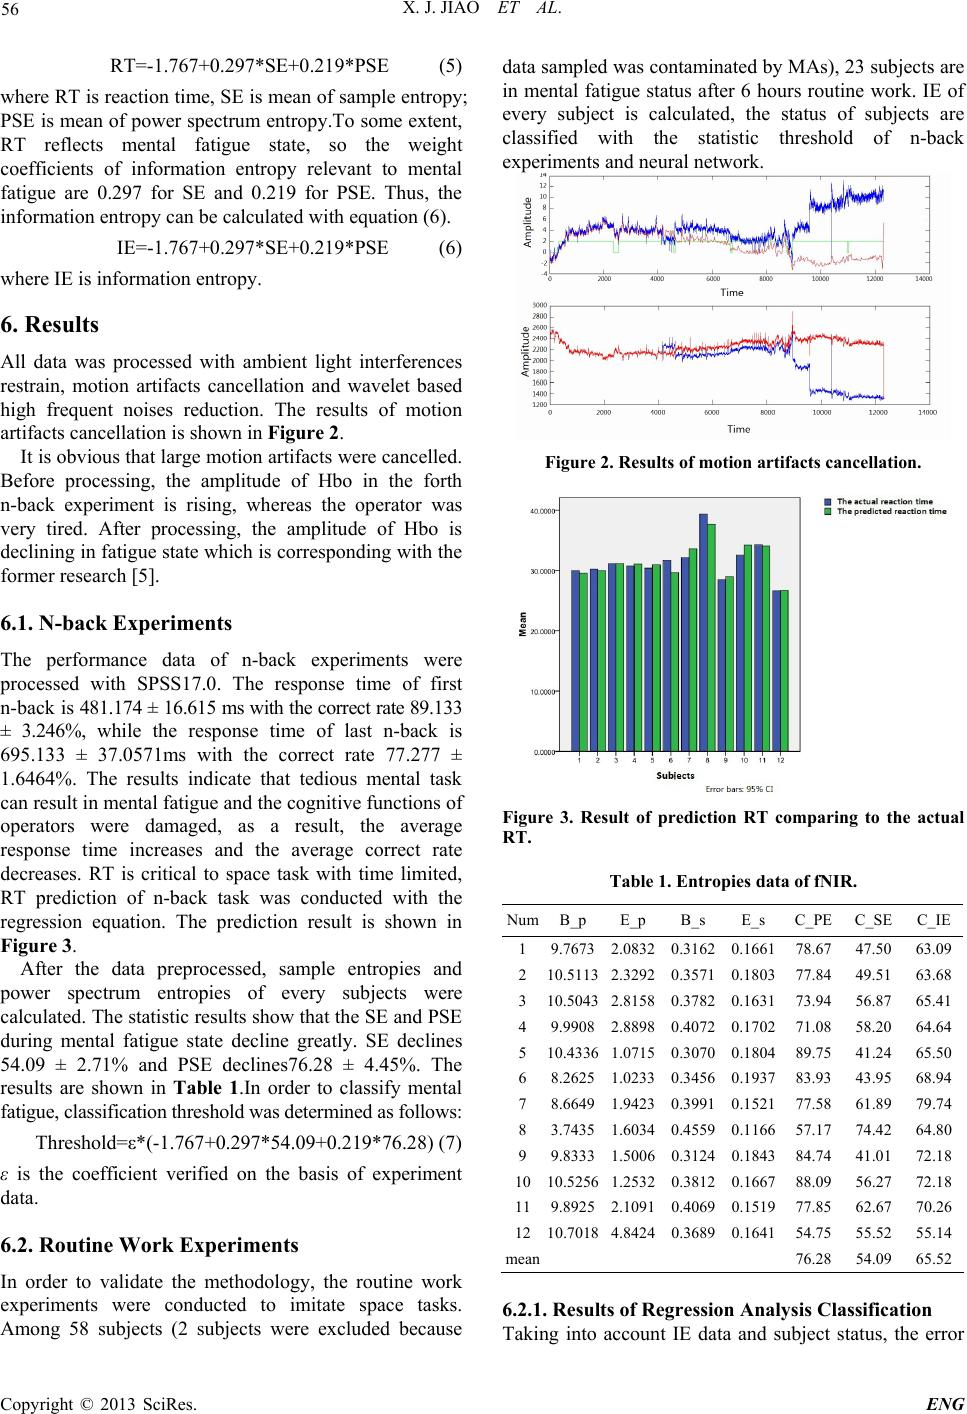 X. J. JIAO ET AL. 56 RT=-1.767+0.297*SE+0.219*PSE (5) where RT is reaction time, SE is mean of sample entropy; PSE is mean of power spectrum entropy.To some extent, RT reflects mental fatigue state, so the weight coefficients of information entropy relevant to mental fatigue are 0.297 for SE and 0.219 for PSE. Thus, the information entropy can be calculated with equation (6). IE=-1.767+0.297*SE+0.219*PSE (6) where IE is information entropy. 6. Results All data was processed with ambient light interferences restrain, motion artifacts cancellation and wavelet based high frequent noises reduction. The results of motion artifacts cancellation is shown in Fi gu re 2. It is obvious that large motion artifacts were cancelled. Before processing, the amplitude of Hbo in the forth n-back experiment is rising, whereas the operator was very tired. After processing, the amplitude of Hbo is declining in fatigue state which is corresponding with the former research [5]. 6.1. N-back Experiments The performance data of n-back experiments were processed with SPSS17.0. The response time of first n-back is 481.174 ± 16.615 ms with the correct rate 89.133 ± 3.246%, while the response time of last n-back is 695.133 ± 37.0571ms with the correct rate 77.277 ± 1.6464%. The results indicate that tedious mental task can result in mental fatigue and the cognitive functions of operators were damaged, as a result, the average response time increases and the average correct rate decreases. RT is critical to space task with time limited, RT prediction of n-back task was conducted with the regression equation. The prediction result is shown in Figure 3. After the data preprocessed, sample entropies and power spectrum entropies of every subjects were calculated. The statistic results show that the SE and PSE during mental fatigue state decline greatly. SE declines 54.09 ± 2.71% and PSE declines76.28 ± 4.45%. The results are shown in Table 1.In order to classify mental fatigue, classification threshold was determined as follows: Threshold=ε*(-1.767+0.297*54.09+0.219*76.28) (7) ε is the coefficient verified on the basis of experiment data. 6.2. Routine Work Experiments In order to validate the methodology, the routine work experiments were conducted to imitate space tasks. Among 58 subjects (2 subjects were excluded because data sampled was contaminated by MAs), 23 subjects are in mental fatigue status after 6 hours routine work. IE of every subject is calculated, the status of subjects are classified with the statistic threshold of n-back experiments and neural network. Figure 2. Results of motion artifacts cancellation. Figure 3. Result of prediction RT comparing to the actual RT. Table 1. Entropies data of fNIR. NumB_p E_p B_s E_s C_PE C_SEC_IE 1 9.76732.08320.31620.1661 78.67 47.5063.09 2 10.51132.32920.35710.1803 77.84 49.5163.68 3 10.50432.81580.37820.1631 73.94 56.8765.41 4 9.99082.88980.40720.1702 71.08 58.2064.64 5 10.43361.07150.30700.1804 89.75 41.2465.50 6 8.26251.02330.34560.1937 83.93 43.9568.94 7 8.66491.94230.39910.1521 77.58 61.8979.74 8 3.74351.60340.45590.1166 57.17 74.4264.80 9 9.83331.50060.31240.1843 84.74 41.0172.18 1010.52561.25320.38120.1667 88.09 56.2772.18 11 9.89252.10910.40690.1519 77.85 62.6770.26 1210.70184.84240.36890.1641 54.75 55.5255.14 mean 76.28 54.0965.52 6.2.1. Results of Regr ession Anal ys i s Classi fication Taking into account IE data and subject status, the error Copyright © 2013 SciRes. ENG 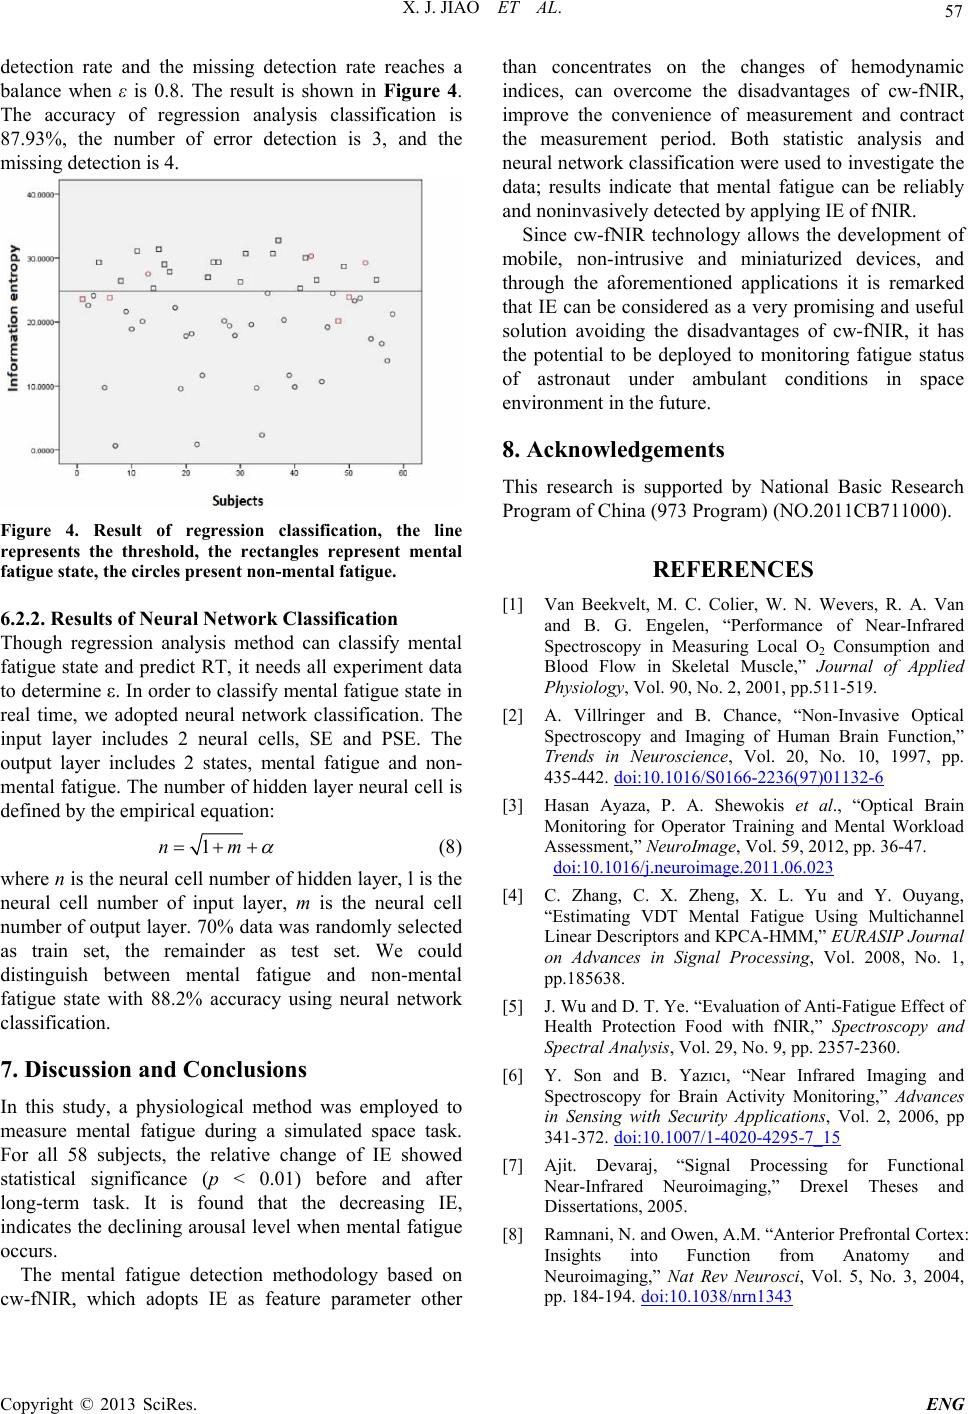 X. J. JIAO ET AL. Copyright © 2013 SciRes. ENG 57 detection rate and the missing detection rate reaches a balance when ε is 0.8. The result is shown in Figure 4. The accuracy of regression analysis classification is 87.93%, the number of error detection is 3, and the missing detection is 4. Figure 4. Result of regression classification, the line represents the threshold, the rectangles represent mental fatigue state, the circles present non-mental fatigue. 6.2.2. Results of Neur a l N etwork Classification Though regression analysis method can classify mental fatigue state and predict RT, it needs all experiment data to determine ε. In order to classify mental fatigue state in real time, we adopted neural network classification. The input layer includes 2 neural cells, SE and PSE. The output layer includes 2 states, mental fatigue and non- mental fatigue. The number of hidden layer neural cell is defined by the empirical equation: 1nm (8) where n is the neural cell number of hidden layer, l is the neural cell number of input layer, m is the neural cell number of output layer. 70% data was randomly selected as train set, the remainder as test set. We could distinguish between mental fatigue and non-mental fatigue state with 88.2% accuracy using neural network classification. 7. Discussion and Conclusions In this study, a physiological method was employed to measure mental fatigue during a simulated space task. For all 58 subjects, the relative change of IE showed statistical significance (p < 0.01) before and after long-term task. It is found that the decreasing IE, indicates the declining arousal level when mental fatigue occurs. The mental fatigue detection methodology based on cw-fNIR, which adopts IE as feature parameter other than concentrates on the changes of hemodynamic indices, can overcome the disadvantages of cw-fNIR, improve the convenience of measurement and contract the measurement period. Both statistic analysis and neural network classification were used to investigate the data; results indicate that mental fatigue can be reliably and noninvasively detected by applying IE of fNIR. Since cw-fNIR technology allows the development of mobile, non-intrusive and miniaturized devices, and through the aforementioned applications it is remarked that IE can be considered as a very promising and useful solution avoiding the disadvantages of cw-fNIR, it has the potential to be deployed to monitoring fatigue status of astronaut under ambulant conditions in space environment in the future. 8. Acknowledgements This research is supported by National Basic Research Program of China (973 Program) (NO.2011CB711000). REFERENCES [1] Van Beekvelt, M. C. Colier, W. N. Wevers, R. A. Van and B. G. Engelen, “Performance of Near-Infrared Spectroscopy in Measuring Local O2 Consumption and Blood Flow in Skeletal Muscle,” Journal of Applied Physiology, Vol. 90, No. 2, 2001, pp.511-519. [2] A. Villringer and B. Chance, “Non-Invasive Optical Spectroscopy and Imaging of Human Brain Function,” Trends in Neuroscience, Vol. 20, No. 10, 1997, pp. 435-442. doi:10.1016/S0166-2236(97)01132-6 [3] Hasan Ayaza, P. A. Shewokis et al., “Optical Brain Monitoring for Operator Training and Mental Workload Assessment,” NeuroImage, Vol. 59, 2012, pp. 36-47. doi:10.1016/j.neuroimage.2011.06.023 [4] C. Zhang, C. X. Zheng, X. L. Yu and Y. Ouyang, “Estimating VDT Mental Fatigue Using Multichannel Linear Descriptors and KPCA-HMM,” EURASIP Journal on Advances in Signal Processing, Vol. 2008, No. 1, pp.185638. [5] J. Wu and D. T. Ye. “Evaluation of Anti-Fatigue Effect of Health Protection Food with fNIR,” Spectroscopy and Spectral Analysis, Vol. 29, No. 9, pp. 2357-2360. [6] Y. Son and B. Yazıcı, “Near Infrared Imaging and Spectroscopy for Brain Activity Monitoring,” Advances in Sensing with Security Applications, Vol. 2, 2006, pp 341-372. doi:10.1007/1-4020-4295-7_15 [7] Ajit. Devaraj, “Signal Processing for Functional Near-Infrared Neuroimaging,” Drexel Theses and Dissertations, 2005. [8] Ramnani, N. and Owen, A.M. “Anterior Prefrontal Cortex: Insights into Function from Anatomy and Neuroimaging,” Nat Rev Neurosci, Vol. 5, No. 3, 2004, pp. 184-194. doi:10.1038/nrn1343 |