

Paper Menu >>
Journal Menu >>
 Engineering, 2013, 5, 25-30 doi:10.4236/eng.2013.55B006 Published Online May 2013 (http://www.scirp.org/journal/eng) Motion Classification Usi ng P ropos ed Pri nciple Component Analysis Hybrid K-Means Clustering* Ching Yee Yong, Rubita Sudirman, Nasrul Humaimi Mahmood, Kim Mey Chew Infocomm Research Alliance, Faculty of Electrical Engineerin g, Universiti Teknologi Malaysia, Johor, Malaysia Email: [email protected] Received 2013 ABSTRACT This study investigates and acts as a trial clinical outcome for human motion and behaviour analysis in consensus of health related quality of life in Malaysia. The proposed technique was developed to analyze and access the quality of human motion that can be used in hospitals, clinics and human motion researches. It aims to establish how to wide- spread the quality of life effects of human motio n. Reliability and v alidity are need ed to facilitate su bject outcomes. An experiment was set up in a laboratory environment with conjunction of analyzing human motion and its behaviour. Five classifiers and algorithms were used to recognize and classify the motion patterns. The proposed PCA-K-Means clus- tering took 0.058 seconds for classification process. Resubstitution error for the proposed technique was 0.002 and achieved 94.67% of true positive for total confusion matrix of the classification accuracy. The proposed clustering algo- rithm achieved higher speed of processing, higher accuracy of performance and reliable cross validation error. Keywords: Accelerometer; Gyroscope; Fuzzy; Bayes; Decision Tree 1. Introduction This study focuses on investigating the human motion and movement behavior through analyzing their jogging, walking and throwing patterns, to come out with a better solution for movement classification and nature behavior analysis. The methodology of this research is to get the motion pattern through few sensors attachment on skin for processing and analysis. The reviews from previous research on the requirement of experiment design and the current trend of analysis act as guidance to develop a good research fram e wor k. The objective of this study is to investigate the human motion and movement behavior in order to establish how widespread the quality of life effects of motion are by quantifying them. The expected results in terms of the stability, design, efficient control for mobility will help researchers to consider the outcomes of a human motion and movement. This paper presents a novel motion signal processing technique, and presents ideas for further de- velopment and recognition, to give researchers ideas of how they can use human movement in related field for product development. This paper is divided into six sections. The first sec- tion mainly introduces the whole study. It provides the general overview of the human motion analysis system. The second section includes the objectives of this study, which describes the aims that needed to be achieved. It also discusses the background studies, literature review and the basic concept in this study. Section 3 discusses about the study implementation and a specification of the experiment environment, thorough discussion on the de- velopmental technique or algorithm and analysis on hu- man motion. Finally, the last two sections provide the conclusions, future developments and possible enhance- ment and improvement. 2. Research Review Accelerometer, gyroscope and compass sensors are the most common devices used in movement detection and analysis system [1]. Introduction of human actions into digital domain is a primary driver for innovation of mo- tion functionality. Human motion signal processing tech- nique, which combines inertial measurement units with digital signal processing , enables people readily incorpo- rate motion [2,3]. Description in the next subsection pro- vides readers with understanding of the sensors combina- tions used in motion detection and analysis field [4,5]. 2.1. Accelerometer The primary usage of accelerometer is measuring linear acceleration and tilt while velocity can be obtained by a single integration and relative distance by a double inte- gration. The benefit of a accelerometer is that it able di- *Patterns classification using Proposed PCA-K-Means Classifier. Copyright © 2013 SciRes. ENG  C. Y. YONG ET AL. 26 rectly measure tilt angle and linear distance based on acceleration of gravity [6]. The main drawback of the sensor is it unable to distinguish between acceleration due to linear movement and acceleration due to gravity. Problem can be solved by combining accelerometer with gyroscope sensor. 2.2. Gyroscope Gyroscope is mainly used to measure absolute rate of rotation and relative angle by a single mathe matical inte- gration. The performance is fast and accurate without corrupted by linear acceleration or magnetic fields. However, sometimes the integration may lead to errors over time but it can be solved by combining with accel- erometer. 2.3. Pattern Recognition Pattern recognition consists of 6 stages: data collection, pre-processing, feature extraction, training, classification and cross validation [7-10]. Data are collected for training and training classifiers. In order to achieve accurate result, data size should be large enough to cover all relevant parameters. Training and testing data should be differen t. Pre-processing of signals aims to reduce noise and normalize interests in a data set. Feature extraction is a process to extract features that characterize the region of interests. There are many types of features such as histogram, shape information, texture information, scale invariant feature transform and many others. Principle Component Analysis (PCA) was used to reduce the number of variables, from six to three; to re- duce the complexity o f large data set. Classifiers are trained by training data set. There are two types of classifier: supervised and unsupervised learning. Classifiers used in this study are Fuzzy, pro- posed PCA-K-Means, C-Means, Naive Bayes and deci- sion tree. Classifier should not just memorize class labels of testing data. This gives 100% accuracy on training data, but may not work on other unseen data. Hence, novel testing data is used to test the performance of trained classifier that able to generalize to novel data. Cross validation aims to provide more thorough and accurate evaluation for the classification process. The large samples data are divided into a few subsets. The first subset is left out for testing and the rest are used for training. The process is repeated for each of the subset in turn. Average accuracies is achieved from all the runs and this is called N-fold cross validation. 3. Materials and Methods 3.1. Study Sample Five healthy volunteers were selected inside university campus for taking part in this study. Their ages are around 20 years old with normal limbs movement and significant mobility in everyday routine independent of any walking aid. 3.2. Experimental Setup For this study, experimental setup was done using a wire- less 3-axis accelerometer. This device employs a YEI 3-Space Sensor breakout board for the tri-axial gyro- scope, accelerometer, and compass sensors in conjunc- tion with advanced processing and on-board quaternion- based Kalman filtering algorithms to determine orienta- tion relative to an absolute reference in real-time in an enclosure measuring 60 mm × 35 mm × 15 mm. The device was connected to a laptop using a standard USB 2.0 host system wireless asynchronous serial transmis- sion. The subjects wore a wearable sensor on above right arm which employed of 3 sensors (gyroscope, acceler- ometer and compass) inside the package. These sensors were attached firmly on subjects’ skin with a special de- signed holder. 3.3. Data Collection and Management In the initial phase of the trial study, experiment was conducted for three activities, there are jogging, walking and throwing. Subjects were asked to perform a normal walking with speed 3.7 ft/s and jogging with speed 6.5 ft/s on a treadmill with regular motor. Throwing was performed by throwing a paper roll 1.50 m apart. These activities were performed in a supervised and comfort- able environment with presence of researcher for time- stamping the start and end time of activities period. Subjects were encouraged to perform the jogging, walk- ing and throwing activities at their own pace and conven- ience. The whole experiment setup place was ensuring a relaxing and natural mood for the sake of subjects for reflective of real world conditions. The data were transmitted from sensors to the laptop for further processin g . 3.4. Data Analysis Data were collected through transmission of a mini wire- less dongle from the sensors. They were pre-processing for noise elimination and then ex tracted for classification as below: 1) Fuzzy C-Means Clustering: This clustering is an it- erative process. The parameters required for this cluster- ing are numbers of cluster/class, exponent for the matrix partition, maximum number of iteration and minimum of improvement. First, an initial fuzzy partition matrix was generated and the initial fuzzy cluster centers were cal- culated. The cluster centers and the membership function Copyright © 2013 SciRes. ENG  C. Y. YONG ET AL. 27 were updated during each step of iteration to minimize the objective function for the best location for the clus- ters. The process stopped either once the maximum number of iterations was reached or the minimum amount of improvement specified between two consecu- tive objective fun c tions was achieved [11-14]. 2) PCA-K-Means Clustering: K-Means Clustering is a function partitions the N X P data matrix into K clus- ters/classes through a fully vectorized algo rithm. N is the number of data points while P is the number of variables. In this project, the sum of all points to cluster centroid was calculated using proposed Euclidean distances for all clusters. The Euclidean distance d between two vectors x and y is: d = sum ((x-y)2)1/2 (1) The function was returned the centroids locations for all the clusters until the minimum sums were achieved. PCA was hybrid with K-Means clustering to reduce the variables dimensions. 3) Naïve Bayes: Naive Bayes performs classification works based on diagonal covariance matrix estimations. This classifier assumes the variables are conditionally independent given the class label. It has been found to work well in practice for many large or small data sets. First the classifier was modelled using Gaussian distribu- tion and assumed that multivariate data has normal Gaussian distribution. Then, the classifier was enhanced using kernel density estimation, which is a more flexible nonparametric technique [15]. 4) Decision Tree: Decision Tree is an algorithm that following simple rules, such as “if the Y-axis gyroscope reading is less than 0.5898, then classify the data as Walking motion.” It is a nonparametric techniqu e since it does not require any assumptions about the distribution of the variables in each class. A set of rules was gener- ated by training data. Decision Tree used this set of rules to divide the plane and assign each data to each specific class [16-18]. 5) LDA and QDA: LDA is Linear Discriminant Analysis and QDA is Quadratic Discriminant Analysis. Data were classified using default LDA. Some data were misclassified by the LDA function with drawing X through the points. The function has separated the plane into region divided by lines, and assigned different re- gions to different classes. A grid was created for region visualization. For some data as for this project, the vari- ables were not separated well into the correct classes. Hence, QDA was proposed for the data. 3.5. Instrument Revision The preliminary set of outcome measures was shown in this paper. There are 2 sensors used in this experimental setup: gyroscope and accelerometer. The ability of the classifiers in differentiating jogging, walking and throw- ing patterns we re di st i ng ui shed in discussi on pa rt . Accelerations due to jolting of the sensors if loosely attached may add noise to the signal. The special de- signed of sensor holder capable attached firmly to the subject’s skin to avoid any disturbance. 4. Result and Discussion Results of the project were displayed in tabular and graphical form as Figure 1. Table 1 shows the time consumption for every classify- er used. Proposed PCA-K-Means clustering used 0.058 seconds for the whole pattern recognition process. It is the fastest classification process compared with Fuzzy C-Means (2.32 s), Naive Bayes (3.72 s), decision tree (3.16 s) and normal K-Means statistical toolbox (0.56 s). Table 2 shows the resubstitution and cross validation errors. PCA-K-Means achieved 0.002 and 0.328 for re- substitution and cross validation errors respectively. Table 3 shows the confusion matrix and total true positive for every algorithm used. PCA-K-Means and decision tree achieved the highest true positive (accuracy) percentage, 94.67% followed by Naive Bayes kernel density 86%, QDA 77%, Naive Bayes Gaussian kernel 75% and LDA 64.33%. -1 -0.500.5 1 -1 -0.8 -0.6 -0.4 -0.2 0 0.2 0.4 0.6 0.8 1 Accelerometer X-axis Acceleromter Y-axis Jogging Walking Thr ow ing -5 05 10 -4 -3 -2 -1 0 1 2 3 4 5 6 Gyro sco p e X-axis Gyroscope Y-axis Jogging Walking Thro win g Figure 1. Scatter plot for accelerometer and gyroscope data. Table 1. Time consumption for every classifier used. Classifier Processing Time (s) Fuzzy C-Means 2.317 PCA-K-Means (Proposed) 0.058 K-Means Statistical Toolbox0.565 Naïve Bayes 3.723 Decision Tree 3.165 Copyright © 2013 SciRes. ENG  C. Y. YONG ET AL. 28 Table 2. Resubstitution and cross validation errors for every algorithm. Algorithm Resubstitution Error (%) Cross Validation Error (%) PCA-K-Means (Proposed) 0.002 0.328 Linear Discriminant Analysis 0.357 0.423 Quadratic Discriminant Analysis 0.230 0.253 Naïve Bayes Gaussian Kernel 0.250 0.260 Naïve Bayes Kernel Density 0.140 0.183 Decision Tree 0.053 0.323 Table 3. Confusion matrix for every algorithm used. Algorithm Confusion Matrix True Positive (%) 100 0 0 11 89 0 PCA-K-Means (Proposed) 0 5 95 94.67 54 26 20 42 49 9 Linear Discriminant Analysis 4 6 90 64.33 51 33 16 13 86 1 Quadratic Discriminant Analysis 5 1 94 77.00 51 32 17 11 81 8 Naïve Bayes Gaussian Kernel 7 0 93 75.00 64 27 9 0 99 1 Naïve Bayes Kernel Density 3 2 95 86.00 94 4 2 3 96 1 Decision Tree 6 0 94 94.67 4.1. Fuzzy C-Means Clustering Figure 2 shows the initial and final fuzzy cluster centers. The bold number represents the final centers after up- dated from each iteration iteratively. Throwing always has the higher peak then followed by jogging and walk- ing for gyroscope values above 5g. 4.2. PCA-K-Means Clustering (Proposed) Figure 3 shows the final clusters centroids for all of the clusters. The bold “+” marks are the final updated cen- troids locations for every cluster. 4.3. Naïve Bayes Gaussian distribution and kernel density were hybrid with Naive Bayes for classification. As shown in Table 2, errors of resubstitutio n an d cro ss validation were redu ced for kernel density due to its flexibility characteristic. -1 -0.500.5 1 -1 -0.5 0 0.5 1 AX AZ 1 2 3 1 23 -1 -0.500.5 1 -3 -2 -1 0 1 2 3 4 5 6 AX GX 1 2 31 2 3 -1 -0.5 00.5 1 -4 -2 0 2 4 6 AX GZ 1 2 31 2 3 -1 -0.500.5 1 -3 -2 -1 0 1 2 3 4 5 6 AZ GX 1 2 3 1 2 3 -1 -0.500.5 1 -4 -2 0 2 4 6 AZ GZ 1 2 3 1 2 3 -5 05 10 -4 -2 0 2 4 6 G X GZ 1 2 3 1 2 3 Figure 2. 2D initial and final fuzzy cluster centers for two characteristics (AX-AZ, AX-GX, AX-GZ, AZ-GX, AZ-GZ, GX-GZ) of the three types of motions (Walking in red, Jog- ging in green and Throwing in blue). -1-0.8 -0.6 -0.4 -0.200.2 0.4 0.6 0.81 -1 -0.8 -0.6 -0.4 -0.2 0 0.2 0.4 0.6 0.8 1 Jogging Walking Thr ow ing Figure 3. 2D final cluste r plot with updated centroids of the three types of motions. 4.4. Decision Tree Initially, a full 12 level of pruning with 30 terminal nodes cluttered-looking tree was generated after a series of rules was applied to each data. The data were then per- formed resubstitution and cross validation error to create a simplest and smallest tree as in Fi gure 4. 4.5. LDA and QDA For data from this study, LDA was not an appropriate algorithm for classification. QDA perform a quadratic analysis to the data and the resu bstitution error and cross validation error were reduced. Copyright © 2013 SciRes. ENG 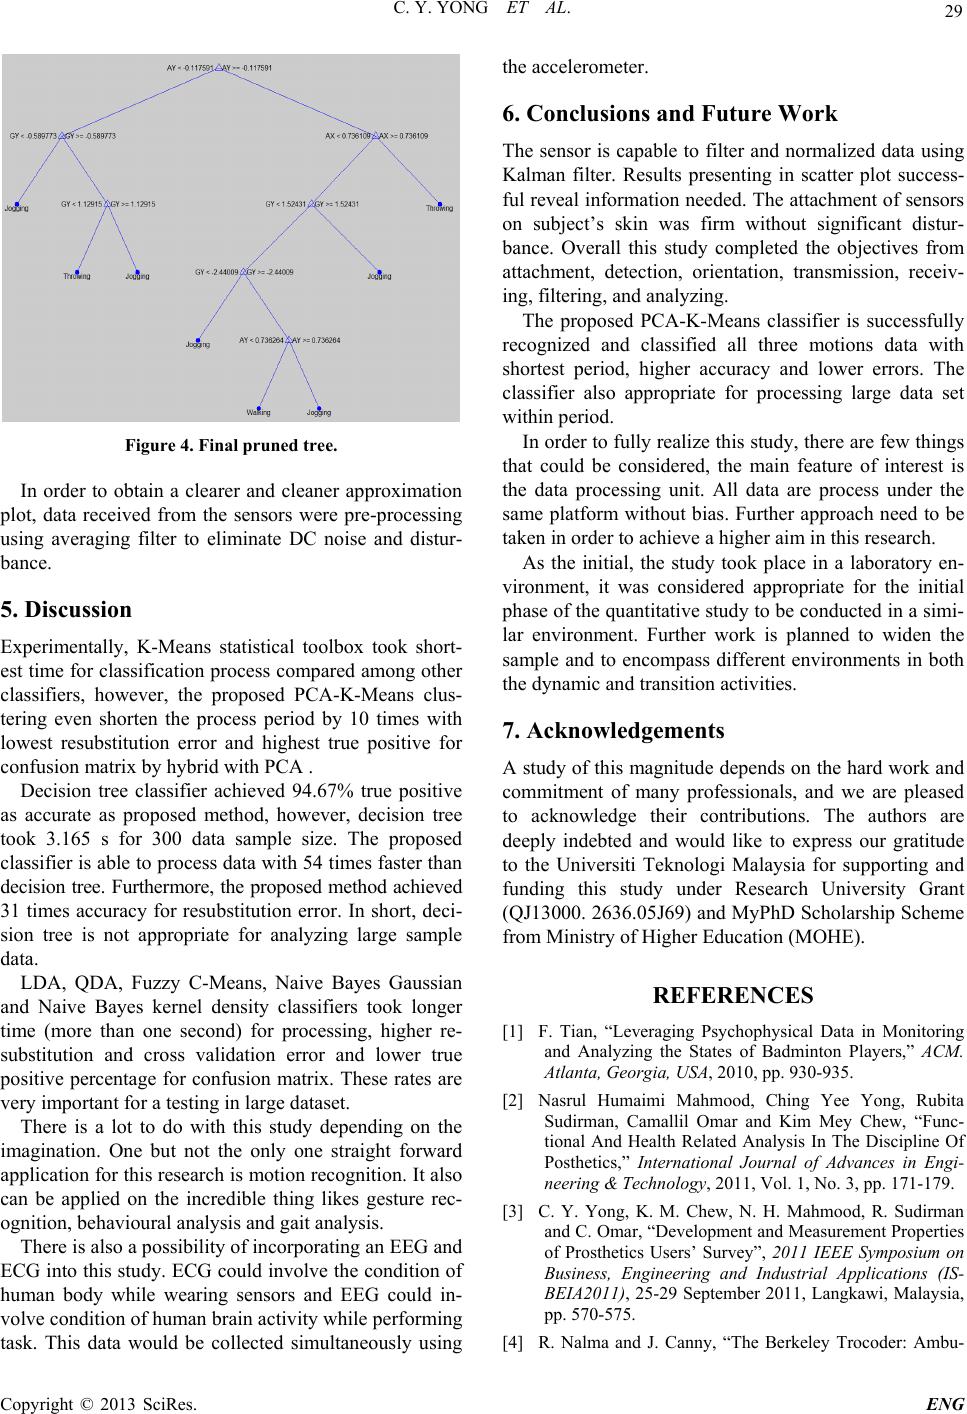 C. Y. YONG ET AL. 29 Figure 4. Final pruned tr e e. In order to obtain a clearer and cleaner approximation plot, data received from the sensors were pre-processing using averaging filter to eliminate DC noise and distur- bance. 5. Discussion Experimentally, K-Means statistical toolbox took short- est time for classification process compared among other classifiers, however, the proposed PCA-K-Means clus- tering even shorten the process period by 10 times with lowest resubstitution error and highest true positive for confusion matrix by hybrid with PCA . Decision tree classifier achieved 94.67% true positive as accurate as proposed method, however, decision tree took 3.165 s for 300 data sample size. The proposed classifier is able to process data with 54 times faster than decision tree. Furthermore, the proposed method achieved 31 times accuracy for resubstitution error. In short, deci- sion tree is not appropriate for analyzing large sample data. LDA, QDA, Fuzzy C-Means, Naive Bayes Gaussian and Naive Bayes kernel density classifiers took longer time (more than one second) for processing, higher re- substitution and cross validation error and lower true positive percentage for confusion matrix. These rates are very important for a testing in large dataset. There is a lot to do with this study depending on the imagination. One but not the only one straight forward application for this research is motion recognition . It also can be applied on the incredible thing likes gesture rec- ognition, behavioural analysis and gait analysis. There is also a possibility of in corp orating an EEG and ECG into this study. ECG could involve the con dition of human body while wearing sensors and EEG could in- volve condition of human brain activity while performing task. This data would be collected simultaneously using the accelerometer. 6. Conclusions and Future Work The sensor is capable to filter and normalized data using Kalman filter. Results presenting in scatter plot success- ful reveal information needed. The attachment of sensors on subject’s skin was firm without significant distur- bance. Overall this study completed the objectives from attachment, detection, orientation, transmission, receiv- ing, filtering, and analyzing. The proposed PCA-K-Means classifier is successfully recognized and classified all three motions data with shortest period, higher accuracy and lower errors. The classifier also appropriate for processing large data set within period. In order to fully realize this study, there are few things that could be considered, the main feature of interest is the data processing unit. All data are process under the same platform without bias. Further approach need to be taken in order to achieve a higher aim in this research. As the initial, the study took place in a laboratory en- vironment, it was considered appropriate for the initial phase of the quantitativ e study to be conducted in a simi- lar environment. Further work is planned to widen the sample and to encompass different environments in both the dynamic and transition activities. 7. Acknowledgements A study of this magnitude depends on the hard work and commitment of many professionals, and we are pleased to acknowledge their contributions. The authors are deeply indebted and would like to express our gratitude to the Universiti Teknologi Malaysia for supporting and funding this study under Research University Grant (QJ13000. 2636.05J69) and MyPhD Scholarship Scheme from Ministry of Higher Education (MOHE). REFERENCES [1] F. Tian, “Leveraging Psychophysical Data in Monitoring and Analyzing the States of Badminton Players,” ACM. Atlanta, Georgia, USA, 2010, pp. 930-935. [2] Nasrul Humaimi Mahmood, Ching Yee Yong, Rubita Sudirman, Camallil Omar and Kim Mey Chew, “Func- tional And Health Related Analysis In The Discipline Of Posthetics,” International Journal of Advances in Engi- neering & Technology, 2011, Vol. 1, No. 3, pp. 171-179. [3] C. Y. Yong, K. M. Chew, N. H. Mahmood, R. Sudirman and C. Omar, “Development and Measurement Properties of Prosthetics Users’ Survey”, 2011 IEEE Symposium on Business, Engineering and Industrial Applications (IS- BEIA2011), 25-29 September 2011, Langkawi, Malaysia, pp. 570-575. [4] R. Nalma and J. Canny, “The Berkeley Trocoder: Ambu- Copyright © 2013 SciRes. ENG  C. Y. YONG ET AL. Copyright © 2013 SciRes. ENG 30 latory Health Monitoring,” 2009 Sixth International Workshop on Wearable and Implantable Body Sensor Networks, 2009, pp. 53-58. [5] U. Maurer, A. Smailagic and D. P. Siewiorek, “Activity Recognition and Monitoring Using Multiple Sensors on Different Body Positions,” International Workshop on Wearable and Implantable Body Sensor Networks, 2006. doi:10.1109/BSN.2006.6 [6] C. Y. Yong, Rubita Sudirman and Kim Mey Chew, “Mo- tion Detection and Analysis with Four Different Detec- tors,” 2011 Third International Conference on Computa- tional Intelligence, Modelling & Simulation (CIMSim 2011), Langkawi, Malaysia, 20-22 September 2011, pp. 46-50. [7] C. Ni Scanail, B. Ahearne and G. M. Lyons, “Long-term Telemonitoring of Mobility Trends of Elderly People Using SMS Messaging,” IEEE Trans Inform Tech Bio- med, 2006, Vol. 10, pp. 34-37. [8] A. Godfrey, K. M. Culhane and G. M. Lyons, “Compari- son of the Performance of the Active PALTM Trio Profes- sional Physical Activity Logger to a Discrete Acceler- ometer-Based Activity Monitor,” Medical Engineering & Physic, 2006. [9] A. C. Bovik, M. Clark and W. S. Geisler, “Multichannel Texture Analysis Using Localized Spatial Filters,” IEEE Trans. On Pattern Analysis and Machine Intelligence, 1990, Vol. 12, No. 1, pp. 55-73. doi:10.1109/34.41384 [10] G. R. Cross and A. K. Jain, “Markov Random Field Tex- ture Models,” IEEE Trans. On Pattern Analysis and Ma- chine Intelligence, Vol. 5, 1983, pp. 25-39. doi:10.1109/TPAMI.1983.4767341 [11] R. O. Duda, P. E. Hart and D. G. Stork, “Pattern Classifi- cation,” John Wiley & Sons, 2 edition, 2001. [12] D. G. Lowe, “Object Recognition from Local Sclae-Invariant Features,” In Proc. Int. Conf. on Com- puter Vision, Vol. 2, 1999, pp. 1150-1157. [13] M. Vangelis, A. Ion and P. Geogios, “Spam Filtering with Naive Bayes-Which Naive Bayes?” Third Conference on Email and Anti-Spam, 2006. [14] H. Spath, “Cluster Dissection and Analysis: Theory,” FORTRAN Programs, Examples. Translated by J. Gold- schmidt, New York: Halsted Press, 1985. [15] J.-S. R. Jang and C.-T. Sun, “Neuro-Fuzzy Modeling and Control,” Proceedings of the IEEE, 1995. [16] L. Breiman, J. Friedman, R. Olshen and C. Stone, Classi- fication and Regression Trees. Boca Raton, FL: CRC Press, 1984. [17] Ching Yee Yong, K. M. Chew, N. H. Mahmood and I. Ariffin, “Image Processing Tools Package in Medical Imaging in MATLAB,” International Journal of Educa- tion and Information Technologies, North Atlantic Uni- versity Union, NAUN, Vol. 6, No. 3, 2012, pp. 260 -268. [18] Ching Yee Yong, R. Sudirman, N. H. Mahmood, K. M. Chew, A. H. AB Rahim and M. N. H. Zainudin, “Time-Frequ ency Domain and Spectrogram Distribution for Human Motion and Movement Behaviour Analysis,” icbeb 2012 International Conference on Biomedical Engineering and Biotechnology, 2012, pp. 943-946. |