

Paper Menu >>
Journal Menu >>
 Open Journal of Fluid Dynamics, 2013, 3, 42-47 http://dx.doi.org/10.4236/ojfd.2013.32A007 Published Online July 2013 (http://www.scirp.org/journal/ojfd) Numerical Study on Transonic Flow with Local Occurrence of Non-Equilibrium Condensation Shigeru Matsuo1, Kazuyuki Yokoo2, Junj i Nagao2, Yushiro Nishiyama2, Toshiaki Setoguchi3, Heuy Dong Kim4, Shen Yu5 1Department of Advanced Technology Fusion, Saga University, Saga, Japan 2Graduate School of Science & Engineering, Saga University, Saga, Japan 3Institute of Ocean Energy, Saga University, Saga, Japan 4School of Mechanical Engineering, Andong National University, Andong, Korea 5Institute of Engineering Thermophysics, Chinese Academy of Science, Beijing, China Email: [email protected] Received May 24, 2013; revised June 1, 2013; accepted June 8, 2013 Copyright © 2013 Shigeru Matsuo et al. This is an open access article distributed under the Creative Commons Attribution License, which permits unrestricted use, distribution, and reproduction in any medium, provided the original work is properly cited. ABSTRACT Characteristics of transonic flow over an airfoil are determined by a shock wave standing on the suction surface. In this case, the shock wave/boundary layer interaction becomes complex because an adverse pressure gradient is imposed by the shock wave on the boundary layer. Several types of passive control techniques have been applied to shock wave/boundary layer interaction in the transonic flow. Furthermore, possibilities for the control of flow fields due to non-equilibrium condensation have been shown so far, and in this flow field, non-equilibrium condensation occurs across the passage of the nozzle and it causes the total pressure loss in the flow field. However, local occurrence of non-equilibrium condensation in the flow field may change the characteristics of total pressure loss compared with that by non-equilibrium condensation across the passage of flow field and there are few for researches of locally occurred non-equilibrium condensation in a transonic flow field. The purpose of this study is to clarify the effect of locally oc- curred non-equilibrium condensation on the shock strength and total pressure loss on a transonic internal flow field with circular bump. As a result, it was found that shock strength in case with local occurrence of non-equilibrium condensa- tion is reduced compared with that of no condensation. Further, the amount of increase in the total pressure loss in case with local occurrence of non-equilibrium condensation was also reduced compared with that by non-equilibrium con- densation across the passage of flow field. Keywords: Compressible; Transonic; Shock Wave; Non-Equilibrium Condensation; Simulation 1. Introduction A shock wave standing on the suction surface of airfoils determines the characteristics of transonic flow field. In this case, the shock wave imposes an adverse pressure gradient on the boundary layer and it makes the shock wave/boundary layer interaction complex. Several types of passive control techniques have been proposed to con- trol the shock wave/boundary layer interaction in the transonic flow field. For instance, Bahi et al. [1] and Raghunathan [2] described that a porous wall and cavity system that applied at the foot of the shock wave was effective in decreasing undesirable adverse pressure gra- dient of the shock wave/boundary layer interaction. However, this control method essentially leads to large viscous losses caused by the porous walls. These losses may be greater than the control benefit of the shock wave. Thus, the method cannot be generalized as an effective method. In order to overcome the above demerits, Saida et al. [3] proposed several techniques and showed that the porous wall with a cavity and vortex generator to the shock wave/boundary layer interaction was effective method to reduce the wave drag and suppress the devel- opment of the boundary layer. Further, Raghunathan [4] and O'Rourke et al. [5] reported that the passive control using the porous wall with a cavity and vortex control jets upstream of porous wall might be effective control method for the shock position and pressure gradient. Furthermore, the control method using non-equilib- rium condensation has been proposed by several re- C opyright © 2013 SciRes. OJFD 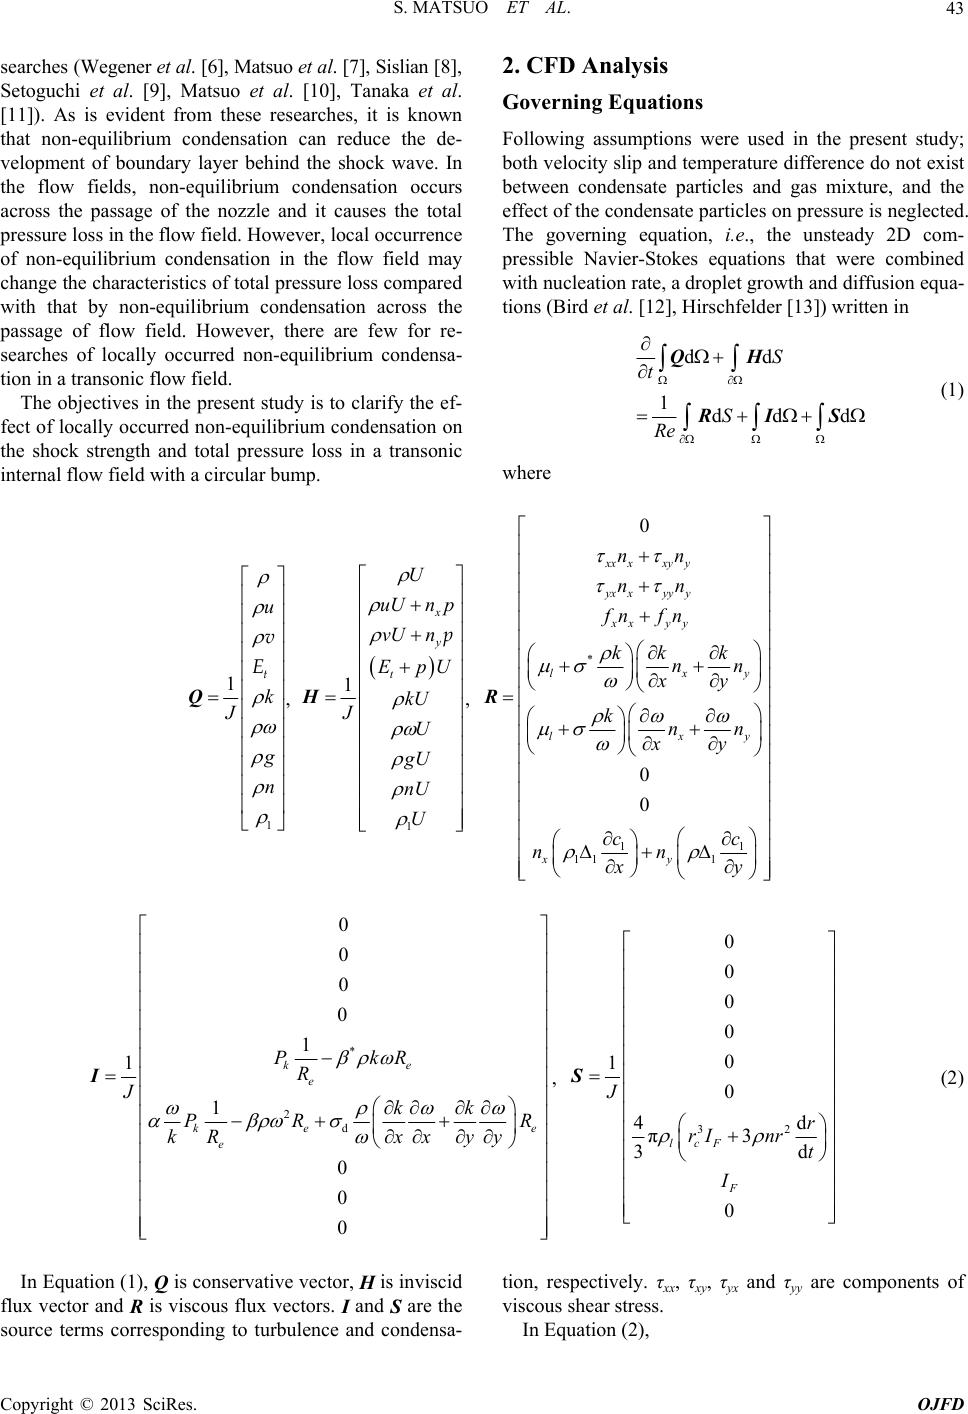 S. MATSUO ET AL. 43 searches (Wegener et al. [6], Matsuo et al. [7], Sislian [8], Setoguchi et al. [9], Matsuo et al. [10], Tanaka et al. [11]). As is evident from these researches, it is known that non-equilibrium condensation can reduce the de- velopment of boundary layer behind the shock wave. In the flow fields, non-equilibrium condensation occurs across the passage of the nozzle and it causes the total pressure loss in the flow field. However, local occurrence of non-equilibrium condensation in the flow field may change the characteristics of total pressure loss compared with that by non-equilibrium condensation across the passage of flow field. However, there are few for re- searches of locally occurred non-equilibrium condensa- tion in a transonic flow field. The objectives in the present study is to clarify the ef- fect of locally occurred non-equilibrium condensation on the shock strength and total pressure loss in a transonic internal flow field with a circular bump. 2. CFD Analysis Governing Equations Following assumptions were used in the present study; both velocity slip and temperature difference do not exist between condensate particles and gas mixture, and the effect of the condensate particles on pressure is neglected. The governing equation, i.e., the unsteady 2D com- pressible Navier-Stokes equations that were combined with nucleation rate, a droplet growth and diffusion equa- tions (Bird et al. [12], Hirschfelder [13]) written in dd 1dd d S t S Re QH RI S (1) where 1 1k J u g n Q t v E , 1 1 x y t uU n p vU n EpU kU JU gU nU U H p U , * 11 11 1 0 0 0 xx xxyy yx xyyy xx yy lx lx xy nn nn fn fn kk k nn xy knn xy cc nn xy y y R * 2 d 0 0 0 0 1 1 1 0 0 0 ke e ke e R e PkR R Jkk PR k Rxxyy I, 32 0 0 0 0 0 1 0 4d π3 3d 0 lcF F J r rInr t I S (2) In Equation (1), Q is conservative vector, H is inviscid flux vector and R is viscous flux vectors. I and S are the source terms corresponding to turbulence and condensa- tion, respectively. τxx, τxy, τyx and τyy are components of viscous shear stress. In Equation (2), Copyright © 2013 SciRes. OJFD 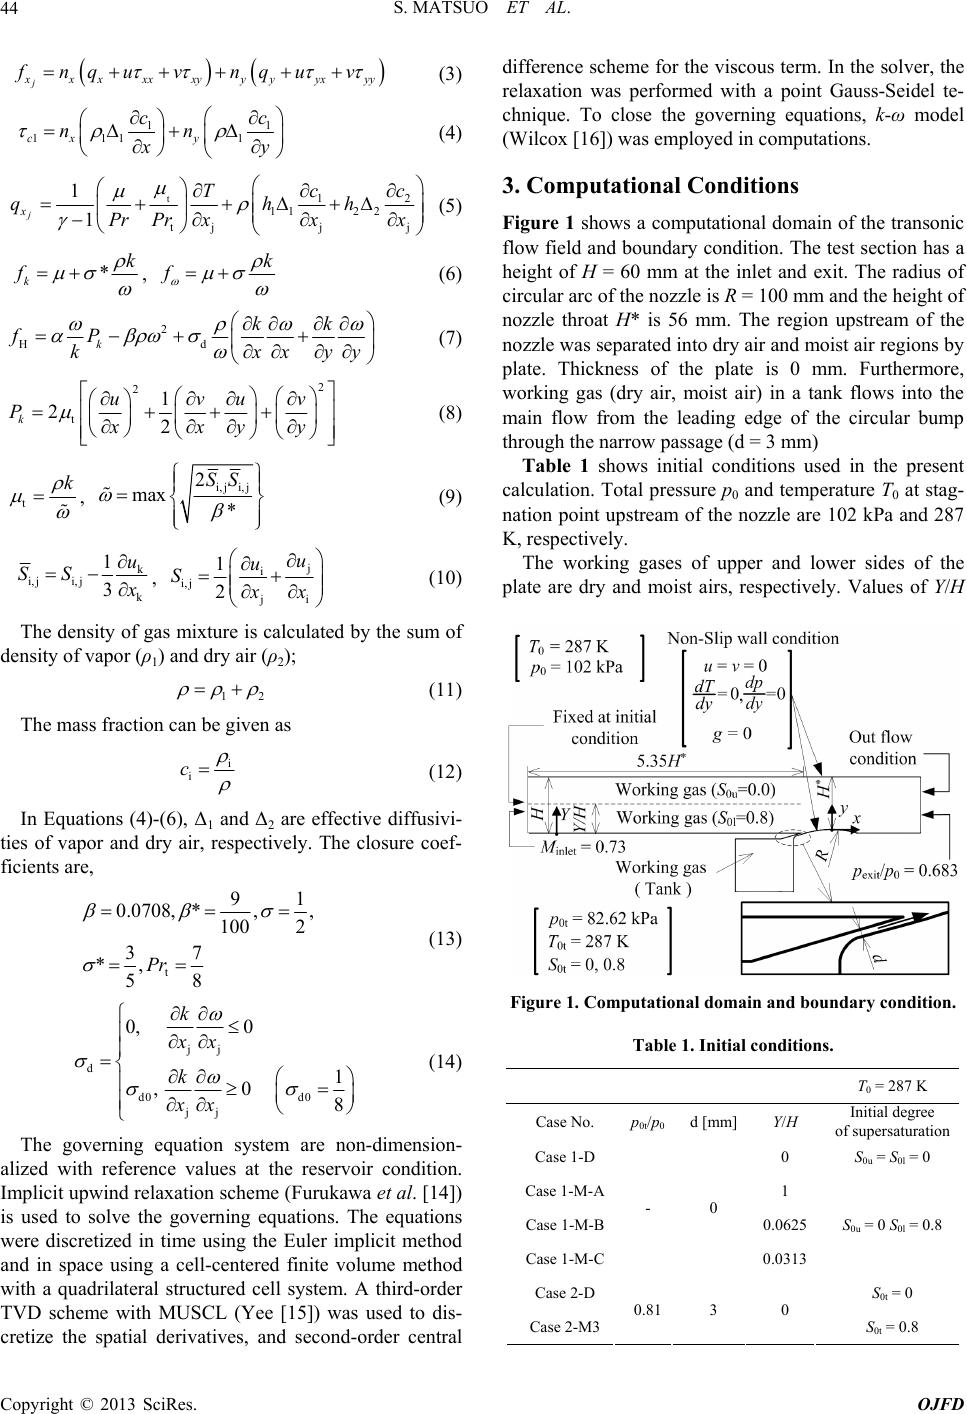 S. MATSUO ET AL. 44 j x xxxx xy yyyx yy fnqu vnquv (3) 1 111 1cx y cc nn 1 x y (4) t12 112 2 tjj j 1 1 j x cc T qh Pr Prxxx h (5) * k k f , k f (6) 2 Hdk kk fP kxxyy (7) 2 2 t 1 22 k uvuv Pxxyy (8) t k , i, ji, j 2 max * SS (9) k i, ji, j k 1 3 u SS x , j i i, j ji 1 2 u u S x x 2 (10) The density of gas mixture is calculated by the sum of density of vapor (ρ1) and dry air (ρ2); 1 (11) The mass fraction can be given as i i c (12) In Equations (4)-(6), Δ1 and Δ2 are effective diffusivi- ties of vapor and dry air, respectively. The closure coef- ficients are, t 91 0.0708,*,, 100 2 37 *, 58 Pr (13) jj d d0 d0 jj 0, 0 1 ,08 k xx k xx (14) The governing equation system are non-dimension- alized with reference values at the reservoir condition. Implicit upwind relaxation scheme (Furukawa et al. [14]) is used to solve the governing equations. The equations were discretized in time using the Euler implicit method and in space using a cell-centered finite volume method with a quadrilateral structured cell system. A third-order TVD scheme with MUSCL (Yee [15]) was used to dis- cretize the spatial derivatives, and second-order central difference scheme for the viscous term. In the solver, the relaxation was performed with a point Gauss-Seidel te- chnique. To close the governing equations, k-ω model (Wilcox [16]) was employed in computations. 3. Computational Conditions Figure 1 shows a computational domain of the transonic flow field and boundary condition. The test section has a height of H = 60 mm at the inlet and exit. The radius of circular arc of the nozzle is R = 100 mm and the height of nozzle throat H* is 56 mm. The region upstream of the nozzle was separated into dry air and moist air regions by plate. Thickness of the plate is 0 mm. Furthermore, working gas (dry air, moist air) in a tank flows into the main flow from the leading edge of the circular bump through the narrow passage (d = 3 mm) Table 1 shows initial conditions used in the present calculation. Total pressure p0 and temperature T0 at stag- nation point upstream of the nozzle are 102 kPa and 287 K, respectively. The working gases of upper and lower sides of the plate are dry and moist airs, respectively. Values of Y/H Figure 1. Computational domain and boundary condition. Table 1. Initial conditions. T0 = 287 K Case No. p0t/p0d [mm] Y/H Initial degree of supersaturation Case 1-D 0 S0u = S0l = 0 Case 1-M-A1 Case 1-M-B0.0625 Case 1-M-C - 0 0.0313 S0u = 0 S0l = 0.8 Case 2-D S0t = 0 Case 2-M3 0.813 0 S0t = 0.8 Copyright © 2013 SciRes. OJFD 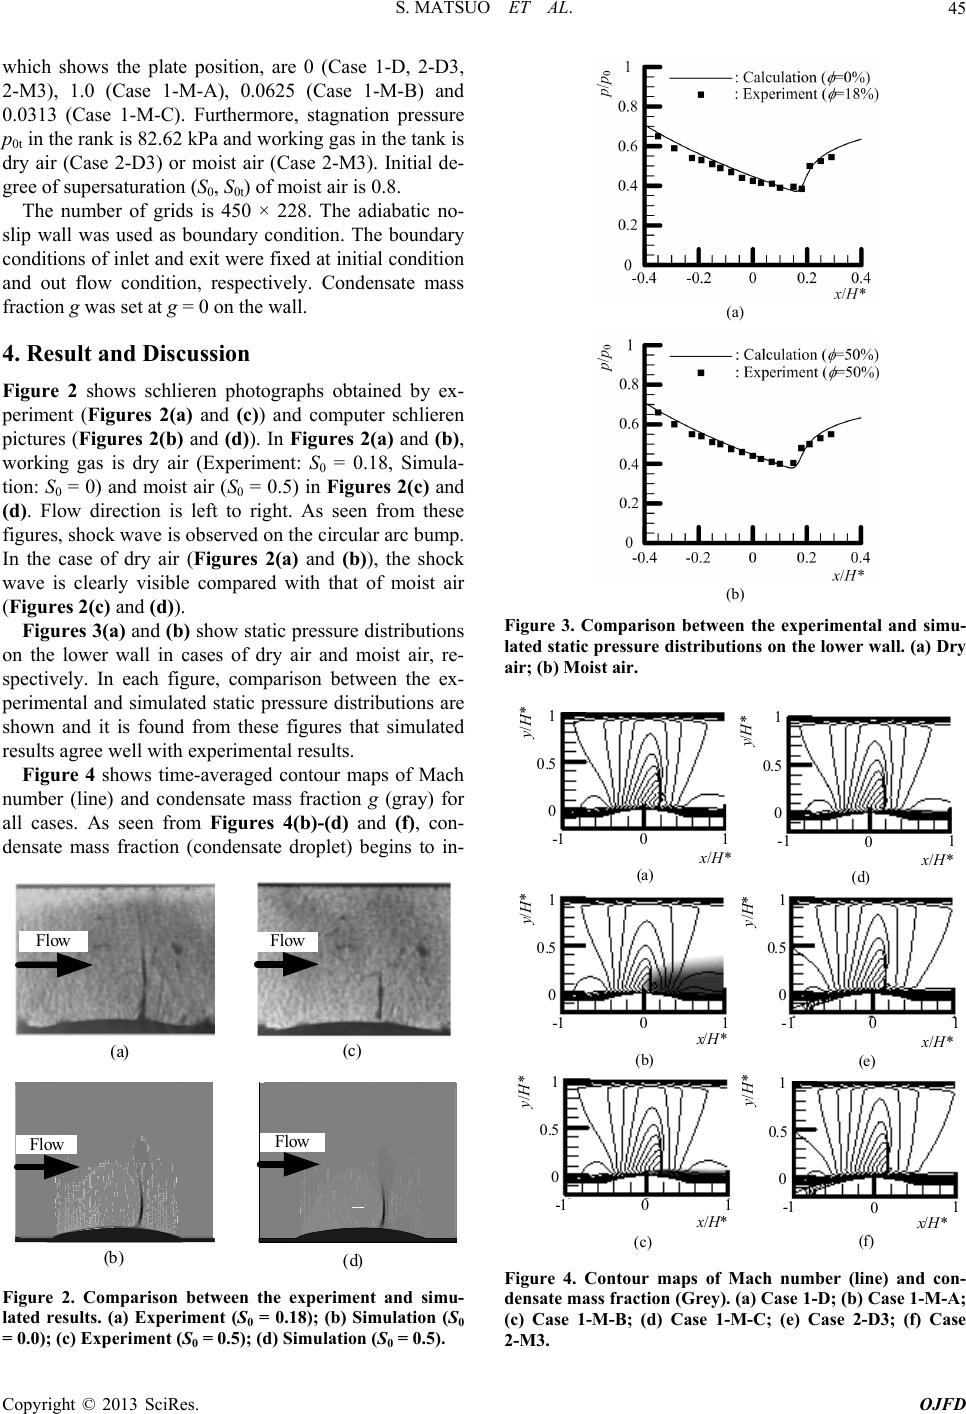 S. MATSUO ET AL. 45 which shows the plate position, are 0 (Case 1-D, 2-D3, 2-M3), 1.0 (Case 1-M-A), 0.0625 (Case 1-M-B) and 0.0313 (Case 1-M-C). Furthermore, stagnation pressure p0t in the rank is 82.62 kPa and working gas in the tank is dry air (Case 2-D3) or moist air (Case 2-M3). Initial de- gree of supersaturation (S0, S0t) of moist air is 0.8. The number of grids is 450 × 228. The adiabatic no- slip wall was used as boundary condition. The boundary conditions of inlet and exit were fixed at initial condition and out flow condition, respectively. Condensate mass fraction g was set at g = 0 on the wall. 4. Result and Discussion Figure 2 shows schlieren photographs obtained by ex- periment (Figures 2(a) and (c)) and computer schlieren pictures (Figures 2(b) and (d)). In Figures 2(a) and (b), working gas is dry air (Experiment: S0 = 0.18, Simula- tion: S0 = 0) and moist air (S0 = 0.5) in Figures 2(c) and (d). Flow direction is left to right. As seen from these figures, shock wave is observed on the circular arc bump. In the case of dry air (Figures 2(a) and (b)), the shock wave is clearly visible compared with that of moist air (Figures 2(c ) and (d)). Figures 3(a) and (b) show static pressure distributions on the lower wall in cases of dry air and moist air, re- spectively. In each figure, comparison between the ex- perimental and simulated static pressure distributions are shown and it is found from these figures that simulated results agree well with experimental results. Figure 4 shows time-averaged contour maps of Mach number (line) and condensate mass fraction g (gray) for all cases. As seen from Figures 4(b)-(d) and (f), con- densate mass fraction (condensate droplet) begins to in- Flow (a) (c) Flow (b) (d) Flow Flow Figure 2. Comparison between the experiment and simu- lated results. (a) Experiment (S0 = 0.18); (b) Simulation (S0 = 0.0); (c) Experiment (S0 = 0.5); (d) Simulation (S0 = 0.5). (a) (b) Figure 3. Comparison between the experimental and simu- lated static pressure distributions on the lower wall. (a) Dry air; (b) Moist air. x/H* y/H* (a) x/H* y/H* (b) x/H* y/H* (c) x/H* y/H* (d) x/H* y/H* (e) x/H* y/H* (f) -10 1 0 0.5 1 -1 01 0 0.5 1 -10 1 0 0.5 1 -1 01 0 0.5 1 -1 01 0 0.5 1 -1 01 0 0.5 1 Figure 4. Contour maps of Mach number (line) and con- densate mass fraction (Grey). (a) Case 1-D; (b) Case 1-M-A; (c) Case 1-M-B; (d) Case 1-M-C; (e) Case 2-D3; (f) Case 2-M3. Copyright © 2013 SciRes. OJFD 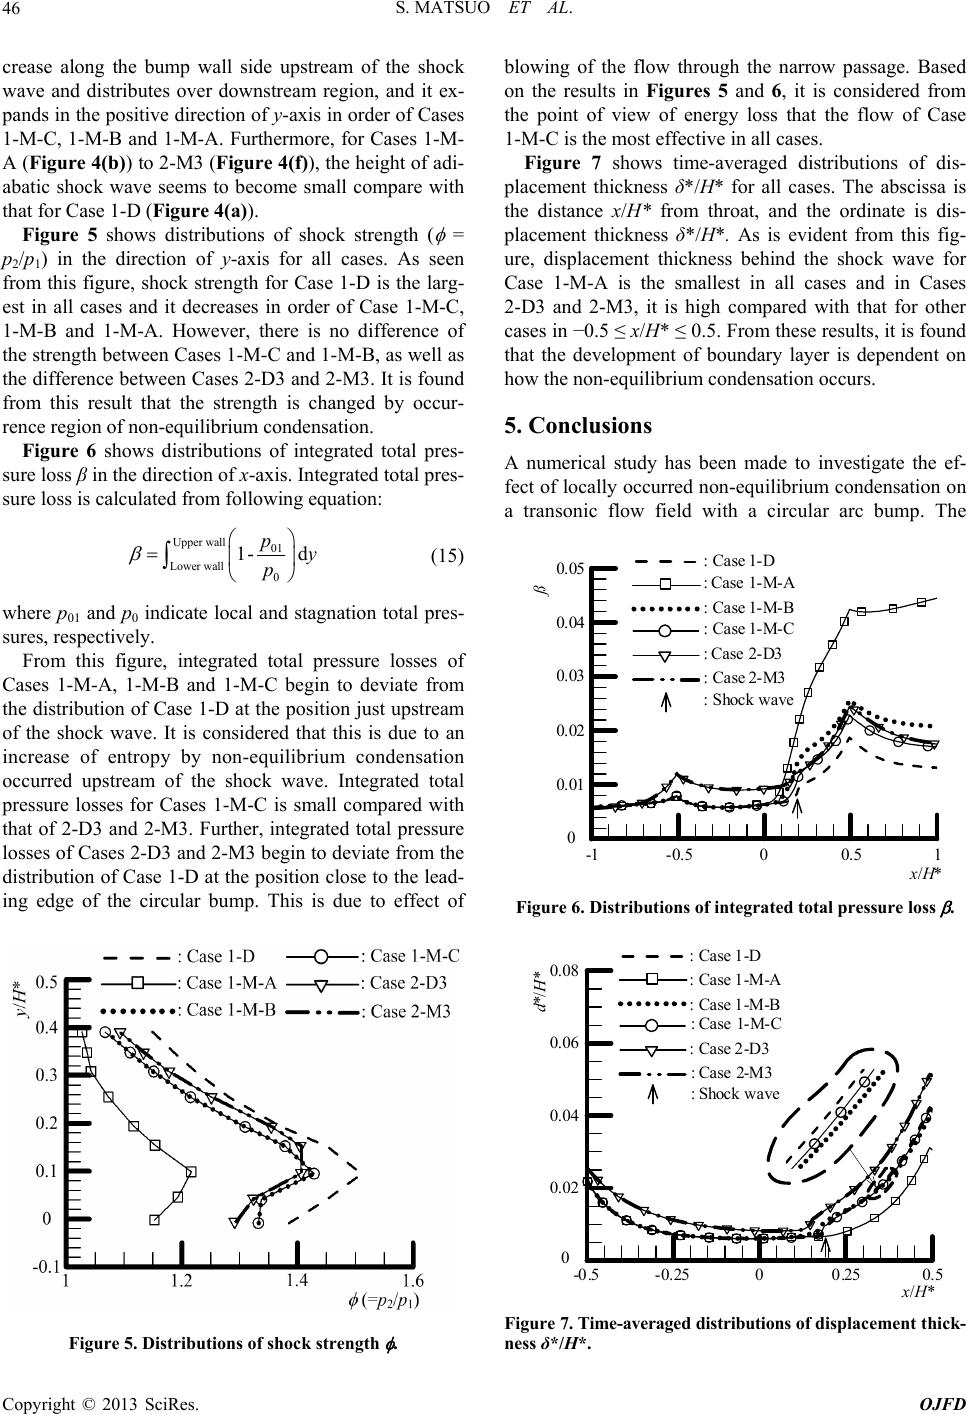 S. MATSUO ET AL. 46 crease along the bump wall side upstream of the shock wave and distributes over downstream region, and it ex- pands in the positive direction of y-axis in order of Cases 1-M-C, 1-M-B and 1-M-A. Furthermore, for Cases 1-M- A (Figure 4(b)) to 2-M3 (Figure 4(f)), the height of adi- abatic shock wave seems to become small compare with that for Case 1-D (Figure 4(a )). Figure 5 shows distributions of shock strength ( = p2/p1) in the direction of y-axis for all cases. As seen from this figure, shock strength for Case 1-D is the larg- est in all cases and it decreases in order of Case 1-M-C, 1-M-B and 1-M-A. However, there is no difference of the strength between Cases 1-M-C and 1-M-B, as well as the difference between Cases 2-D3 and 2-M3. It is found from this result that the strength is changed by occur- rence region of non-equilibrium condensation. Figure 6 shows distributions of integrated total pres- sure loss β in the direction of x-axis. Integrated total pres- sure loss is calculated from following equation: Upper wall01 Lower wall0 1- d py p (15) where p01 and p0 indicate local and stagnation total pres- sures, respectively. From this figure, integrated total pressure losses of Cases 1-M-A, 1-M-B and 1-M-C begin to deviate from the distribution of Case 1-D at the position just upstream of the shock wave. It is considered that this is due to an increase of entropy by non-equilibrium condensation occurred upstream of the shock wave. Integrated total pressure losses for Cases 1-M-C is small compared with that of 2-D3 and 2-M3. Further, integrated total pressure losses of Cases 2-D3 and 2-M3 begin to deviate from the distribution of Case 1-D at the position close to the lead- ing edge of the circular bump. This is due to effect of Figure 5. Distributions of shock strength . blowing of the flow through the narrow passage. Based on the results in Figures 5 and 6, it is considered from the point of view of energy loss that the flow of Case 1-M-C is the most effective in all cases. Figure 7 shows time-averaged distributions of dis- placement thickness δ*/H* for all cases. The abscissa is the distance x/H* from throat, and the ordinate is dis- placement thickness δ*/H*. As is evident from this fig- ure, displacement thickness behind the shock wave for Case 1-M-A is the smallest in all cases and in Cases 2-D3 and 2-M3, it is high compared with that for other cases in −0.5 ≤ x/H* ≤ 0.5. From these results, it is found that the development of boundary layer is dependent on how the non-equilibrium condensation occurs. 5. Conclusions A numerical study has been made to investigate the ef- fect of locally occurred non-equilibrium condensation on a transonic flow field with a circular arc bump. The 10.50-0.5-1 x / H * 0 0.01 0.02 0.03 0.05 0.04 ß : Case 1-D : Case 1-M-A : Case 1-M-B : Case 1-M-C : Case 2-D3 : Case 2-M3 : Shock wave Figure 6. Distributions of integrated total pressure loss . : Case 1-D : Case 1-M-A : Case 1-M-B : Case 1-M-C : Case 2-D3 : Case 2-M3 : Shock wave -0.5 -0.2500.250.5 0 0.0 2 0.0 4 0.0 6 0.0 8 x / H * d*/H* Figure 7. Time-averaged distributions of displacement thick- ness δ*/H*. Copyright © 2013 SciRes. OJFD 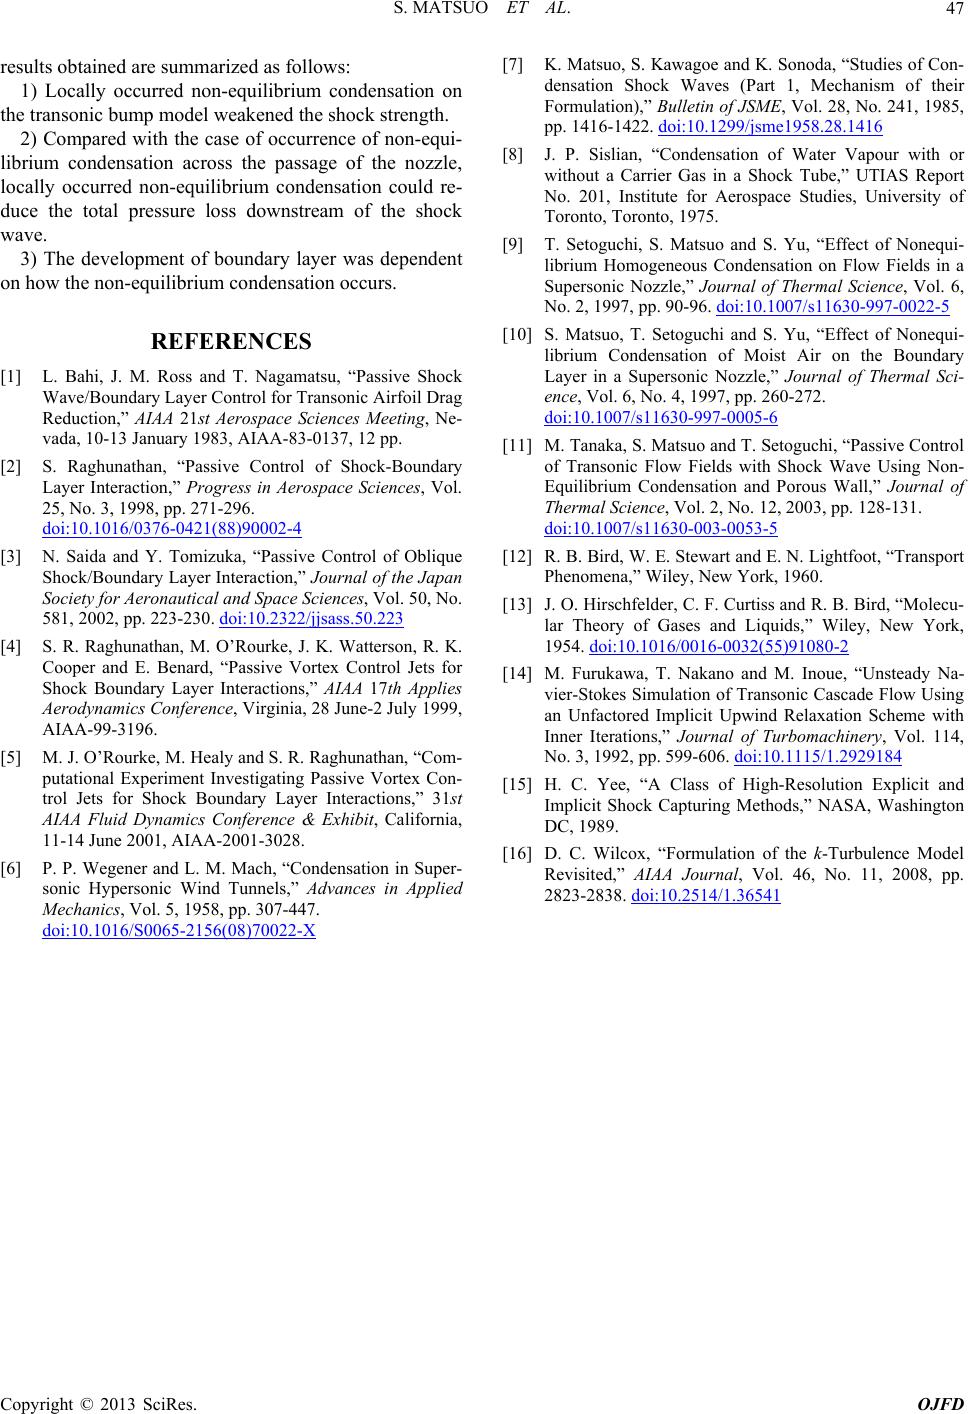 S. MATSUO ET AL. Copyright © 2013 SciRes. OJFD 47 results obtained are summarized as follows: 1) Locally occurred non-equilibrium condensation on the transonic bump model weakened the shock strength. 2) Compared with the case of occurrence of non-equi- librium condensation across the passage of the nozzle, locally occurred non-equilibrium condensation could re- duce the total pressure loss downstream of the shock wave. 3) The development of boundary layer was dependent on how the non-equilibrium condensation occurs. REFERENCES [1] L. Bahi, J. M. Ross and T. Nagamatsu, “Passive Shock Wave/Boundary Layer Control for Transonic Airfoil Drag Reduction,” AIAA 21st Aerospace Sciences Meeting, Ne- vada, 10-13 January 1983, AIAA-83-0137, 12 pp. [2] S. Raghunathan, “Passive Control of Shock-Boundary Layer Interaction,” Progress in Aerospace Sciences, Vol. 25, No. 3, 1998, pp. 271-296. doi:10.1016/0376-0421(88)90002-4 [3] N. Saida and Y. Tomizuka, “Passive Control of Oblique Shock/Boundary Layer Interaction,” Journal of the Japan Society for Aeronautical and Space Sciences, Vol. 50, No. 581, 2002, pp. 223-230. doi:10.2322/jjsass.50.223 [4] S. R. Raghunathan, M. O’Rourke, J. K. Watterson, R. K. Cooper and E. Benard, “Passive Vortex Control Jets for Shock Boundary Layer Interactions,” AIAA 17th Applies Aerodynamics Conference, Virginia, 28 June-2 July 1999, AIAA-99-3196. [5] M. J. O’Rourke, M. Healy and S. R. Raghunathan, “Com- putational Experiment Investigating Passive Vortex Con- trol Jets for Shock Boundary Layer Interactions,” 31st AIAA Fluid Dynamics Conference & Exhibit, California, 11-14 June 2001, AIAA-2001-3028. [6] P. P. Wegener and L. M. Mach, “Condensation in Super- sonic Hypersonic Wind Tunnels,” Advances in Applied Mechanics, Vol. 5, 1958, pp. 307-447. doi:10.1016/S0065-2156(08)70022-X [7] K. Matsuo, S. Kawagoe and K. Sonoda, “Studies of Con- densation Shock Waves (Part 1, Mechanism of their Formulation),” Bulletin of JSME, Vol. 28, No. 241, 1985, pp. 1416-1422. doi:10.1299/jsme1958.28.1416 [8] J. P. Sislian, “Condensation of Water Vapour with or without a Carrier Gas in a Shock Tube,” UTIAS Report No. 201, Institute for Aerospace Studies, University of Toronto, Toronto, 1975. [9] T. Setoguchi, S. Matsuo and S. Yu, “Effect of Nonequi- librium Homogeneous Condensation on Flow Fields in a Supersonic Nozzle,” Journal of Thermal Science, Vol. 6, No. 2, 1997, pp. 90-96. doi:10.1007/s11630-997-0022-5 [10] S. Matsuo, T. Setoguchi and S. Yu, “Effect of Nonequi- librium Condensation of Moist Air on the Boundary Layer in a Supersonic Nozzle,” Journal of Thermal Sci- ence, Vol. 6, No. 4, 1997, pp. 260-272. doi:10.1007/s11630-997-0005-6 [11] M. Tanaka, S. Matsuo and T. Setoguchi, “Passive Control of Transonic Flow Fields with Shock Wave Using Non- Equilibrium Condensation and Porous Wall,” Journal of Thermal Science, Vol. 2, No. 12, 2003, pp. 128-131. doi:10.1007/s11630-003-0053-5 [12] R. B. Bird, W. E. Stewart and E. N. Lightfoot, “Transport Phenomena,” Wiley, New York, 1960. [13] J. O. Hirschfelder, C. F. Curtiss and R. B. Bird, “Molecu- lar Theory of Gases and Liquids,” Wiley, New York, 1954. doi:10.1016/0016-0032(55)91080-2 [14] M. Furukawa, T. Nakano and M. Inoue, “Unsteady Na- vier-Stokes Simulation of Transonic Cascade Flow Using an Unfactored Implicit Upwind Relaxation Scheme with Inner Iterations,” Journal of Turbomachinery, Vol. 114, No. 3, 1992, pp. 599-606. doi:10.1115/1.2929184 [15] H. C. Yee, “A Class of High-Resolution Explicit and Implicit Shock Capturing Methods,” NASA, Washington DC, 1989. [16] D. C. Wilcox, “Formulation of the k-Turbulence Model Revisited,” AIAA Journal, Vol. 46, No. 11, 2008, pp. 2823-2838. doi:10.2514/1.36541 |