

Paper Menu >>
Journal Menu >>
 International Journal of Clean Coal and Energy, 2013, 2, 21-23 doi:10.4236/ijcce.2013.22B005 Published Online May 2013 (http://www.scirp.org/journal/ijcce) Studying of Deformation Processes by Two-Coordinate Laser Strainmeter Grigory I. Dolgikh V.I. Il'ichev Pacific Oceanological Institute Far Eastern Branch of Russian Academy of Sciences, Vladivostok, Russia Email: [email protected] Received 2013 ABSTRACT The results of experimental data processing of a two-coordinate laser strainmeter are discussed. The two-coordinate laser strainmeter consists of two laser strainmeters which measuring shoulders are oriented along the lines “North- South” and “West-East”. Measurement accuracy of the earth's crust microdisplacements of these devices makes 0 to1 nm. Working frequency range is from 0 to 1000 Hz. Processing experimental data the main attention is paid to high tides, natural oscillations of the Earth, natural oscillations of geoblocks, superficial sea waves. It is established that after separate earthquakes the natural oscillation s of regional geoblocks are strongly excited. Besid es, it is revealed that qua- siperiodic fluctuations of crust in the range of periods from 1 to 12 min. are caused by atmospheric processes. Besides, it is revealed that quasiperiodic oscillations of the earth's crust in the range of p eriods from 1 to 12 minutes are caused by atmospheric processes. Keywords: Two-coordinate Laser Strainmeter; High Tides; Earthquakes; Natural Oscillations of the Earth; Natural Oscillations of Geoblocks; Natural Oscillations of Bays; Sup e rficial and Internal Sea Waves; Quasiperiodic Oscillations 1. Introduction Now studying of deformation processes of the Earth car- ries out with application of the various installations, most of which has a limited working range of frequencies. The main direction of these researches is connected with studying of physics of onset and development of various catastrophic processes of the Earth: earthquak es, tsunami, typhoons, waves murderers, eruptions of volcanoes, etc. Process of preparation of some of them related to the slow changes of variations stress-deformation field of the Earth which can't be measured by many installations be- cause of their limited frequency range. Laser strainmeter are most suitable for these purposes. They are capable to measure variations of displacement of the earth’s crust in the frequency range from 0 to 1000 Hz with a high accu- racy. It is shown in paper [1] that only application of spatially separated laser strainmeters will allow to solve a problem of the short-term prediction of crustal earth- quakes. And application of laser strainmeters in services of the prevention tsunami threat, based on a deformation method for degree assessment of tsunamigenic earth- quakes [2], will allow not only to determine from 100% probability tsunami formation after an underwater earth- quake, but also to calculate its power. To solve these problems in full is necessary to measure displacement of the earth's crust in different directions. It is known [3] that laser strainmeters possess the greatest sensitivity on the axis. Therefore for determination of size of the dis- placements coming in different directions, it is necessary to establish some laser strainmeters of a various orienta- tion in one point. For this purpose on the range of Pacific Oceanological Institute Far Eastern Branch Russian Academy of Sciences (POI FEB RAS) cape Shults a two- coordinate laser strainmeter was created. It consists of two laser strainmeters which shoulders are focused on the “North-South” and “West-East” lines. Besides, this range is equipped with the Trimble 5700 GPS-receiver, the three-component broadband seismodetector, a mete- orological station and a laser nanobarograph. The laser nanobarograph is capable to carry out measurements of atmosphere pressure variations with an accuracy of 1 mPa in the frequency range from 0 to 1000 Hz. It is in- tended for parallel measurement of atmosphere pressure variations with strainmeters with an assessment of their contribution to level of microdeformations of the earth’s crust at the appropriate frequencies. 2. Two-coordinate Laser Strainmeter As mentioned above, the two-coordinate laser strainmeter consists of two laser strainmeters with mutually perpen- dicular working shoulders. The first laser strainmeter with a shoulder length of 52.5 m, focused on the North- Copyright © 2013 SciRes. IJCCE 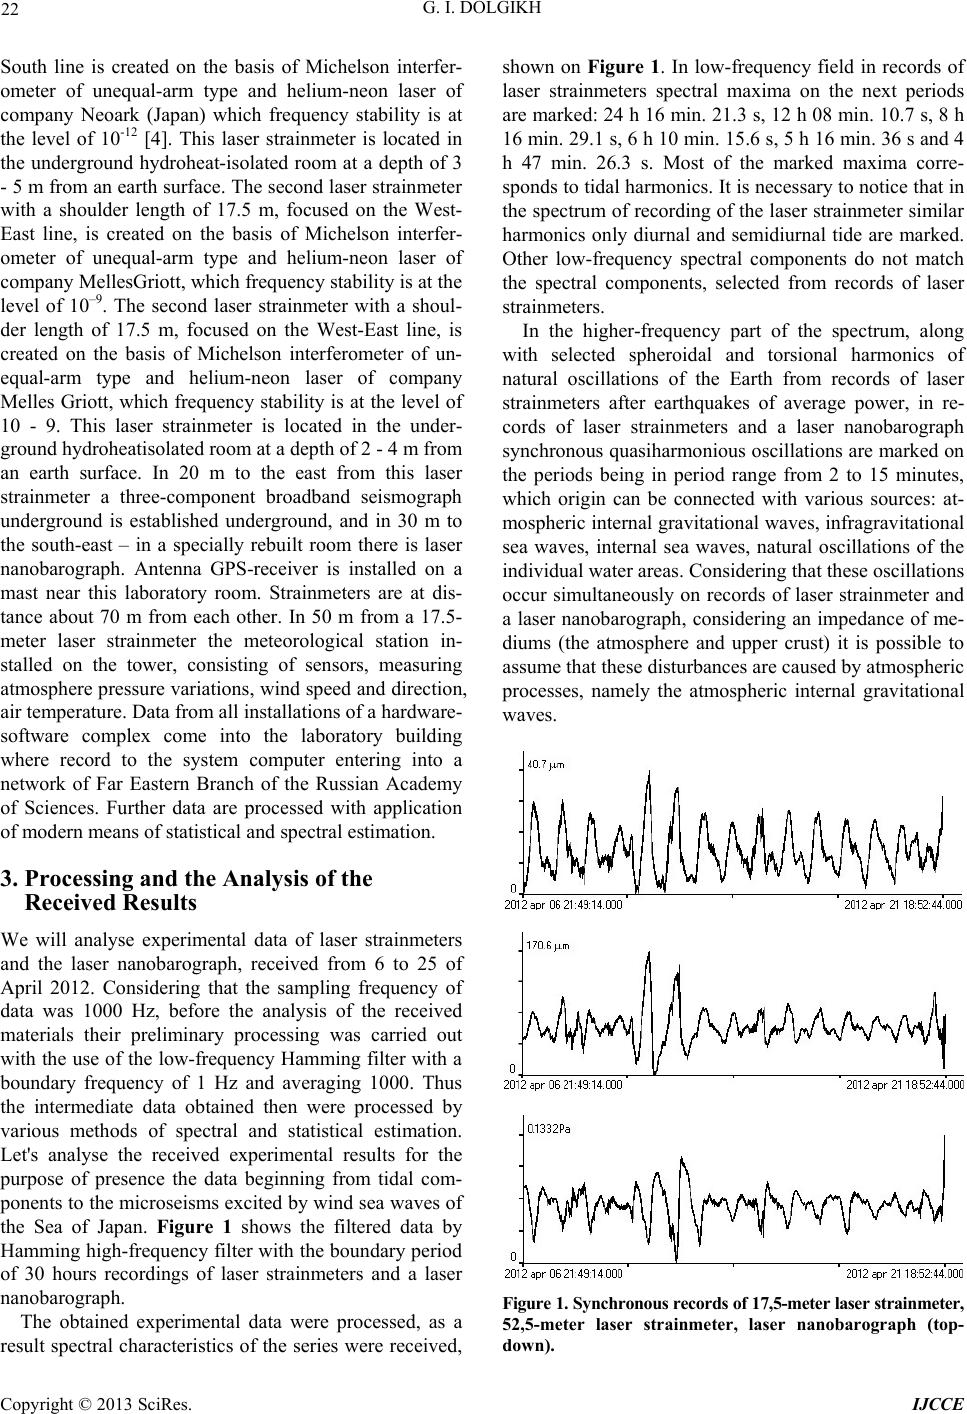 G. I. DOLGIKH 22 South line is created on the basis of Michelson interfer- ometer of unequal-arm type and helium-neon laser of company Neoark (Japan) which frequency stability is at the level of 10-12 [4]. This laser strainmeter is located in the underground hydroheat-isolated room at a depth of 3 - 5 m from an earth surface. The second laser strainmeter with a shoulder length of 17.5 m, focused on the West- East line, is created on the basis of Michelson interfer- ometer of unequal-arm type and helium-neon laser of company MellesGriott, which frequ ency stability is at th e level of 10–9. The second laser strainmeter with a shoul- der length of 17.5 m, focused on the West-East line, is created on the basis of Michelson interferometer of un- equal-arm type and helium-neon laser of company Melles Griott, which frequency stability is at the lev el of 10 - 9. This laser strainmeter is located in the under- ground hydroheatisolated room at a depth of 2 - 4 m from an earth surface. In 20 m to the east from this laser strainmeter a three-component broadband seismograph underground is established underground, and in 30 m to the south-east – in a specially rebuilt room there is laser nanobarograph. Antenna GPS-receiver is installed on a mast near this laboratory room. Strainmeters are at dis- tance about 70 m from each other. In 50 m from a 17.5- meter laser strainmeter the meteorological station in- stalled on the tower, consisting of sensors, measuring atmosphere pressure variations, wind speed and direction, air temperature. Data from all installations of a hardware- software complex come into the laboratory building where record to the system computer entering into a network of Far Eastern Branch of the Russian Academy of Sciences. Further data are processed with application of modern means of statistical and spectral estimation. 3. Processing and the Analysis of the Received Results We will analyse experimental data of laser strainmeters and the laser nanobarograph, received from 6 to 25 of April 2012. Considering that the sampling frequency of data was 1000 Hz, before the analysis of the received materials their preliminary processing was carried out with the use of the low-frequency Hamming filter with a boundary frequency of 1 Hz and averaging 1000. Thus the intermediate data obtained then were processed by various methods of spectral and statistical estimation. Let's analyse the received experimental results for the purpose of presence the data beginning from tidal com- ponents to the microseisms excited by wind sea waves of the Sea of Japan. Figure 1 shows the filtered data by Hamming high-frequency filter with the boundary period of 30 hours recordings of laser strainmeters and a laser nanobarograph. The obtained experimental data were processed, as a result spectral characteristics of the series were received, shown on Figure 1. In low-frequency field in records of laser strainmeters spectral maxima on the next periods are marked: 24 h 16 min. 21.3 s, 12 h 08 min. 10.7 s, 8 h 16 min. 29.1 s, 6 h 10 min. 15.6 s, 5 h 16 min. 36 s and 4 h 47 min. 26.3 s. Most of the marked maxima corre- sponds to tidal harmonics. It is necessary to notice that in the spectrum of recording of the laser strainmeter similar harmonics only diurnal and semidiurnal tide are marked. Other low-frequency spectral components do not match the spectral components, selected from records of laser strainmeters. In the higher-frequency part of the spectrum, along with selected spheroidal and torsional harmonics of natural oscillations of the Earth from records of laser strainmeters after earthquakes of average power, in re- cords of laser strainmeters and a laser nanobarograph synchronous quasiharmonious oscillatio ns are marked on the periods being in period range from 2 to 15 minutes, which origin can be connected with various sources: at- mospheric internal gravitatio nal waves, infragravitational sea waves, internal sea waves, natural oscillations of the individual water areas. Considering that these oscillatio ns occur simultaneously on records of laser strainmeter and a laser nanobarograph, considering an impedance of me- diums (the atmosphere and upper crust) it is possible to assume that these disturbances are caused by atmospheric processes, namely the atmospheric internal gravitational waves. Figure 1. Synchronous recor ds of 17,5-mete r laser str ainme ter, 52,5-meter laser strainmeter, laser nanobarograph (top- down). Copyright © 2013 SciRes. IJCCE 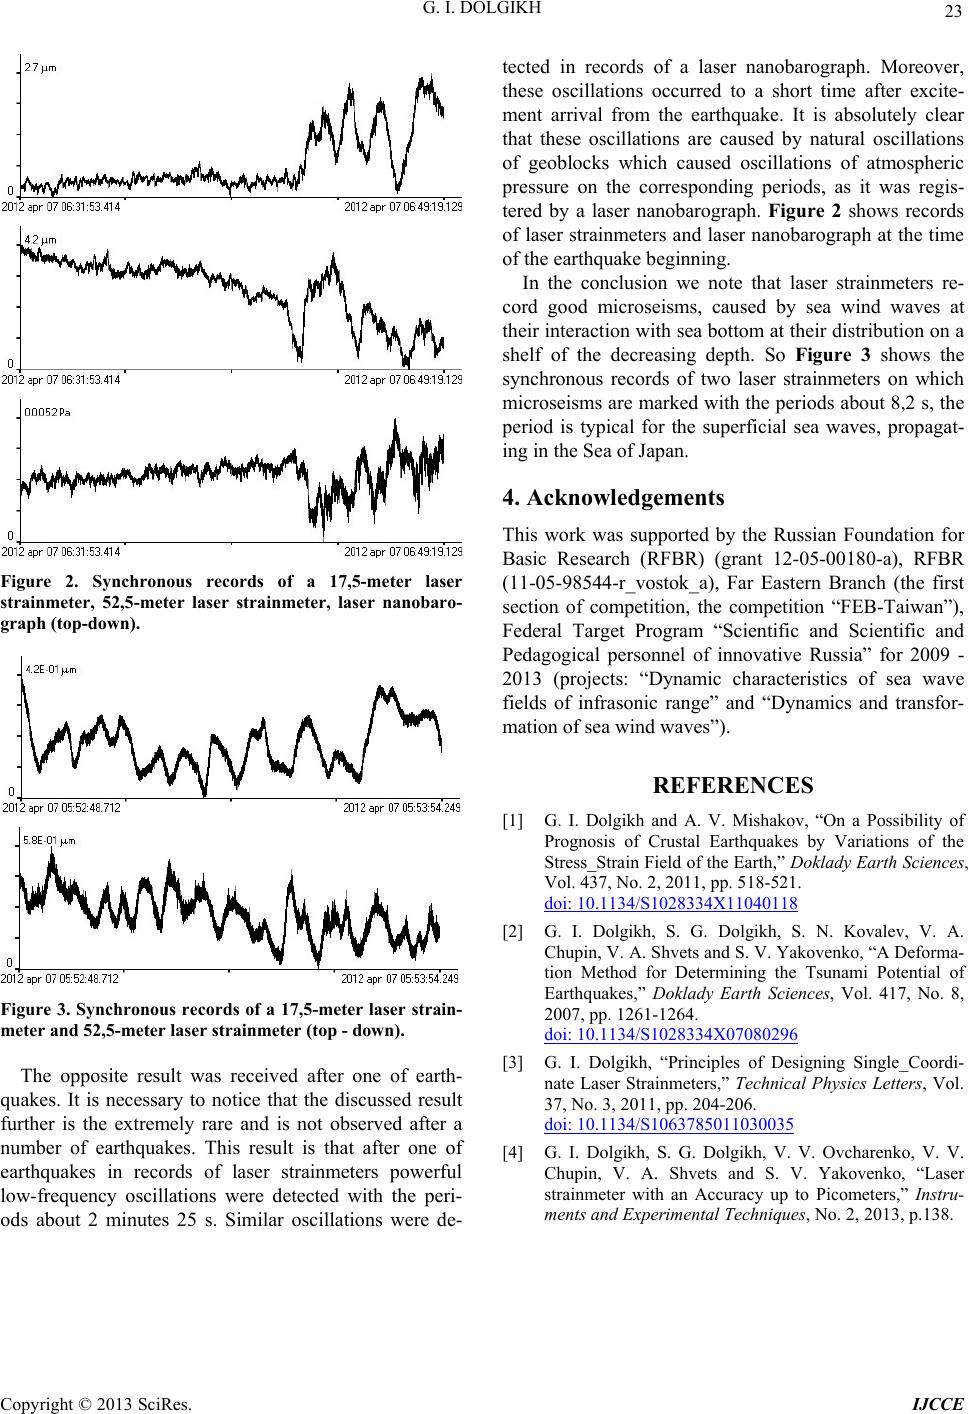 G. I. DOLGIKH Copyright © 2013 SciRes. IJCCE 23 Figure 2. Synchronous records of a 17,5-meter laser strainmeter, 52,5-meter laser strainmeter, laser nanobaro- graph (top-down). Figure 3. Synchronous records of a 17,5-meter laser strain- meter and 52,5-meter laser strainmeter (top - down). The opposite result was received after one of earth- quakes. It is necessary to notice that the discussed result further is the extremely rare and is not observed after a number of earthquakes. This result is that after one of earthquakes in records of laser strainmeters powerful low-frequency oscillations were detected with the peri- ods about 2 minutes 25 s. Similar oscillations were de- tected in records of a laser nanobarograph. Moreover, these oscillations occurred to a short time after excite- ment arrival from the earthquake. It is absolutely clear that these oscillations are caused by natural oscillations of geoblocks which caused oscillations of atmospheric pressure on the corresponding periods, as it was regis- tered by a laser nanobarograph. Figure 2 shows records of laser strainmeters and laser nanobarograph at the time of the earthquake beginning. In the conclusion we note that laser strainmeters re- cord good microseisms, caused by sea wind waves at their interaction with sea bottom at th eir distribution on a shelf of the decreasing depth. So Figure 3 shows the synchronous records of two laser strainmeters on which microseisms are marked with the periods about 8,2 s, the period is typical for the superficial sea waves, propagat- ing in the Sea of Japan. 4. Acknowledgements This work was supported by the Russian Foundation for Basic Research (RFBR) (grant 12-05-00180-a), RFBR (11-05-98544-r_vostok_a), Far Eastern Branch (the first section of competition, the competition “FEB-Taiwan”), Federal Target Program “Scientific and Scientific and Pedagogical personnel of innovative Russia” for 2009 - 2013 (projects: “Dynamic characteristics of sea wave fields of infrasonic range” and “Dynamics and transfor- mation of sea wind waves”). REFERENCES [1] G. I. Dolgikh and A. V. Mishakov, “On a Possibility of Prognosis of Crustal Earthquakes by Variations of the Stress_Strain Field of the Earth,” Doklady Earth Sciences, Vol. 437, No. 2, 2011, pp. 518-521. doi: 10.1134/S1028334X11040118 [2] G. I. Dolgikh, S. G. Dolgikh, S. N. Kovalev, V. A. Chupin, V. A. Shvets and S. V. Yakovenko, “A Deforma- tion Method for Determining the Tsunami Potential of Earthquakes,” Doklady Earth Sciences, Vol. 417, No. 8, 2007, pp. 1261-1264. doi: 10.1134/S1028334X07080296 [3] G. I. Dolgikh, “Principles of Designing Single_Coordi- nate Laser Strainmeters,” Technical Physics Letters, Vol. 37, No. 3, 2011, pp. 204-206. doi: 10.1134/S1063785011030035 [4] G. I. Dolgikh, S. G. Dolgikh, V. V. Ovcharenko, V. V. Chupin, V. A. Shvets and S. V. Yakovenko, “Laser strainmeter with an Accuracy up to Picometers,” Instru- ments and Experimental Techniques, No. 2, 2013, p.138. |