

Paper Menu >>
Journal Menu >>
 American Journal of Industrial and Business Management, 2013, 3, 378-381 http://dx.doi.org/10.4236/ajibm.2013.34044 Published Online August 2013 (http://www.scirp.org/journal/ajibm) Research on the Influencing Effect between CHVA and CPI in China Based on VAR Models* Jinge Zhou1, Juan Chen2, Xiuli Yu1,3, Yifan Li4, Qifeng Lin4 1Guangdong University of Technology School of Management, Guangzhou, China; 2Guangdong University of Technology School of Economics and Trade, Guangzhou, China; 3Psychological Education and Research Department, Guangdong University of Technol- ogy, Guangzhou, China; 4School of Applied Mathematics, Guangdong University of Technology, Guangzhou, China. Email: [email protected] Received April 25th, 2013; revised May 25th, 2013; accepted June 25th, 2013 Copyright © 2013 Jinge Zhou, Juan Chen. This is an open access article distributed under the Creative Commons Attribution License, which permits unrestricted use, distribution, and reproduction in any medium, provided the original work is properly cited. ABSTRACT The cointegration test, granger causality test, VAR model, impulse response function and other econometric methods are used in this paper to analyze the influencing effect between commercial housing vacancy rate and CPI and its delay impact. The results show that there is a long-term equilibrium relationship between commercial housing vacancy rate and CPI in China. There are at least one cointegration relationship between CHVR and CPI. The past values of the CPI appear to contain information which is useful for forecasting changes in the CHVR. CPI has a significant effect on CHVR and CPI rising drives CHVR. Keywords: CHVR; CPI; VAR; Cointegration 1. Introduction The real estate industry is a leading industry of the entire China economy and influences the quality of life of the residents. The commercial housing vacancy rate fluctua- tion entails real estate with commodity house prices. In recent years, the price of China’s real estate has im- proved extremely, and CPI also increased sharply. Hence, some scholars believe that the commercial housing can’t avoid the risk of inflation. In the past few years, both domestic and overseas re- searchers made an empirical analysis of the relationship between the real estate and CPI. Raymond’s thesis showed that there is no causal relationship between land supply and housing prices and their estimations, which based on the annual data of Hong Kong’s public land sales, found that the government acts to maximise land revenue [1]. Jack H. Rubens, Michael T. Bond and James R. Webb believed that assets have the ability to protect investors from the effects of inflation are generally la- belled inflation hedges; the real estate has been regarded as one of the best inflation hedges of past years [2]. Wil- lian C. Wheaton holds the view that the vacancy rate, fixed in the short run, determines the expected length of sale and search, which plays a central role in the reserva- tion prices of buyer and seller [3]. SHEN Yue and LIU Hong-Yu researched the relationship between the real estate development investment and GDP in China [4]. ZHOU Zhi-Chun, LI Zheng and MAO Jie researched how real estate industry corresponds to economic vicis- situdes, which is an empirical analysis based on Chinese data [5]. WANG Yao-Wu, Jin Haiyuan considered the real estate supply and land supply is the most important factor. They also thought the second important factor is the interest rate [6]. To conclude, both domestic and overseas reseachers made an empirical analysis of the relationship between real estate and CPI. However, related researching did not underline the commercial housing vacancy rate, which is the cornerstone of China real estate market. According to the fact above, this paper made some research from the perspective of effect size and effect time lag between commercial housing vacancy rate and CPI on China real estate market. The research is of positive value and po- litical reference under the back ground of China’s current economic system and real estate industrial integration. 2. Data Processing All data series are annually begins in 1995 and ends in 2010, it shows by Table 1. Data on China’s CHVR (which is commercial housing vacancy rate) and consumer *This is an extended version of the paper at the 2011 International Conference on Networks and Information. Copyright © 2013 SciRes. AJIBM 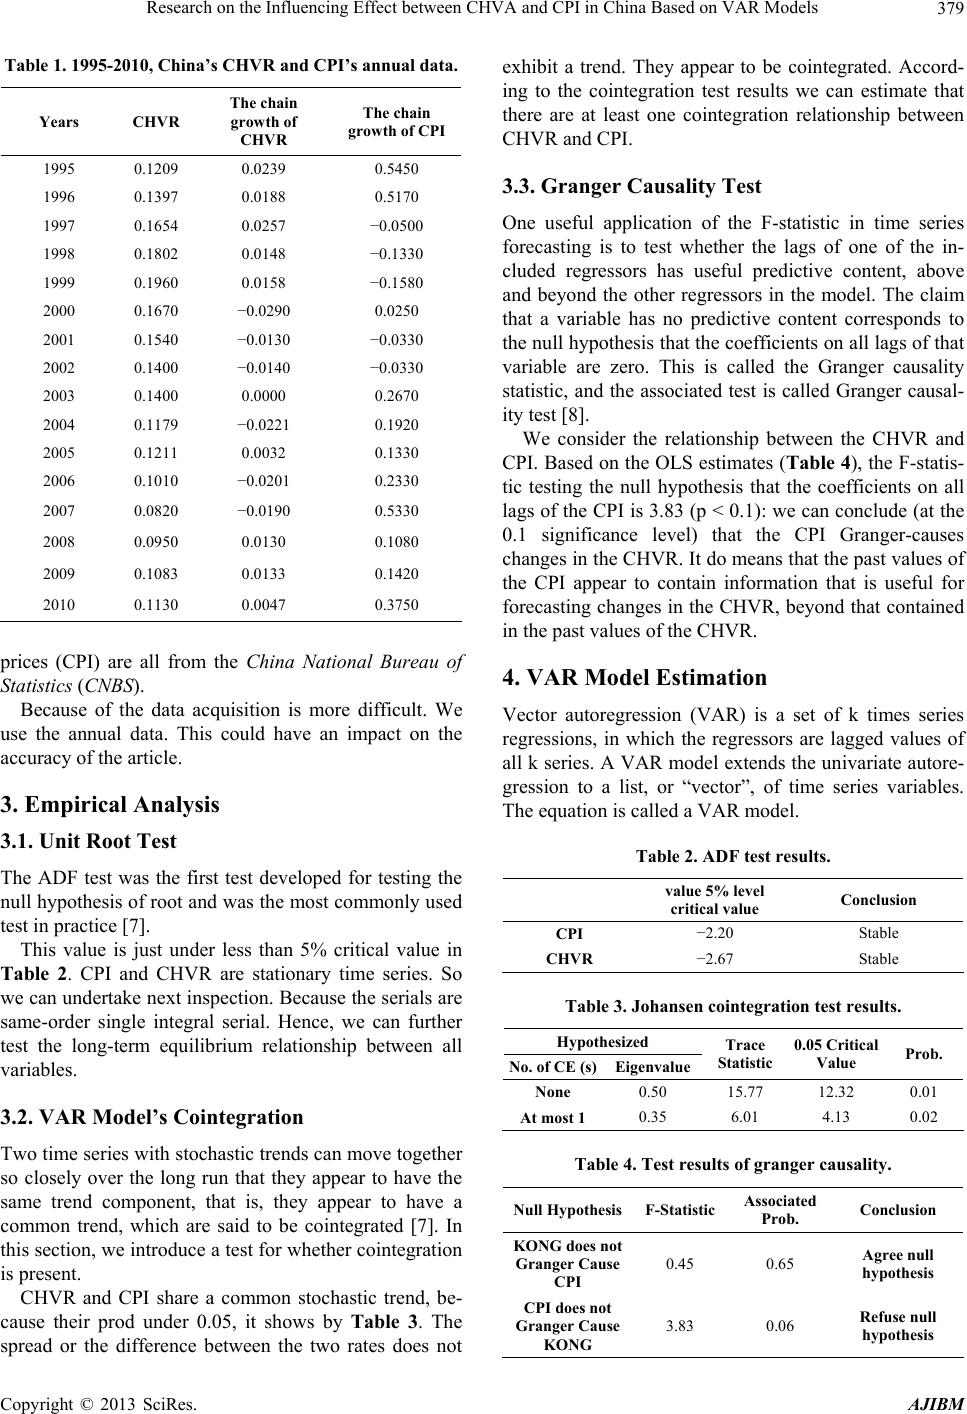 Research on the Influencing Effect between CHVA and CPI in China Based on VAR Models 379 Table 1. 1995-2010, China’s CHVR and CPI’s annual data. Years CHVR The chain growth of CHVR The chain growth of CPI 1995 0.1209 0.0239 0.5450 1996 0.1397 0.0188 0.5170 1997 0.1654 0.0257 −0.0500 1998 0.1802 0.0148 −0.1330 1999 0.1960 0.0158 −0.1580 2000 0.1670 −0.0290 0.0250 2001 0.1540 −0.0130 −0.0330 2002 0.1400 −0.0140 −0.0330 2003 0.1400 0.0000 0.2670 2004 0.1179 −0.0221 0.1920 2005 0.1211 0.0032 0.1330 2006 0.1010 −0.0201 0.2330 2007 0.0820 −0.0190 0.5330 2008 0.0950 0.0130 0.1080 2009 0.1083 0.0133 0.1420 2010 0.1130 0.0047 0.3750 prices (CPI) are all from the China National Bureau of Statistics (CNBS). Because of the data acquisition is more difficult. We use the annual data. This could have an impact on the accuracy of the article. 3. Empirical Analysis 3.1. Unit Root Test The ADF test was the first test developed for testing the null hypothesis of root and was the most commonly used test in practice [7]. This value is just under less than 5% critical value in Table 2. CPI and CHVR are stationary time series. So we can undertake next inspection. Because the serials are same-order single integral serial. Hence, we can further test the long-term equilibrium relationship between all variables. 3.2. VAR Model’s Cointegration Two time series with stochastic trends can move together so closely over the long run that they appear to have the same trend component, that is, they appear to have a common trend, which are said to be cointegrated [7]. In this section, we introduce a test for whether cointegration is present. CHVR and CPI share a common stochastic trend, be- cause their prod under 0.05, it shows by Table 3. The spread or the difference between the two rates does not exhibit a trend. They appear to be cointegrated. Accord- ing to the cointegration test results we can estimate that there are at least one cointegration relationship between CHVR and CPI. 3.3. Granger Causality Test One useful application of the F-statistic in time series forecasting is to test whether the lags of one of the in- cluded regressors has useful predictive content, above and beyond the other regressors in the model. The claim that a variable has no predictive content corresponds to the null hypothesis that the coefficients on all lags of that variable are zero. This is called the Granger causality statistic, and the associated test is called Granger causal- ity test [8]. We consider the relationship between the CHVR and CPI. Based on the OLS estimates (Table 4), the F-statis- tic testing the null hypothesis that the coefficients on all lags of the CPI is 3.83 (p < 0.1): we can conclude (at the 0.1 significance level) that the CPI Granger-causes changes in the CHVR. It do means that the past values of the CPI appear to contain information that is useful for forecasting changes in the CHVR, beyond that contained in the past values of the CHVR. 4. VAR Model Estimation Vector autoregression (VAR) is a set of k times series regressions, in which the regressors are lagged values of all k series. A VAR model extends the univariate autore- gression to a list, or “vector”, of time series variables. The equation is called a VAR model. Table 2. ADF test results. value 5% level critical value Conclusion CPI −2.20 Stable CHVR −2.67 Stable Table 3. Johansen cointegration test results. Hypothesized No. of CE (s)Eigenvalue Trace Statistic 0.05 Critical Value Prob. None 0.50 15.77 12.32 0.01 At most 1 0.35 6.01 4.13 0.02 Table 4. Test results of granger causality. Null HypothesisF-StatisticAssociated Prob. Conclusion KONG does not Granger Cause CPI 0.45 0.65 Agree null hypothesis CPI does not Granger Cause KONG 3.83 0.06 Refuse null hypothesis Copyright © 2013 SciRes. AJIBM  Research on the Influencing Effect between CHVA and CPI in China Based on VAR Models Copyright © 2013 SciRes. AJIBM 380 1 In the case of two time series variables, Yt and Xt, the VAR (p) consists of the two equations: 10 years, the impulse responses of CPI to a one standard deviation shock in the CHVR equation. The main results of this contractionary shock on the other variables in the system can be summarized as follows: 10 11 1111 1 ttp tptp tpt YY YX X (1) CPI has a great influence on the CHVR. When the CPI rises, the vacancy rates increase accordingly. The re- sponse of CPI to CHVR is significant negative response appears firstly—as the CHVR level rises gradually to reach a trough two years after the initial shock. The de- cline becomes significant after three years. Finally, CHVR decreases steadily after the seven years to reach its lowest level in the three years, and returns to its pre-shock level ten years after CPI impulse. 2021 1 22112 tt 2 p tptp tpt XY YX X (2) where the β’s and γ’s are unknown coefficients and μ1t and μ2t are error terms. The VAR assumptions are the time series regression assumptions of Key Concept (1), applied to each equa- tion. The coefficients of a VAR are estimated by esti- mating each equation by OLS [9]. The response of the CHVR to CPI is smaller in mag- nitude than the response of CPI to CHVR. More impor- tantly, the shock dies out very quickly, five years after the initial impulse so that there is no innovation paradox. The system is estimated with annually data from 1995 to 2010, under the baseline system. In selected period, we are constrained it by the availability of data for the China National Bureau of Statistics. As suggested by the relevant lag selection criteria (Akaike Information Crite- rion, Schwartz Bayesian Criterion) we use two lags. The CPI allows for a contemporaneous response of the CHVR (In the Figure 1 the red lines mean error bars, the blue one mean line of impact). 5. Summaries The results show that there is a long-term equilibrium relationship between CHVR and CPI in China. There are at least one cointegration relationship between CHVR and CPI. The CPI Granger-causes changes in the CHVR. It is certain that the past values of the CPI appear to con- tain information that is useful for forecasting changes in The orthogonalized residuals of the CPI equation are identified as CHVR. Figure 1 reports, over a period of -.01 .0 0 .0 1 .0 2 12345678910 Response of KZL to KZ L -.01 .00 .01 .02 12345678910 Response of KZL to CPI -.3 -.2 -.1 .0 .1 .2 .3 12345678910 Response of CPI to KZL -.3 -.2 -.1 .0 .1 .2 .3 12345678910 Response of CPI to CPI Response to Cholesky On e S.D. Innovati ons ± 2 S.E. 0.02 0.01 0.00 −0.01 0.02 0.01 0.00 −0.01 0.3 0.2 0.1 0.0 −0.1 −0.2 −0.3 0.3 0.2 0.1 0.0 −0.1 −0.2 −0.3 Figure 1. Impulse responses to a CHVR shock-system with CPI (1995-2010).  Research on the Influencing Effect between CHVA and CPI in China Based on VAR Models 381 the CHVR, beyond that contained in the past values of the CHVR, not vice versa. CPI has a great influence on the CHVR. When the CPI rises, the vacancy rates in- crease accordingly. The response of CPI to CHVR is significant response appears for the first—as the CHVR level rises gradually to reach a trough two years after the initial shock. The decline becomes significant after three years. Finally, CHVR declines steadily after the seven years to reach its lowest level in the three years, and re- turns to its pre-shock level ten years after CPI impulse. REFERENCES [1] Y. C. Tse Raymond, “Housing Price, Land Supply and Revenue from Land Sales,” Urban Studies, Vol. 35, No. 8, 1988, pp. 1377-l392. [2] J. H. Rubens, M. T. Bond and J. R. Webb, “The Infla- tion-Hedging Effectiveness of Real Estate,” Journal of Real Estate Research, Vol. 2, 2009, pp. 45-55. [3] W. C. Wheaton, “Vacancy, Search, and Prices in a Hous- ing Market Matching Model,” The Journal of Political Economy, Vol. 98, No. 6, 1990, pp. 1270-1280. doi:10.1086/261734 [4] Y. Shen and H.-Y. Liu, “The Relationship between Real Estate Development Investment and GDP in China,” Journal of Tsinghua University (Science and Technology), Vol. 44, 2004, pp. 1205-1208. [5] Z.-C. Zhou, Z. Li and J. Mao, “Researched How Real Estate Industry Corresponds to Economic Vicissitudes? An Empirical Analysis based on Chinese Data,” Journal of Nanting University, Vol. 47, 2010, pp. 47-57. [6] Y.-W. Wang and H. Y. Jin, “An Empirical Analysis of the Impart of Real Estate Macro-Control Policy,” China Civil Engineering Journal, Vol. 41, 2008, pp. 105-114. [7] J. H. Stock and M. W. Watson, “Introduction to Econo- metric,” Shanghai University of Finance Economics Press, Shanghai, 2004, pp. 448-463 [8] C. W. J. Granger, “Investigating Causal Relations by Econometric Models and Cross-Spectralmethods,” Eco- nometrica, Vol. 37, No. 3, 1969, pp. 424-438. doi:10.2307/1912791 [9] H. H. Pesaran and Y. Shin, “Gneralized Impulse Re- sponse Analysis in Linear Multivariate Models,” Eco- nomics Letters, Vol. 58, No. 1, 1998, pp. 17-29. doi:10.1016/S0165-1765(97)00214-0 Copyright © 2013 SciRes. AJIBM |