

Paper Menu >>
Journal Menu >>
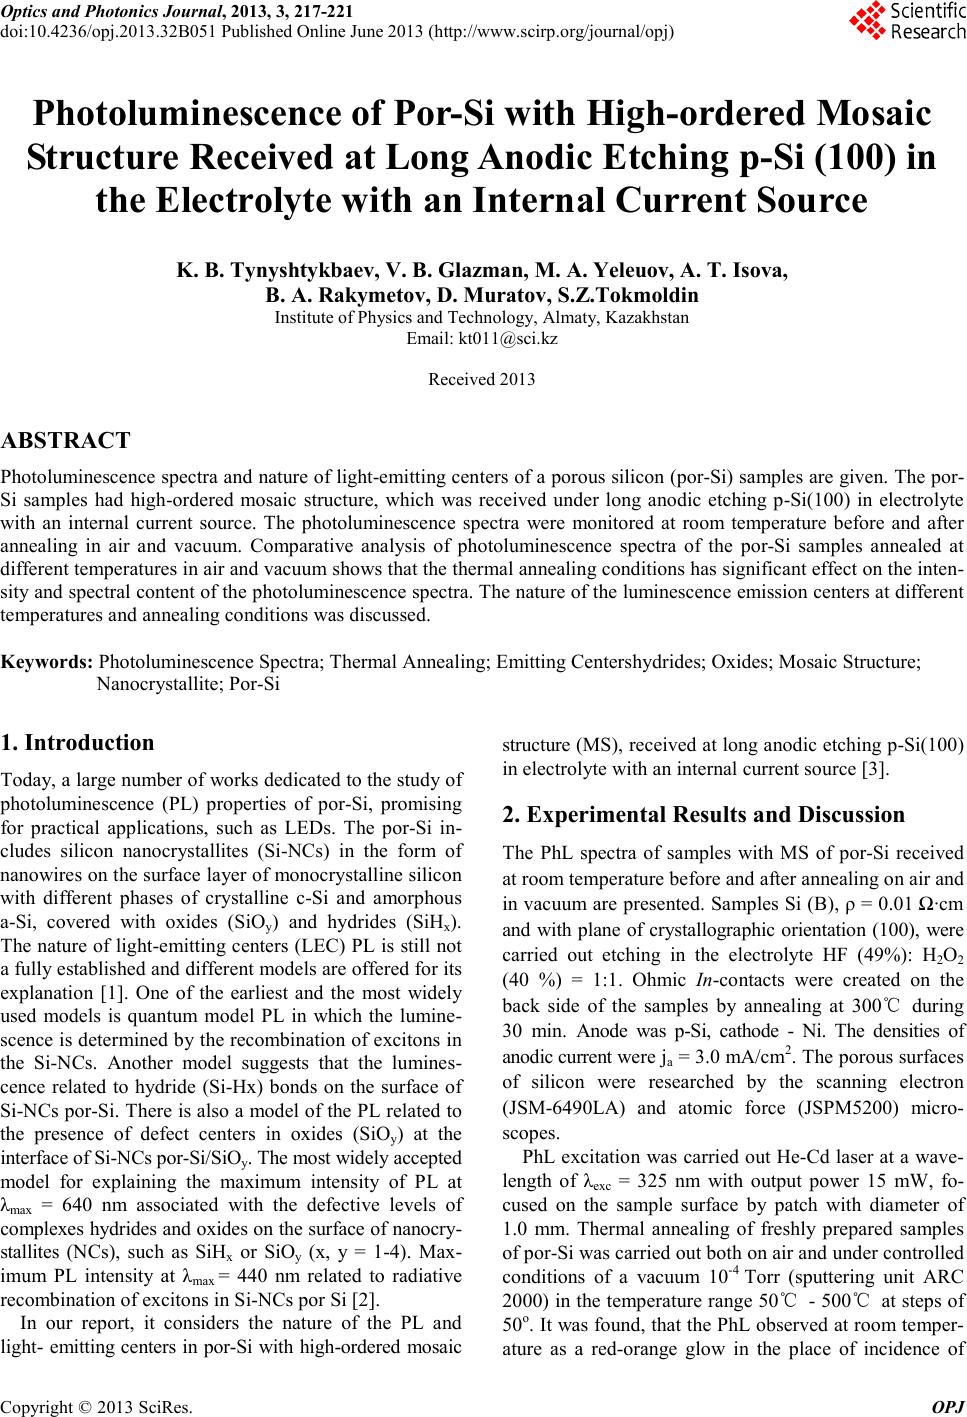 Optics and Photonics Journal, 2013, 3, 217-221 doi:10.4236/opj.2013.32B051 Published Online June 2013 (http://www.scirp.org/journal/opj) Copyright © 2013 SciRes. OPJ Photoluminescence of Por-Si with High-ordered Mosaic Structure Received at Long Anodic Etching p-Si (100) in the Electrolyte with an Internal Current Source K. B. Tynyshtykbaev, V. B. Glazman, M. A. Yeleuov, A. T. Isova, B. A. Rakymetov, D. Muratov, S.Z.Tokmoldin Institute of Physics and Technology, Almaty, Kazakhstan Email: [email protected] Received 2013 ABSTRACT Photoluminescence spectra and nature of light-emitting centers of a po rous silicon (por-Si) samples are given. The por- Si samples had high-ordered mosaic structure, which was received under long anodic etching p-Si(100) in electrolyte with an internal current source. The photoluminescence spectra were monitored at room temperature before and after annealing in air and vacuum. Comparative analysis of photoluminescence spectra of the por-Si samples annealed at different temperatures in air and vacuum shows that t he thermal annealing conditions has significant effect on the int e n- sity and spectral content of the photoluminescence spectra. The nature of the luminescence emission centers at different temperatures and annealing conditions was discussed. Keywords: Photoluminescence Spectra; T hermal Annealing; Emitting Centershydrides; Oxides; Mosaic Structure; Nanocr ystallite; P or-Si 1. Introduction Today, a large number of works dedicated to the study of photoluminescence (PL) properties of por-Si, promising for practical applications, such as LEDs. The por-Si in- cludes silicon nanocrystallites (Si-NCs) in the form of nano wire s on t he s urfac e l aye r o f monocr ystalline silico n with different phases of crystalline c-Si and amorphous a-Si, covered with oxides (SiOy) and hydrides (SiHx). The nature of light-e mitting c enters (LEC) P L is still not a fully established and different models are offered for its explanation [1]. One of the earliest and the most widely used models is quantum model PL in which the lumine- scence is determined by the recombination of excitons in the Si-NCs. Another model suggests that the lumines- cence related to hydride (Si-Hx) bonds on the surface of Si-NCs po r-Si. T here is also a model of the PL related to the presence of defect centers in oxides (SiOy) at the interface of Si-NCs por-Si/SiO y. The most widely accepted model for explaining the maximum intensity of PL at λmax = 640 nm associated with the defective levels of complexes hydrides and oxides on the surface of nanocry- stallites (NCs), such as SiHx or SiOy (x, y = 1-4). Max- imum PL intensity at λmax = 440 nm related to radiative rec ombi natio n of excitons in Si-NCs por Si [2]. In our report, it considers the nature of the PL and light- emitting ce nters in por-Si with high-ordered mosaic struct ure (MS) , received at l ong ano dic e tching p -Si(100) in electrolyte with an internal current source [3]. 2. Experimental Results and Discussion The PhL spectra of samples with MS of por-Si received at room temperature before and after annealing on air and in vacuum are presented. Samples Si (B ), ρ = 0.01 Ω∙cm and with plane of crystallographic orientation (100), were carried out etching in the electrolyte HF (49%): H2O2 (40 %) = 1:1. Ohmic In-contacts were created on the back side of the samples by annealing at 300℃ during 30 min. Anode was p-Si, cathode - Ni. The densities of anodic current were ja = 3 . 0 mA/ cm2. T he porous surfaces of silicon were researched by the scanning electron (JSM-6490LA) and atomic force (JSPM5200) micro- scop es. PhL excitatio n was carried out He -Cd laser at a wave- length of λexc = 325 nm with output power 15 mW, fo- cused on the sample surface by patch with diameter of 1.0 mm. Thermal annealing of freshly prepared samples of por-Si was carried out both on air and under controlled conditions of a vacuum 10-4 Torr (sputtering unit ARC 200 0) in the te mper ature r ange 50℃ - 500℃ at steps of 50o. It was fo und, that the P hL obser ved at room te mper- ature as a red-orange glow in the place of incidence of 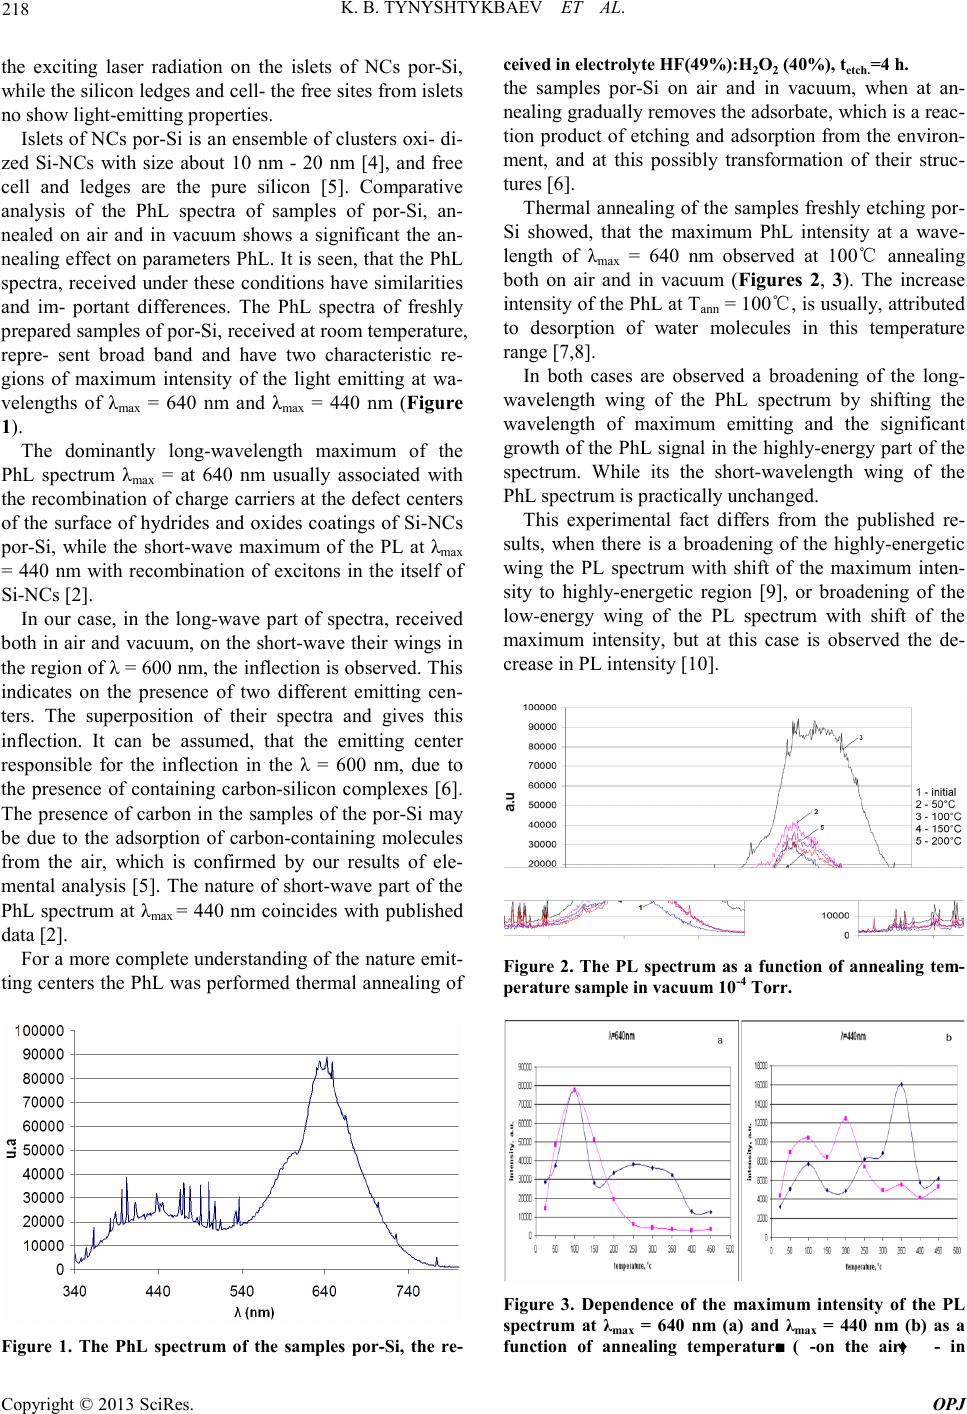 K. B. TYNYSHTYKBAEV ET AL. Copyright © 2013 SciRes. OPJ 218 the exciting laser radiation on the islets of NCs por-Si, while the silico n led ge s and c ell- t he free sites fro m islets no show light-emitting properties. Islets o f NCs po r-Si is a n ens emble o f cluste rs o xi- di- zed Si-NCs with size about 10 nm - 20 nm [4], and free cell and ledges are the pure silicon [5]. Comparative analysis of the PhL spectra of samples of por-Si, an- nealed on air and in vacuum shows a significant the an- nealing effect on parameters PhL. It is seen, that the PhL spectra, received under these conditions have similarities and im- portant differences. The PhL spectra of freshly prepared samples of por-Si, received at room temperature, repre- sent broad band and have two characteristic re- gions of maximum intensity of the light emitting at wa- velengths of λmax = 640 nm and λmax = 440 nm (Figure 1). The dominantly long-wavelength maximum of the PhL spectrum λma x = at 640 nm usually associated with the recombination of charge carriers at the defect centers of the surface of hydrides and oxides coatings of Si-NCs por-Si, while the short-wave maximum of the PL at λmax = 440 nm with recombination of excitons in the itself of Si-NCs [2]. In our case, in the long-wave part of spectra, received both in air and vacuum, on the short-wave their wings i n the region of λ = 600 nm, the inflection is observed. This indicates on the presence of two different emitting cen- ters. The superposition of their spectra and gives this inflection. It can be assumed, that the emitting center responsible for the inflection in the λ = 600 nm, due to the presence of containing carbon-silicon complexes [6]. The presence of carbon in the samples of the por-Si ma y be due to the adsorption of carbon-containing molecules from the air, which is confirmed by our results of ele- mental analysis [5]. The nature of short-wave part of the PhL spectrum at λmax = 440 nm coincides with p ublished data [2]. For a more complete understanding of the nature emit- ting centers the PhL was performed thermal annealing of Figure 1. The PhL spectrum of the samples por-Si, the re- ceived in electrolyte HF (49%):H2O2 (40%), tetch.=4 h. the samples por-Si on air and in vacuum, when at an- nealing gradually removes the adsorbate, which is a reac- tion product of etching and adsorption from the environ- ment, and at this possibly transformation of their struc- tures [6]. Thermal anneal ing of the samples freshly etchi ng por- Si showed, that the maximum PhL intensity at a wave- length of λmax = 640 nm observed at 100℃ annealing both on air and in vacuum (F ig ures 2, 3). The increase intensity of the Ph L at Tann = 100℃, is usually, attributed to desorption of water molecules in this temperature range [7,8]. In both cases are observed a broadening of the long- wavelength wing of the PhL spectrum by shifting the wavelength of maximum emitting and the significant gro wth of the Ph L signal in t he highl y-energy part of the spectrum. While its the short-wavelength wing of the PhL spectrum is practically unchanged. This experimental fact differs from the published re- sults, when there is a broadening of the highly-energetic wing the PL spectrum with shift of the maximum inten- sity to highly-energetic region [9], or broadening of the low-energy wing of the PL spectrum with shift of the maximum intensity, but at this case is observed the de- crease in PL intensity [10]. Figure 2. The PL spectrum as a function of annealing tem- perature sample in vacuum 10 - 4 T orr. Figure 3. Dependence of the maximum intensity of the PL spectrum at λmax = 640 nm (a) and λ max = 440 nm (b) as a function of annealing temperature (■-on the air, ♦ - in 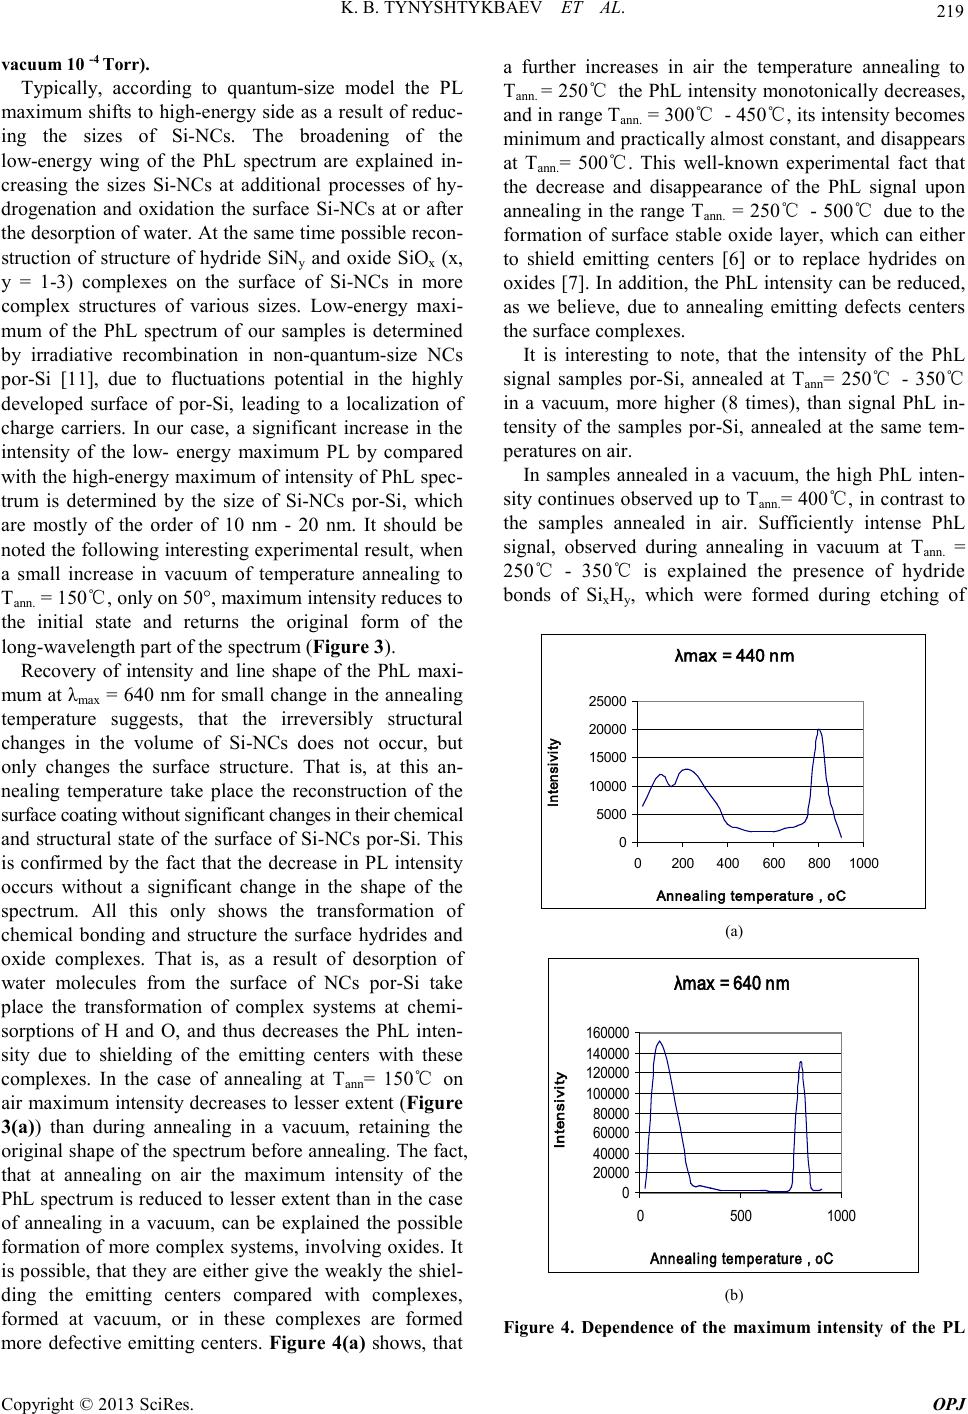 K. B. TYNYSHTYKB AEV ET AL. Copyright © 2013 SciRes. OPJ 219 vacuum 10 -4 Torr). Typically, according to quantum-size model the PL maxi mum shifts to high-energy side as a result of reduc- ing the sizes of Si-NCs. The broadening of the low-energy wing of the PhL spectrum are explained in- creasing the sizes Si-NCs at additional processes of hy- drogenation and oxidation the surface Si-NCs at or after the desorption of water. At the sa me time possible r econ- struction of structure of hydride SiNy and oxide SiOx (x, y = 1-3) complexes on the surface of Si-NCs in more complex structures of various sizes. Low-energy maxi- mum of the PhL spectrum of our samples is determined by irradiative recombination in non-quantum-size NCs por-Si [11], due to fluctuations potential in the highly developed surface of por-Si, leading to a localization of charge carriers. In our case, a significant increase in the intensity of the low- energy maximum PL by compared with the high-energy maximum of intensity of PhL spec- trum is determined by the size of Si-NCs por-Si, which are mostly of the order of 10 nm - 20 nm. It should be noted the follo wing interes ting exp eri mental re sult, when a small increase in vacuum of temperature annealing to Tann. = 150℃, only on 50°, maximum intensity reduces to the initial state and returns the original form of the long-wavelength p art of the spectr um (Figure 3). Recovery of intensity and line shape of the PhL maxi- mum at λmax = 640 nm for small change in the annealing temperature suggests, that the irreversibly structural changes in the volume of Si-NCs does not occur, but only changes the surface structure. That is, at this an- nealing temperature take place the reconstruction of the surf ace coating with out s ign ifica nt chan ges in thei r ch emic al and structural state of the surface of Si-NCs por-Si. This is confirmed by the fact that the decrease in PL intensity occurs without a significant change in the shape of the spectrum. All this only shows the transformation of chemical bonding and structure the surface hydrides and oxide complexes. That is, as a result of desorption of water molecules from the surface of NCs por-Si take place the transformation of complex systems at chemi- sorptions of H and O, and thus decreases the PhL inten- sity due to shielding of the emitting centers with these complexes. In the case of annealing at Tann= 150℃ on air maximum intensity decreases to lesser extent (Figure 3(a)) than during annealing in a vacuum, retaining the original shape of the spectrum before annealing. The fact, that at annealing on air the maximum intensity of the PhL spectrum is reduced to lesser extent t han in the case of annealing in a vacuum, can be explained the possible formation of more complex systems, involving oxides. It is po ssible , that they a re eit her give t he wea kly the shie l- ding the emitting centers compared with complexes, formed at vacuum, or in these complexes are formed more defective emitting centers. Figure 4(a) shows, that a further increases in air the temperature annealing to Tann. = 2 50℃ the PhL i ntensit y mono tonicall y decreases, and in range Tann. = 300℃ - 450℃, its intensity bec o mes minimum and practically almost constant, and disappears at Tann.= 500℃. This well-known experimental fact that the decrease and disappearance of the PhL signal upon annealing in the range Tann. = 250℃ - 500℃ due to the formation of surface stable oxide layer, which can either to shield emitting centers [6] or to replace hydrides on oxid es [7]. I n addition, the PhL inte nsity can be reduced, as we believe, due to annealing emitting defects centers the surface complexes. It is interesting to note, that the intensity of the PhL signal samples por-Si, annealed at Tann= 250℃ - 350℃ in a vacuum, more higher (8 times), than signal PhL in- tensity of the samples por-Si, annealed at the same tem- peratures on air. In samples annealed in a vacuum, the high PhL inten- sity co ntinue s obser ved up to Tann.= 400℃, in contrast to the samples annealed in air. Sufficiently intense PhL signal, observed during annealing in vacuum at Tann. = 250℃ - 350℃ is explained the presence of hydride bonds of SixHy, which were formed during etching of λmax = 440 nm 0 5000 10000 15000 20000 25000 0200 400600 8001000 Annealing temperature , oC Intensivity (a) λmax = 640 nm 0 20000 40000 60000 80000 100000 120000 140000 160000 0500 1000 Annealing temperature , oC Intensivity (b) Figure 4. Dependence of the maximum intensity of the PL 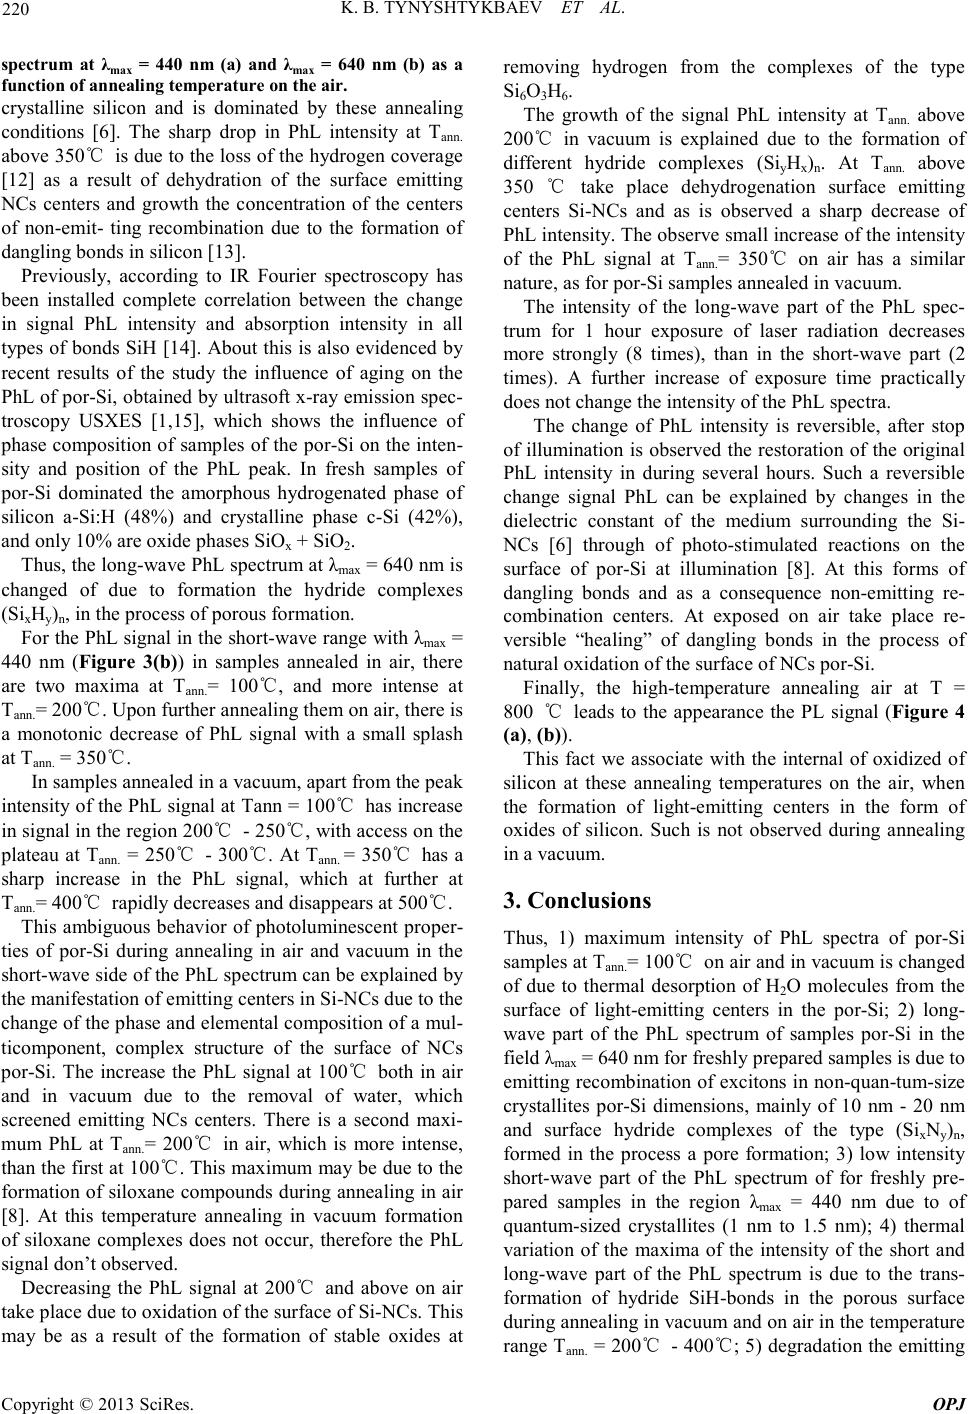 K. B. TYNYSHTYKBAEV ET AL. Copyright © 2013 SciRes. OPJ 220 spectrum at λmax = 440 nm (a) and λ max = 640 nm (b) as a function of annealing temperat ure on the air. crystalline silicon and is dominated by these annealing conditions [6]. The sharp drop in PhL intensity at Tann. above 350℃ is due to the loss of the hydrogen coverage [12] as a result of dehydration of the surface emitting NCs centers and growth the concentration of the centers of non-emit- ting recombination due to the formation of dangling bonds in silicon [13]. Previously, according to IR Fourier spectroscopy has been installed complete correlation between the change in signal PhL intensity and absorption intensity in all types of bonds SiH [14]. About this is also evidenced by recent results of the study the influence of aging on the PhL of por-Si, obtained by ultrasoft x-ray emissi on spec- troscopy USXES [1,15], which shows the influence of phase composition of samples of the por-Si on the inte n- sity and position of the PhL peak. In fresh samples of por-Si dominated the amorphous hydrogenated phase of silicon a-Si:H (48%) and crystalline phase c-Si (42%), and only 10% are oxide phases SiO x + SiO 2. Thus, the lo ng -wave PhL spectrum at λmax = 640 nm is changed of due to formation the hydride complexes (SixHy)n, in the process of porous formation. For the PhL sig nal in t he shor t-wave range with λmax = 440 nm (Figure 3(b)) in samples annealed in air, there are two maxima at Tann. = 100℃, and more intense at Tann.= 200℃. Upon fur t her annealing them on air, ther e is a monotonic decrease of PhL signal with a small splash at Tann. = 350℃. In samples annealed in a vacuum, apart from the peak intensity o f the P hL signal at Tann = 100℃ has increase in sig nal i n the r egio n 2 00 ℃ - 250℃, with access on the plateau at Tann. = 250℃ - 300℃. At Tann. = 350℃ has a sharp increase in the PhL signal, which at further at Tann.= 400℃ rapidly decreases and disappears at 500℃. This ambiguous behavior of photoluminescent proper- ties of por-Si during annealing in air and vacuum in the short-wave side of the PhL spectrum can be explained by the manifestation of e mitting center s in Si-N Cs due to t he change of the phase and elemental composition of a mul- ticomponent, complex structure of the surface of NCs por-Si. The increase the PhL signal at 100℃ both in air and in vacuum due to the removal of water, which screened emitting NCs centers. There is a second maxi- mum PhL at Tann. = 200℃ in air, which is more intense, than the first at 10 0℃. This maximum may be due to the formation of siloxane compounds during a nnealin g in air [8]. At this temperature annealing in vacuum formation of siloxane complexes does not occur, therefore the PhL signal don’t observed. Decreasing the PhL signal at 200℃ and above on air take place due to oxidation of the surface of Si-NCs. T his may be as a result of the formation of stable oxides at removing hydrogen from the complexes of the type Si6O3H6. The growth of the signal PhL intensity at Tann. above 200℃ in vacuum is explained due to the formation of different hydride complexes (SiyHx)n. At Tann. above 350 ℃ take place dehydrogenation surface emitting centers Si-NCs and as is observed a sharp decrease of PhL i ntensit y. T he ob se r ve s mal l inc r ea se o f t he intensi ty of the PhL signal at Ta nn.= 350℃ on air has a similar nature, as for por-Si samples a nneale d i n vac uum. The intensity of the long-wave part of the PhL spec- trum for 1 hour exposure of laser radiation decreases more strongly (8 times), than in the short-wave part (2 times). A further increase of exposure time practically does not change the intensity of the PhL spectra. The change of PhL intensity is reversible, after stop of illumination is observed the restoration of the original PhL intensity in during several hours. Such a reversible change signal PhL can be explained by changes in the dielectric constant of the medium surrounding the Si- NCs [6] through of photo-stimulated reactions on the surface of por-Si at illumination [8]. At this forms of dangling bonds and as a consequence non-emitting re- combination centers. At exposed on air take place re- versible “healing” of dangling bonds in the process of natural oxid atio n of t he surface o f N C s por-Si. Finally, the high-temperature annealing air at T = 800 ℃ leads to the appearance the PL signal (Figure 4 (a), (b)). This fact we associate with the internal of oxidized of silicon at these annealing temperatures on the air, when the formation of light-emitting centers in the form of oxides of silicon. Such is not observed during annealing in a vacuu m. 3. Conclusions Thus, 1) maximum intensity of PhL spectra of por-Si samples a t Tann. = 100 ℃ on air and in vacuum is changed of due to thermal desorption of H2O molecules from the surface of light-emitting centers in the por-Si; 2) long- wave part of the PhL spectrum of samples por-Si in the field λmax = 640 nm for freshly prepared samples is due to emitti ng rec ombinat ion of exc itons i n non-quan-tum-size crystallites por-Si dimensions, mainly of 10 nm - 20 nm and surface hydride complexes of the type (SixNy)n, formed in the process a pore formation; 3) low intensity short-wave part of the PhL spectrum of for freshly pre- pared samples in the region λmax = 440 nm due to of quantum-sized crystallites (1 nm to 1.5 nm); 4) thermal variation of the maxima of the intensity of the short and long-wave part of the PhL spectrum is due to the trans- formation of hydride SiH-bonds in the porous surface duri ng a n nea li n g in va c uu m a nd o n ai r i n t he tempe ra t ur e range Tann. = 200 ℃ - 400℃; 5) d egradation the emitting  K. B. TYNYSHTYKB AEV ET AL. Copyright © 2013 SciRes. OPJ 221 centers at Tann.> 400℃ and complete absence of PhL at Tann.> 500℃ are observed due to the delete of hydride SiH-bonds on the porous surface; 6) long excitation of PL leads to heating that transforms of hydride complexes. This fact confirms, that the light emitting centers are formed due to hydride coverages of surface NCs por-Si; 7) a nnealing at Tann = 8 00℃ of por-Si on air leads to the formation of light-emitting centers in the form of oxides of silicon. 4. Acknowledgements This work was supported financially by the Ministry of Science and Education of Republic of Kazakhstan. REFERENCES [1] A. S. Lenshin, V. M. Kashkarov, S. Y. Turishchev, et al., “Influen ce of Natural Aging on the Photoluminescen ce o f Porous Silicon,” Technica l Physics, Vol. 82, No. 2, 2012, pp. 150–152. [2] N. E. Korsunskaya, T. R. Stahr a, L. Y. Homenkova, et al., “Nature Emission of Porous Silicon Obtained by Chemi- cal Etching,” Semiconductors, Vol. 44, No. 1, 2010, pp. 82-86. doi:10.1134/S1063782610010136 [3] K. B. Tynyshtykbaev, Y. A. Ryabikin, S. Z. Tokmoldin, Т. Ajtmukan, B. A. Rakymeto v and R.B.Vermenichev, “Morphology of Porous Silicon under Long Anodic Etching in Electrolyte with Internal Current Source,” Technical Physics Letters, Vol. 36, No 6, 2010, pp. 538-540. [4] K. B. Tynyshtykbaev, Y. A. Ryabikin, K. A. Mit’, B. A. Rakymetov, Т. Ajtmukan, “Dynamics of Formation of Mosaic Structure of Porous Silicon at the Long-Term Anode Etching in Electrolytes with Internal Current”. Phys. Sol. State, Vol. 53, No. 8, 2011, pp. 1575-1580. [5] K. B. Tynyshtykbaev, “Self-Organization of Highly Or- dered Mosaic Structure of Porous Silicon at Long Anodic Etching of P-Type Silicon in the Electrolyte with Internal Current Source,” Proceedings of IEEE 2011, Vol. 7, pp. 6528-6531,2011. [6] K. N. Yeltsov, V. A. Karavanskii, V. V. Martynov, “Modifica t ion of Porous Silicon in Ultrahigh Vacuum and the Contribution of Graphite Nanocrystallites Photolumi- nescence,” JETP Lett., Vol. 63, No 2, 1996, pp. 106-111. [7] V. A. Kiselev, S. V. Polisadin and A. V. Postnikov, “Change the Optical Properties of Porous Silicon Due to Thermal Annealing in A Vacuum,” Semiconductors, 1997, Vol. 31, No. 7, pp. 830 -832. doi:10.1134/1.1187071 [8] B. M. Kostishko, I. P. Puzov and Ya. S. Nagornov, “Sta- bilization of Light-Emitting Properties of Porous Silicon Thermal Vacuum Annealing,” Technical Physics Letters, Vol.26, No.1,2000, pp. 50-55. doi:10.1134/1.1262728 [9] B. M. Bulakh, N. E. Korsunskaya and L. Yu. Homenkova et al., “The Effec t of Oxidation on the Efficienc y and the Luminescence Spectrum of Porous Silicon,” Semicon- ductors, Vol.40, No.5, 2006, pp. 614-620. [10] T. P. Kolmakov, V. G. Baru, B. A. Malakho v et al., “Electro-and Photoluminescence in Thin Films of Porous Silicon,” JETP Letters, Vol. 57, No. 7, 1993, pp.398-401. [11] G. Polissky, O. M. Sreseli, A. V. Andrianov, F. Koch. “Luminescence of Porous Silicon in the IR Spectrum at Room Temperature,” Semiconductors, Vol.31, No 3, 1997, pp. 365- 369. [12] P. K. Kashkarov, E. A. Konstantinova, S. A. Petrova, et al., “On the Temperature Dependence of Photolumines- cence of Porous Silicon,” Semiconductors, Vol . 31 , No. 6, 1997, pp.745-748. doi:10.1134/1.1187234 [13] N. E. Korsunskaya, T. B. Torchinsky, B. R. Dju maev, et al., “Two Sources of Photoluminescence of Porous Sili- con,” Semiconductors, Vol. 31 , No. 8, 1997, pp. 908-911. doi:10.1134/1.1187246 [14] A. I. Belogorokhov, V. A. Karavanskii and L. I Belogorokhov, “The Relationship Between th e Si gna l and the Photoluminescence of Porous Silicon Surface States, Including “free” of Porous Silicon,” Semiconductors, Vol. 30, No 7, 1999, pp. 1177-1185. [15] A. S. Lenshin, V. M. Kashkarov, S . Ya. Turishchev, et al., “Influen ce of Natural Aging on the Photoluminescen ce o f Porous Silicon,” Technical Physics Letters, Vol. 37, No.17, 2011, pp. 1- 8. |