

Paper Menu >>
Journal Menu >>
 Journal of Water Resource and Protection, 2013, 5, 10-17 http://dx.doi.org/10.4236/jwarp.2013.57A003 Published Online July 2013 (http://www.scirp.org/journal/jwarp) Application of Modified Bagasse as a Biosorbent for Reactive Dyes Removal from Industrial Wastewater Abd El-Aziz A. Said1*, Aref A. M. Aly1, Mohamed M. Abd El-Wahab1, Soliman A. Soliman1, Aly A. Abd El-Hafez1, V. Helmey2, Mohamed N. Goda1 1Chemistry Department, Faculty of Science, Assiut University, Assiut, Egypt 2 Mechanical Engineering Department, Faculty of Engineering, Assiut University, Assiut, Egypt Email: *[email protected] Received April 15, 2013; revised May 18, 2013; accepted June 25, 2013 Copyright © 2013 Abd El-Aziz A. Said et al. This is an open access article distributed under the Creative Commons Attribution Li- cense, which permits unrestricted use, distribution, and reproduction in any medium, provided the original work is properly cited. ABSTRACT Propionic acid modified bagasse was used for the removal of reactive yellow 2 and reactive blue 4. The effects of pH, contact time, initial dye concentrations, adsorbent particle size and adsorbent dose on the adsorption of the two dyes were investigated. Additionally, the desorption process and intra-particle diffusion were studied. Acidic pH values were favorable for adsorption of both dyes. The equilibrium adsorption data were best fitted with the Freundlich isotherm for reactive yellow 2 and the Langmiur isotherm for reactive blue 4. The values of their corresponding constants were de- termined. The kinetic for dye adsorption is well described by a pseudo-first order kinetic model for the reactive yellow 2 and by pseudo-second order for the reactive blue 4. The investigation revealed that the hydroxyl groups of bagasse and the carboxylic group of propionic acid play a great role in the removal of both reactive dyes. Keywords: Modified Bagasse; Reactive Yellow 2; Reactive Blue 4; Adsorption; Kinetics 1. Introduction Dyes are widely used in many industries such as textile, plastic, paper, food and cosmetic for coloring their prod- ucts. These dyes are water pollutants and cause environ- mental hazards. In addition, many dyes are difficult to be biodegradable and tend to persist in the environment cre- ating serious water quality and public health problems. So, a conventional biological treatment process is not very effective in treating dyes wastewater. There are various methods for removing dyes including coagula- tion and flocculation [1], oxidation or ozonation [2] and membrane separation [3]. However, these processes are very expensive and cannot be effectively used to treat the wide range of dyes waste. Alternative methods include adsorption on natural biosorbents which are becoming now of high interest for removal of dyes from waste ef- fluents. In this way several studies have used natural ma- terials locally available, renewable and of low costs [4-6]. Among these sorbents are banana, bagasse, coir pith, palm-fruit bunch, apple-pomace, wheat straw, rice husk, pine sawdust, peanut hull, coffee husk, maize cob, or- ange peel, sugar cane dust and luffa fiber [7-9]. Recently, sugarcane bagasse was used as potential low- cost adsorbent for removal of many dyes from wastewater [10-14]. Reactive dyes are generally used for colouring cotton and other cellulosic material, but are also applied to a small extent on wool and nylon. In the present study re- moval of reactive yellow 2 and reactive blue 4 from aqueous solutions using bagasse pre-treated with propi- onic acid was investigated. Several parameters have been studied such as pH, contact time, biomass dosage, and particle size and desorption process. The equilibrium sorption capacity and the kinetic adsorption of both dyes on the modified bagasse were studied. The selection of bagasse for this study was based on low cost raw mate- rial and environmental impact. 2. Materials and Methods Reactive yellow 2 and reactive blue 4 dyes were pur- chased from Sigma-Aldrish Chemical Co. The chemical structures of the two dyes are presented in Figure 1. 2.1. Preparation of Adsorbent Sugar cane bagasse modified with propionic acid was previously described [13]. *Corresponding author. C opyright © 2013 SciRes. JWARP 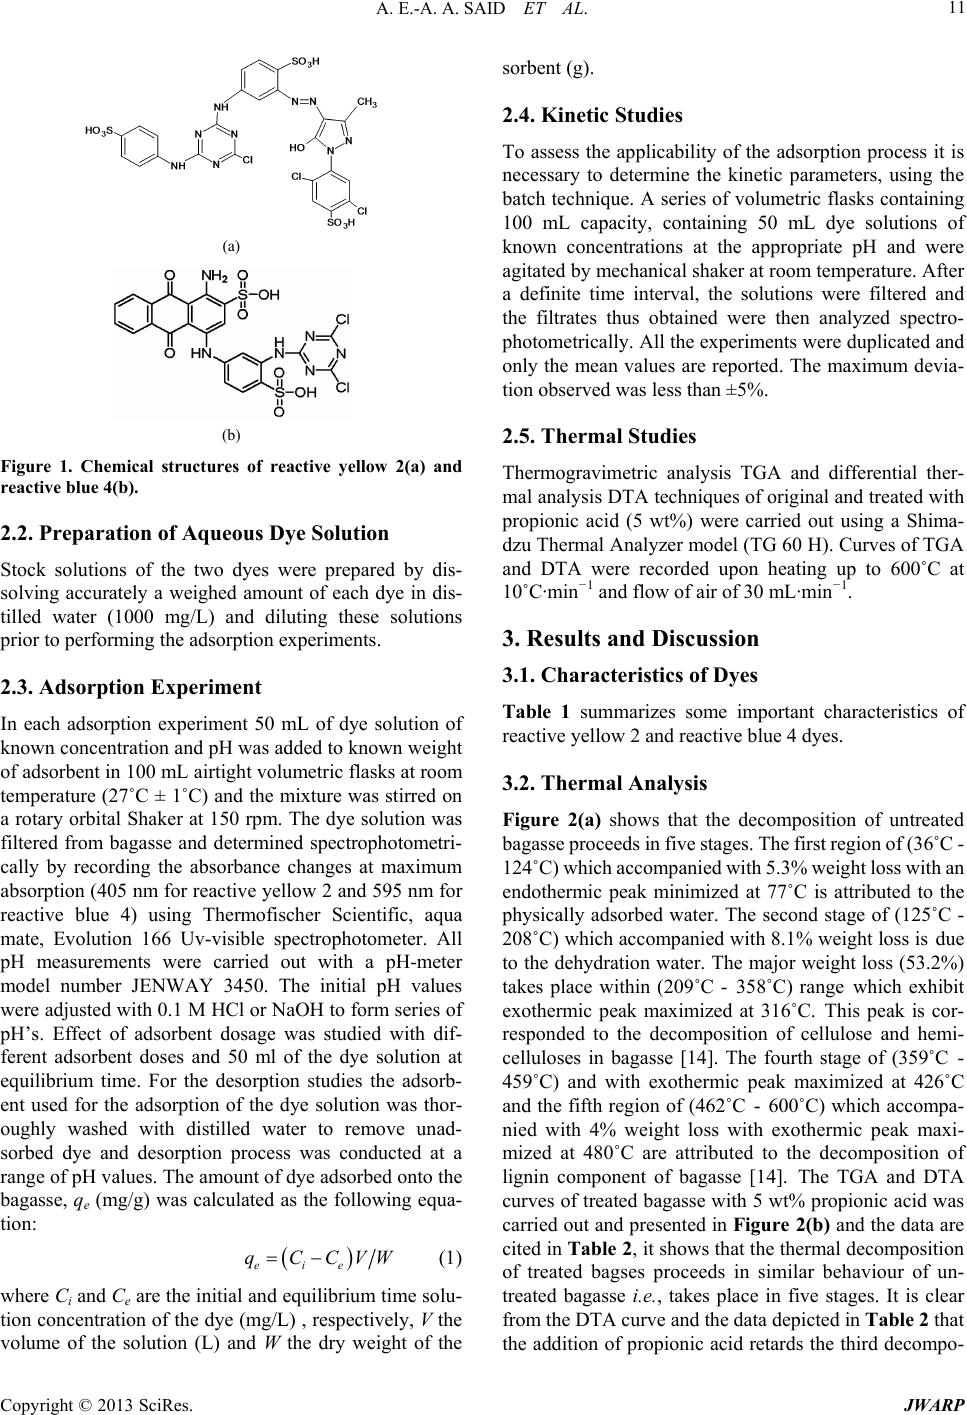 A. E.-A. A. SAID ET AL. 11 (a) (b) Figure 1. Chemical structures of reactive yellow 2(a) and reactive blue 4(b). 2.2. Preparation of Aqueous Dye Solution Stock solutions of the two dyes were prepared by dis- solving accurately a weighed amount of each dye in dis- tilled water (1000 mg/L) and diluting these solutions prior to performing the adsorption experiments. 2.3. Adsorption Experiment In each adsorption experiment 50 mL of dye solution of known concentration and pH was added to known weight of adsorbent in 100 mL airtight volumetric flasks at room temperature (27˚C ± 1˚C) and the mixture was stirred on a rotary orbital Shaker at 150 rpm. The dye solution was filtered from bagasse and determined spectrophotometri- cally by recording the absorbance changes at maximum absorption (405 nm for reactive yellow 2 and 595 nm for reactive blue 4) using Thermofischer Scientific, aqua mate, Evolution 166 Uv-visible spectrophotometer. All pH measurements were carried out with a pH-meter model number JENWAY 3450. The initial pH values were adjusted with 0.1 M HCl or NaOH to form series of pH’s. Effect of adsorbent dosage was studied with dif- ferent adsorbent doses and 50 ml of the dye solution at equilibrium time. For the desorption studies the adsorb- ent used for the adsorption of the dye solution was thor- oughly washed with distilled water to remove unad- sorbed dye and desorption process was conducted at a range of pH values. The amount of dye adsorbed onto the bagasse, qe (mg/g) was calculated as the following equa- tion: eie CVWqC (1) where Ci and Ce are the initial and equilibrium time solu- tion concentration of the dye (mg/L) , respectively, V the volume of the solution (L) and W the dry weight of the sorbent (g). 2.4. Kinetic Studies To assess the applicability of the adsorption process it is necessary to determine the kinetic parameters, using the batch technique. A series of volumetric flasks containing 100 mL capacity, containing 50 mL dye solutions of known concentrations at the appropriate pH and were agitated by mechanical shaker at room temperature. After a definite time interval, the solutions were filtered and the filtrates thus obtained were then analyzed spectro- photometrically. All the experiments were duplicated and only the mean values are reported. The maximum devia- tion observed was less than ±5%. 2.5. Thermal Studies Thermogravimetric analysis TGA and differential ther- mal analysis DTA techniques of original and treated with propionic acid (5 wt%) were carried out using a Shima- dzu Thermal Analyzer model (TG 60 H). Curves of TGA and DTA were recorded upon heating up to 600˚C at 10˚C·min −1 and flow of air of 30 mL·min−1. 3. Results and Discussion 3.1. Characteristics of Dyes Table 1 summarizes some important characteristics of reactive yellow 2 and reactive blue 4 dyes. 3.2. Thermal Analysis Figure 2(a) shows that the decomposition of untreated bagasse proceeds in five stages. The first region of (36˚C - 124˚C) which accompanied with 5.3% weight loss with an endothermic peak minimized at 77˚C is attributed to the physically adsorbed water. The second stage of (125˚C - 208˚C) which accompanied with 8.1% weight loss is due to the dehydration water. The major weight loss (53.2%) takes place within (209˚C - 358˚C) range which exhibit exothermic peak maximized at 316˚C. This peak is cor- responded to the decomposition of cellulose and hemi- celluloses in bagasse [14]. The fourth stage of (359˚C - 459˚C) and with exothermic peak maximized at 426˚C and the fifth region of (462˚C - 600˚C) which accompa- nied with 4% weight loss with exothermic peak maxi- mized at 480˚C are attributed to the decomposition of lignin component of bagasse [14]. The TGA and DTA curves of treated bagasse with 5 wt% propionic acid was carried out and presented in Figure 2(b) and the data are cited in Table 2, it shows that the thermal decomposition of treated bagses proceeds in similar behaviour of un- treated bagasse i.e., takes place in five stages. It is clear from the DTA curve and the data depicted in Table 2 that the addition of propionic acid retards the third decompo- Copyright © 2013 SciRes. JWARP 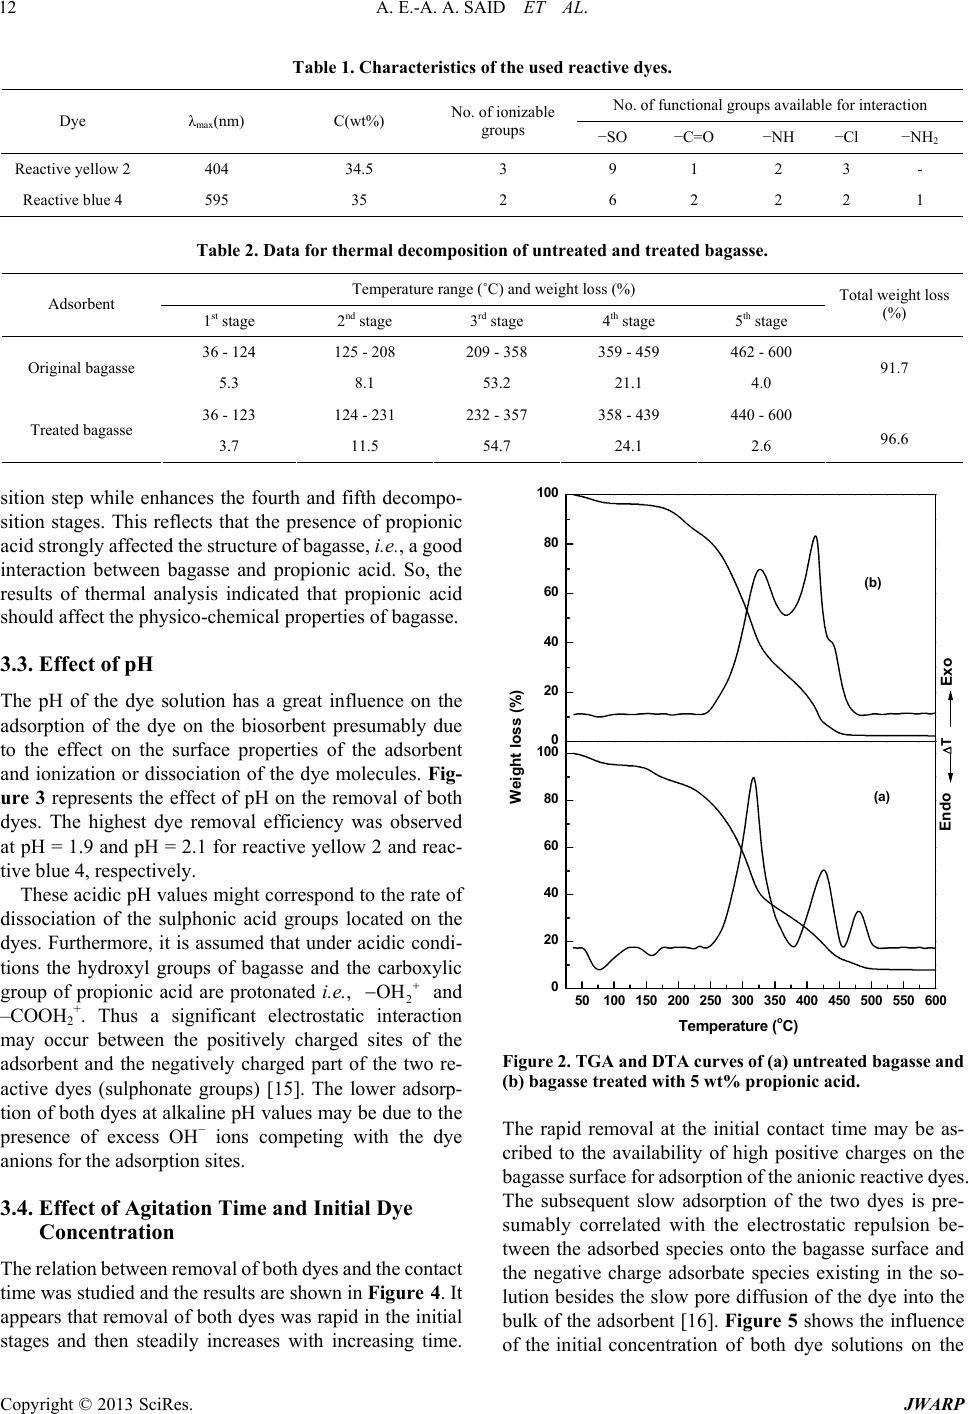 A. E.-A. A. SAID ET AL. JWARP 12 Table 1. Characteristics of the used reactive dyes. No. of functional groups available for interaction Dye λmax (nm) C(wt%) No. of ionizable groups −SO −C=O −NH −Cl −NH2 Reactive yellow 2 404 34.5 3 9 1 2 3 - Reactive blue 4 595 35 2 6 2 2 2 1 Table 2. Data for thermal decomposition of untreated and treated bagasse. Temperature range (˚C) and weight loss (%) Adsorbent 1st stage 2nd stage 3rd stage 4th stage 5th stage Total weight loss (%) 36 - 124 125 - 208 209 - 358 359 - 459 462 - 600 Original bagasse 5.3 8.1 53.2 21.1 4.0 91.7 36 - 123 124 - 231 232 - 357 358 - 439 440 - 600 Treated bagasse 3.7 11.5 54.7 24.1 2.6 96.6 Copyright © 2013 SciRes. sition step while enhances the fourth and fifth decompo- sition stages. This reflects that the presence of propionic acid strongly affected the structure of bagasse, i.e., a good interaction between bagasse and propionic acid. So, the results of thermal analysis indicated that propionic acid should affect the physico-chemical properties of bagasse. 3.3. Effect of pH The pH of the dye solution has a great influence on the adsorption of the dye on the biosorbent presumably due to the effect on the surface properties of the adsorbent and ionization or dissociation of the dye molecules. Fig- ure 3 represents the effect of pH on the removal of both dyes. The highest dye removal efficiency was observed at pH = 1.9 and pH = 2.1 for reactive yellow 2 and reac- tive blue 4, respectively. These acidic pH values might correspond to the rate of dissociation of the sulphonic acid groups located on the dyes. Furthermore, it is assumed that under acidic condi- tions the hydroxyl groups of bagasse and the carboxylic group of propionic acid are protonated i.e., 2 OH 50100 150 200 250 300 350 400 450 500 550 600 0 20 40 60 80 100 and –COOH2+. Thus a significant electrostatic interaction may occur between the positively charged sites of the adsorbent and the negatively charged part of the two re- active dyes (sulphonate groups) [15]. The lower adsorp- tion of both dyes at alkaline pH values may be due to the presence of excess OH− ions competing with the dye anions for the adsorption sites. 0 20 40 60 80 100 3.4. Effect of Agitation Time and Initial Dye Concentration The relation between removal of both dyes and the contact time was studied and the results are shown in Figure 4. It appears that removal of both dyes was rapid in the initial stages and then steadily increases with increasing time. Temper ature (oC) Weight loss (%) (a) (b) TExo Endo Figure 2. TGA and DTA curves of (a) untreated bagasse and (b) bagasse treated with 5 wt% propionic acid. The rapid removal at the initial contact time may be as- cribed to the availability of high positive charges on the bagasse surface for adsorption of the anionic reactive dyes. The subsequent slow adsorption of the two dyes is pre- sumably correlated with the electrostatic repulsion be- tween the adsorbed species onto the bagasse surface and the negative charge adsorbate species existing in the so- lution besides the slow pore diffusion of the dye into the bulk of the adsorbent [16]. Figure 5 shows the influence of the initial concentration of both dye solutions on the 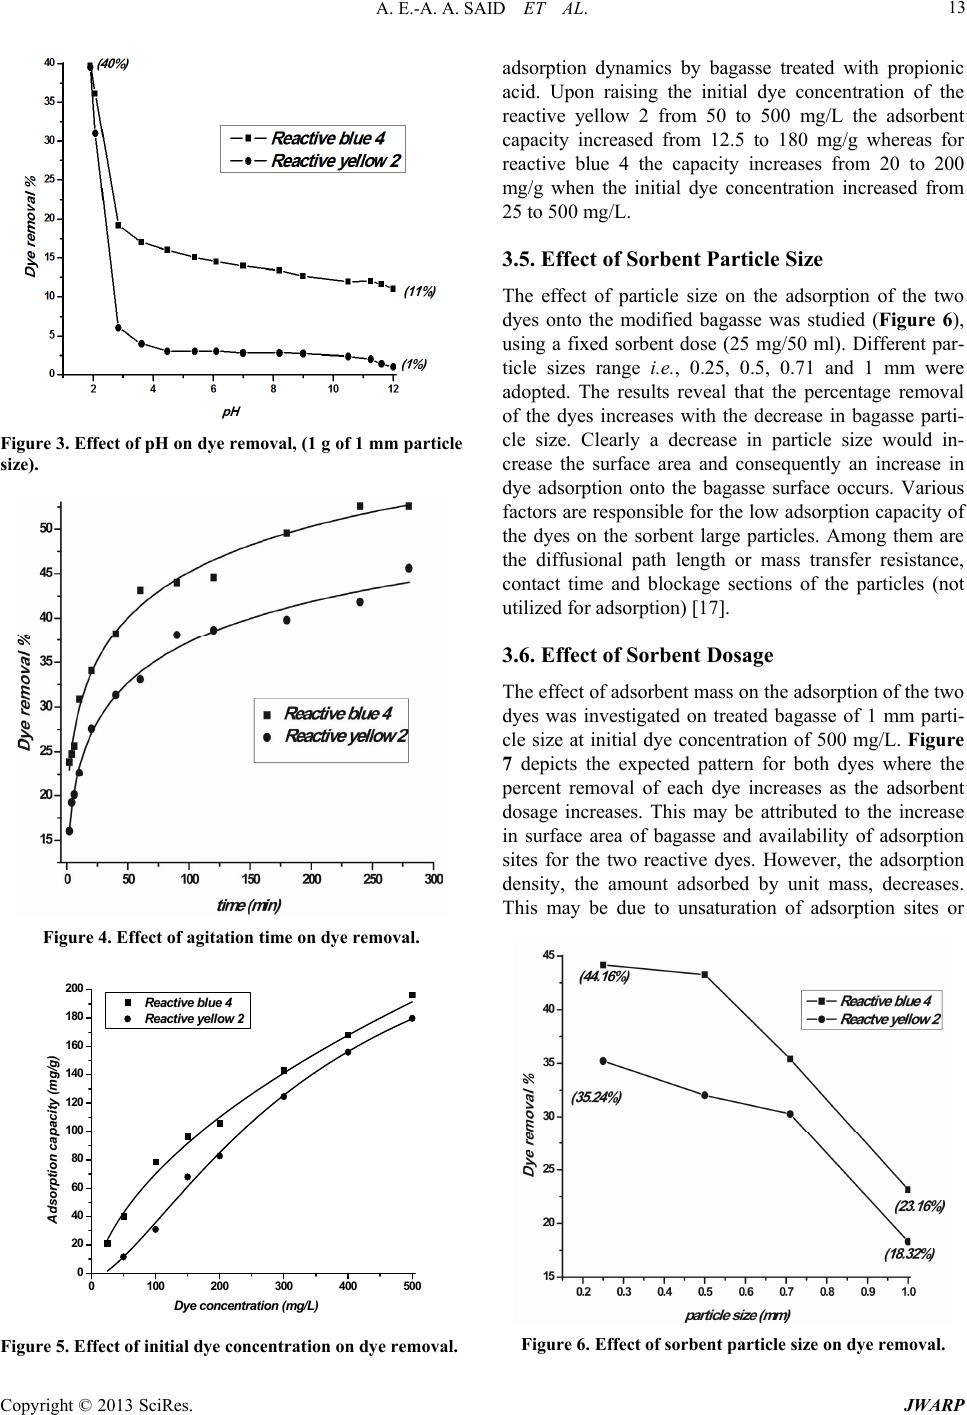 A. E.-A. A. SAID ET AL. 13 Figure 3. Effect of pH on dye removal, (1 g of 1 mm particle size). Figure 4. Effect of agitation time on dye removal. 0100 200 300 0 20 40 60 80 100 120 140 160 180 200 400 500 Reactive blue 4 Reactive yellow 2 Adsorption capacity (mg/g) Dye concentration (mg/L) Figure 5. Effect of initial dye concentration on dye removal. adsorption dynamics by bagasse treated with propionic acid. Upon raising the initial dye concentration of the reactive yellow 2 from 50 to 500 mg/L the adsorbent capacity increased from 12.5 to 180 mg/g whereas for reactive blue 4 the capacity increases from 20 to 200 mg/g when the initial dye concentration increased from 25 to 500 mg/L. 3.5. Effect of Sorbent Particle Size The effect of particle size on the adsorption of the two dyes onto the modified bagasse was studied (Figure 6), using a fixed sorbent dose (25 mg/50 ml). Different par- ticle sizes range i.e., 0.25, 0.5, 0.71 and 1 mm were adopted. The results reveal that the percentage removal of the dyes increases with the decrease in bagasse parti- cle size. Clearly a decrease in particle size would in- crease the surface area and consequently an increase in dye adsorption onto the bagasse surface occurs. Various factors are responsible for the low adsorption capacity of the dyes on the sorbent large particles. Among them are the diffusional path length or mass transfer resistance, contact time and blockage sections of the particles (not utilized for adsorption) [17]. 3.6. Effect of Sorbent Dosage The effect of adsorbent mass on the adsorption of the two dyes was investigated on treated bagasse of 1 mm parti- cle size at initial dye concentration of 500 mg/L. Figure 7 depicts the expected pattern for both dyes where the percent removal of each dye increases as the adsorbent dosage increases. This may be attributed to the increase in surface area of bagasse and availability of adsorption sites for the two reactive dyes. However, the adsorption density, the amount adsorbed by unit mass, decreases. This may be due to unsaturation of adsorption sites or Figure 6. Effect of sorbent particle size on dye removal. Copyright © 2013 SciRes. JWARP  A. E.-A. A. SAID ET AL. 14 Figure 7. Effect of bagasse dosage on dye removal. due to some sort of particle interaction such as aggrega- tion which will decrease the total surface area of adsorb- ent and consequently an increase in the diffusion path length [18]. It is clear from the obtained results that the removal of reactive blue 4 is more pronounced relative to that of reactive yellow 2 upon increasing of the bagasse weight above 1 gm. 3.7. Adsorption Isotherms The adsorption isotherms are important to optimize the design of an adsorption system to remove the dye. The parameters obtained from the different isotherms provide important information about the adsorption mechanisms and surface properties. The most widely accepted surface adsorption models are those of Freundlich and Langmuir. 3.7.1. Freundlic h Isotherm Freundlich isotherm is expressed as. 1n eFe qKC (2) where qe (mg/g) is the amount of dye adsorbed at equi- librium, Ce (mg/L) is the equilibrium liquid-phase con- centration of the dye and KF is a constant related to the bonding energy and adsorption capacity. 1/n indicates the adsorption intensity of dye onto the adsorbent and the type of isotherm to be irreversible (1/n = 0), favorable (0 < 1/n < 1) and unfavorable (1/n < 1). Equation (2) can be arranged to a linear form: 1log e nC 1.5 1.6 1.7 1.8 1.9 2.0 2.12.2 2.3 0.0 0.2 0.4 0.6 0.8 1.0 1.2 l og qe log C log log eF qK (3) To study the applicability of the Freundlich equation for dye absorption onto bagasse a linear plot of log qe versus log Ce is plotted and presented in Figure 8 and the calculated parameters for Freundlich linear equation are shown in Table 3. The reactive yellow 2 adsorption by e Figure 8. Freundlich isotherm for the sorption of reactive yellow 2 at pH 1.9. Table 3. Langmiur and Freundlic h isotherm parameters for reactive yellow 2 and reactive blue 4 on modified bagasse. Freundlich Dye R2 KF 1/n Reactive yellow 20.9916 0.0045 1.5439 Reactive blue 4- - - Langmuir Dye R2 Qm(mg/g) a(L/mg) Reactive yellow 2- - - Reactive blue 40.9956 13.2 0.052 modified bagasse fitted the Freundlich model well with R2 = 0.9916. The linear plot suggests the applicability of the Freundlich equation. The 1/n is lower than 1.0, indicating that reactive yellow 2 is favorably adsorbed by the pre- treated bagasse. On the other hand the linear plot of the Freundlich equation is not valid for reactive blue 4. 3.7.2. Langmiur Isotherm The Langmiur equation is expressed as follows: 1 eme e qaQC aC (4) where qe and Ce are defined as in Freundlich equation, Qm is the maximum adsorption capacity and a is the Langmiur constant. Its linear form is expressed as: 1 eeme m CqaQ CQ (5) The Qm and a values can be obtained from the slope (1/Qm) and the intercept (1/a Qm) of the linear plot Ce/qe versus Ce. Figure 8 illustrates the linear form of Langmuir isotherm of the reactive blue 4 and the calculated pa- Copyright © 2013 SciRes. JWARP  A. E.-A. A. SAID ET AL. 15 rameters are included in Table 3. It is clear from Figure 9 that the adsorption of the reactive blue 4 fits very well the Langmuir equation with R2 = 0.9956 while the data do not fit with the Freundlich equation . 0 10203040 0.6 0.7 0.8 0.9 1.0 3.8. Adsorption Kinetics log (qe-qt) time (min) 0 1020304050607080 0.0 0.5 1.0 1.5 2.0 2.5 3.0 3.5 4.0 In order to investigate the adsorption process of the reac- tive dyes by pretreated bagasse, pseudo-first order (Equa- tion (6)) and pseudo-second order (Equation (7)) kinetic models were used. 12.303 e qktlog log et qq (6) And 1 te h tq 2 kq 140 160 tq (7) where qe is the amount of dye sorbed at equilibrium (mg/ g), qt is the amount of dye sorbed at time t (mg/g), k1 is the rate constant of the pseudo-first order sorption (min−1), h 2e is the initial adsorption rate (mg/g·min) and k2 is the rate constant of pseudo-second order kinetics (mg/g min). Fi gure 10 shows that the pseudo first order equation fits well for the adsorption of reactive yellow 2 whereas the pseudo-second order equation is not valid. Moreover, the correlation coefficient R2 and K1 were calculated from the intercept and slope respectively and presented in Ta- ble 4. The linear plot of t/qt versus t for reactive blue 4 shows a good linear relationship, Figure 11. On the other hand the applicability of the pseudo-first order equation on the adsorption of reactive blue 4 was found not appli- cable. The correlation coefficient R2 and K2 were calcu- lated from the intercept and the slope respectively and recorded in Table 4. From Table 4, the correlation coefficients for the first and second order kinetic models are greater than 0.99 which led to believe that the first and second order equa- 020 40 60 80100120 2 4 6 8 10 12 1 4 Ce/qe (g/L) Ce (mg/L) Figure 9. Linear f orm o f th e Langmuir is oth erm for re a ctive blue 4 at pH 2.1. Figure 10. Pseudo-first order plot for the desorption of re- active yellow 2 at pH 1.9. t/ q t (min g/mg) time (min) Figure 11. Pseudo-second order plot for adsorption of reac- tive blue 4 at pH 2.1. Table 4. Comparison of the first and second order adsorp- tion rate constants and the correlation coefficients. Pseudo-first order Pseudo-second order Dye R2 K 1 (min−1) R2 K2 (g·mg−1·min−1) Reactive yellow 2 0.9945 0.0248 - - Reactive blue 4 - - 0.9950 0.0106 tions provided good correlations for the biosorption of reactive yellow 2 and reactive blue 4 respectively, on modified bagasse. 3.9. Intra-Particle Diffusion The intra-particle diffusion model was applied to test the Copyright © 2013 SciRes. JWARP  A. E.-A. A. SAID ET AL. 16 possibility of intra-particle diffusion of reactive yellow 2 and reactive blue 4 into pre-treated bagasse. The adsorp- tion process involves a transport of solute from the aqueous phase to the surface of the solid particles with a subsequent diffusion of the dye molecules into the inte- rior pores which is a slow process and is therefore, a rate determining step. The particle diffusion model is ex- pressed by the following equation [19]: 12 td qKt C 246810 8 10 12 14 16 18 20 (8) where C (mg/g) is the intercept and Kd is the intra-parti- cle diffusion rate constant (mg/g·min−1/2). Two intersect- ing linear plots are obtained for both dyes indicating dif- fusion of the dye molecules into macro- and micropores of bagasse. If the mechanism of adsorption follows on intra-particle diffusion process, the plot of qt versus t1/2 should be straight line and pass through origin. Figure 12 shows that there are two separate regions that repre- sent the steps involved during the process of adsorption. The initial straight line is due to the bulk diffusion while the second straight line corresponds to the intra-particle diffusion for both dyes. The plots were not best-fit straight lines passing through the origin. This phenome- non indicates that there is a boundary layer resistance. One of the possible reasons for the deviation of the straight line from the origin is that there is a difference in the rate of mass transfer in the initial and final stages of dye adsorption. The results of the experiment suggest that the intra-particle diffusion is not the only step con- trolling adsorption of the two dyes [20]. 3.10. Desorption and Reuse A further goal of any adsorbent used is reuse potential. So, before the investigation of reuse, the adsorption ex- periments were carried out to find the optimum pH-de- sorption conditions. Figure 13 shows the effect of pH values on the desorption process of the two dyes. It shows that the two dyes are stable at lower pHs whereas increasing pH higher than 10 results in a rapid desorption of both dyes from bagasse surface. It is thus to be con- cluded that the two reactive dyes are stable in the pH range 3 - 10 for reactive yellow 2 and 6 - 10 for reactive blue 4 while they may be completely recovered from the treated bagasse surface at pH = 12 and higher. It is of interest to mention here that these results are in agree- ment with the results presented in Figure 2 which show that the remarkable dye removal of both dyes on modi- fied bagasse was at lower pH values. 4. Conclusion Modified bagasse by propionic acid is an effective bio- sorbent for the removal of both reactive yellow 2 and reactive blue 4 dyes from wastewater. The maximum 12 14 16 18 20 22 R eactive blue 4 t (mg/g) t1/2 R eactive yellow 2 q Figure 12. Intra-particle diffusion model for reactive yellow 2 at pH 1.9 and reactive blue 4 at pH 2.1. 24681012 0 10 20 30 40 50 60 70 80 90 100 Reactve blue 4 Reactive yellow 2 D esorption % pH Figure 13. Effect of pH on the desorption process of the two dyes. removal was observed at pH = 1.9 and pH = 2.1 for reac- tive yellow 2 and reactive blue 4, respectively. Moreover, the decrease of particle size of adsorbent was accompa- nied with a pronounced removal of both dyes. The equi- librium adsorption was best fitted with the Frundlich isotherm for reactive yellow 2 and with the Langmuir isotherm for reactive blue 4. Adsorption kinetics revealed Copyright © 2013 SciRes. JWARP  A. E.-A. A. SAID ET AL. Copyright © 2013 SciRes. JWARP 17 that reactive yellow 2 is well described by a pseudo-first order whereas reactive blue 4 fits good for pseudo-second order. Modified bagasse can be reused by desorption of both dyes in the pH = 12 and higher. The hydroxyl and carboxylic groups from bagasse and propionic acid re- spectively enhance the removal of both reactive dyes. 5. Acknowledgements The authors would like to thank the financial supports from the Science and Technology for Development Fund, STDF, Ministry of Higher Education, Egypt. REFERENCES [1] J. J. M. Orfao, A. I. M. Silva, J. C. V. Pereira, S. A. Barata, I. M. Fonseca, P. C. C. Faria and M. F. R. Pereira, “Adsorption of Reactive Dyes on Chemically Modified Activated Carbons—Influence of pH,” Journal of Col- loids and Interfaces Science, Vol. 296, 2006, pp. 480-489. doi:10.1016/j.jcis.2005.09.063 [2] P. K. Malik and S. K. Saha, “Oxidation of Direct Dyes with Hydrogen Peroxide Using Ferrous Ion as Catalyst,” Separation and Purification Technology, Vol. 31, No. 3, pp. 241-250. doi:10.1016/S1383-5866(02)00200-9 [3] G. Ciadelli, L. Coris and M. Marcucci, “Membrane Sepa- ration for Wastewater Reuse in the Textile Industry,” Re- source Conservation and Recycling, Vol. 31, No. 2, 2000, pp. 189-197. doi:10.1016/S0921-3449(00)00079-3 [4] Z. Aksu and I. A. Isoglu, “Use of Agricultural Waste Sugar Beet Pulp for the Removal of Gemazol Turquoise Blue-G reactive Dye from Aqueous Solution,” Journal of Hazardous Materials, Vol. 137, No. 1, 2006, pp. 418-430. doi:10.1016/j.jhazmat.2006.02.019 [5] T. Robinson, B. Chandran and P. Nigam, “Removal of Dyes from a Synthetic Textile Dye Effluent by Biosorp- tion on Apple Pomace and Wheat Straw,” Water Re- sources, Vol. 36, No. 11, 2002, pp. 2824-2830. [6] Y-S. Ho, T-H. Chiang and Y-M. Hsueh, “Removal of Basic Dye from Aqueous Solution Using Tree Fern as a Biosorbent,” Process Biochemistry, Vol. 40, No. 1, 2005, pp. 119-124. doi:10.1016/j.procbio.2003.11.035 [7] V. K. Gupta and Suhas, “Application of Low-Cost Ad- sorbents for Dye Removal—A Review,” Journal of En- vironmental Management, Vol. 90, No. 8, 2009, pp. 2313-2342. doi:10.1016/j.jenvman.2008.11.017 [8] H. Demir, A. Top, D. Balkose and S. ülkü, “Dye Adsorp- tion Behavior of Luffacylindrica Fibers,” Journal of Ha- zardous Materials, Vol. 153, No. 1-2, 2008, pp. 389-394. doi:10.1016/j.jhazmat.2007.08.070 [9] N. M. Mahmoodi, M. Arami, H. Bahrami and S. Khor- ramfar, “Novel Biosorbent (Canola Hull): Surface Char- acterization and Dye Removal Ability at Different Cati- onic Dye Concentration,” Desalination, Vol. 264, No. 1-2, 2010, pp. 134-142. doi:10.1016/j.desal.2010.07.017 [10] A. A. M. Aly, A. A. Said, A. A. Abd El-Hafez, M. N. Goda and V. Helmey, “Acid Pretreated Bagasse as a Suit- able Biosorbent for Direct Red 81 Removal,” Proceed- ings of 2010 International Conference on Environmental Engineering and Applications, 10-12 September 2010, Singapore, pp. 151-153. [11] S. A. Saad, K. M. Isa and R. Bahari, “Chemically Modi- fied Sugarcane Bagasse as a Potentially Low-Cost Bio- sorbent for Dye Removal,” Desalination, Vol. 264, No. 1, 2010, pp. 123-128. doi:10.1016/j.desal.2010.07.015 [12] Z. Zhang, L. Moghaddam, I. M. O’Hara and O. S. W. Doherty, “Congo Red Adsorption by Ball-Milled Sugar- cane Bagasse,” Chemical Engineering Journal, Vol. 178, 2011, pp. 122-128. doi:10.1016/j.cej.2011.10.024 [13] A. A. Said, A. A. M. Aly, M. M. M. Abd El-Wahab, S. A. Soliman, A. A. Abd El-Hafez, V. Helmey and M. N. Goda, “Potential Application of Propionic Acid Modified Sug- arcane Bagasse for Removal of Basic and Acid Dyes from Industrial Wastewater,” Resources and Environment, Vol. 2, No. 3, 2012, pp. 93-99. doi:10.5923/j.re.20120203.03 [14] G.-B. Jiang, Z.-T.lin, X.-Y. Haung, Y.-Q. Zehang, C.-C. Ren, C.-K. Haung and Z.-Y. Haung, “Potential Biosor- bent Based on Sugarcane Bagasse Modified with Tetra- ethylenepentamine for Removal of Eosin Y,” Interna- tional Journal Biological Macromolecules, Vol. 50, No. 3, 2012, pp. 707-712. doi:10.1016/j.ijbiomac.2011.12.030 [15] M. A. Kalaf, “Biosorption of Reactive Dye from Textile Wastewater by Non-Viable Biomass of Aspergillusniger and Spirogyra sp,” Bioresource Technology, Vol. 99, No. 14, 2008, pp. 6631-6634. doi:10.1016/j.biortech.2007.12.010 [16] Y. S. Al-Degs, M. I. El-Barghouthi, A. H. El-Sheikh and G. M. Walker, “Effect of Solution pH, Ionic Strength, and Temperature on Adsorption Behaviour of Reactive Dyes on Activated Carbon,” Dyes and Pigments, Vol. 77, No. 1, 2008, pp. 16-23. doi:10.1016/j.dyepig.2007.03.001 [17] M. Özacar and I. A. Sengil, “Adsorption of Metal Com- plex Dyes from Aqueous Solutions by Pine Sawdust,” Bioresource Technology, Vol. 96, No. 7, 2005, pp. 791- 795. doi:10.1016/j.biortech.2004.07.011 [18] L. J. Yu, S. S. Shukla, K. L. Dorris, A. Shukla and J. L. Margrave, “Adsorption of Chromium from Aqueous So- lutions by Maple Sawdust,” Journal of Hazardous Mate- rials, Vol. 100, No. 1-3, 2003, pp. 53-63. doi:10.1016/S0304-3894(03)00008-6 [19] W. J. Weber and J. C. Morris, “Kinetics of Adsorption on Carbon from Solution,” Journal of the Sanitary Engi- neering Division, Vol. 89, No. 2, 1963, pp. 31-60. [20] Y. Bulut, N. Gozubenli and H. Aydin, “Equilibrium and Kinetics Studies of Adsorption of Direct Blue 71 from Aqueous Solution by Wheat Shells,” Journal of Hazard- ous Materials, Vol. 144, No. 1-2, 2007, pp. 300-306. doi:10.1016/j.jhazmat.2006.10.027 |