

Paper Menu >>
Journal Menu >>
 Journal of Modern Physics, 2013, 4, 45-51 http://dx.doi.org/10.4236/jmp.2013.47A2007 Published Online July 2013 (http://www.scirp.org/journal/jmp) Miscibility Behavior of Polyacrylamides Poly(Ethylene Glycol) Blends: Flory Huggins Interaction Parameter Determined by Thermal Analysis Maria Elisa S. R. Silva1*, Valdir Mano2, Raquel R. J. Pacheco1, Roberto F. S. Freitas1 1Department of Chemical Engineering, Federal University of Minas Gerais, Belo Horizonte, Brazil 2Department de Natural Sciences, Federal University of São João del Rei, São João del Rei, Minas Gerais, Brazil Email: *[email protected] Received May 1, 2013; revised June 5, 2013; accepted July 3, 2013 Copyright © 2013 Maria Elisa S. R. Silva et al. This is an open access article distributed under the Creative Commons Attribution License, which permits unrestricted use, distribution, and reproduction in any medium, provided the original work is properly cited. ABSTRACT Blends of polyacrylamide—PAM, poly(N-isopropylacrylamide)—PNIPAAm, poly(N-tert-butylacrylamide)—PTBAA, poly(N,N-dimethylacrylamide)—PDMAA and poly(N,N-diethylacrylamide)—PDEAA with poly(ethylene glycol)— PEG were prepared by casting in methanol and water at concentrations of 20 wt%, 40 wt%, 60 wt%, and 80 wt% in PEG. The miscibility of the components was studied by Differential Scanning Calorimetry—DSC. All blend systems are characterized by a single glass transition temperature (Tg), close to the Tg of the amorphous component. The Hoff- man Weeks method was used to determine equilibrium melting temperature (Tm) data. The determination of the melt point depression of the blends allowed the calculation of Flory-Huggins interaction parameter (χ12) of the two polymers in the melt, by using the Nishi Wang equation. The interaction parameters, calculated for all the blends, are slightly ne- gative and close to zero, suggesting a partial miscibility between the components. Keywords: Polyacrylamides; Poly(Ethylene Glycol); Polymer Blends; Flory-Huggins Interaction Parameter; Differential Scanning Calorimetry 1. Introduction Most of the proposed applications of polyacrylamides rely primarily on their behavior in aqueous solution [1-4]. On the other hand, this polymer and some of its N-alkyl substituted derivatives show great potential in the prepa- ration of miscible polymer blends due to their ability to interact through hydrogen bonding. Polyacrylamide— PAM, and some of its N-alkyl substituted derivatives, such as poly(N-isopropylacrylamide)—PNIPAAm, poly(N-tert-butylacrylamide)—PTBAA, poly(N,N-dime- thylacrylamide)—PDMAA, and poly(N,N-diethylacryla- mide)—PDEAA, are amorphous and water-soluble poly- mers with great industrial and agricultural interest [5-7]. In previous work, Silva et al. [8] showed that their ther- mal behavior is strongly dependent on the alkyl bonded to the amide group. Polyacrylamides form gels, or poly- mer networks that are able to expand in compatible sol- vent, like water, exhibiting a great potential for concen- tration of macromolecules from solutions, water purifica- tion, enzyme immobilization, drug delivery, sensors and for several biomedical uses [1,9-13]. Poly(ethyleneglycol), PEG, is a semi-crystalline poly- mer that shows applications as chromatographic support and polymeric electrolyte [14-18]. In the last ten years, interest has been attracted to systems in which at least one of the components is crystallizable. In this case, a melt point depression of the crystalline phase relative to its melting point (Tm) in a non-interacting medium pro- vides additional evidence of miscibility, since the kinet- ics and morphological effects over Tm are eliminated [19]. Measurement of the melting temperature (Tm) depression for blends allowed the determination of the Flory-Hug- gins interaction parameter (χ12) of polymers in the melt state, by using the Nishi-Wang equation [20,21]. The Hoffman-Weeks method is used to determine the equi- librium data [22]. There have been many studies on miscible blends con- taining poly(ethylene glycol) and poly(ethylene oxide). For example, blends of PEO/poly(epichlorohydrin) and PEO/poly(epichlorohydrin-co-ethylene oxide) were stud- ied by Silva et al. [19]. For these systems, the polymer- polymer interaction parameters are all negatives and ex- *Corresponding author. C opyright © 2013 SciRes. JMP  M. E. S. R. SILVA ET AL. 46 hibit dependence on the blend composition, decreasing for blends rich in PEO, suggesting that the polymer pairs are thermodynamically miscible. Cortazar et al. [23] and Cimmino et al. [24] studied blends of PEO/poly(methyl methacrylate) with several molecular weights, finding χ12 values in the range of −0.131 to −0.290. Blends of PEO (MW = 2.0 × 10³) and poly(p-hydroxibenzoic acid)—PHB, (MW = 2.79 × 10³) are miscible and exhibit χ12 values of −0.21 to −2.00, depending on the concentration of the crystalline com- ponent [25]. The miscibility of PVC/PEO blends was studied using viscosimetry, thermal analysis and microscopy by Neiro et al. [26]. χ12 values obtained from the melting point depression are dependent on the molar mass of PVC, varying from −0.102 to −0.028, indicating that the pair is miscible in the melt. In this paper, we report the study on the miscibility of blends of PAM, PNIPAAm, PTBAA, PDEAA e PDMAA with PEG, using differential scanning calorimetry (DSC). The Flory-Huggins interaction parameters (χ12) were de- termined by the melting point depression method. 2. Experimental 2.1. Materials PAM, PNIPAAm, PTBAA, PDMAA and PDEAA were synthesized via free radical mechanism, under nitrogren atmosphere, according to the method described by Frei- tas and Cussler [1]. Monomers (Aldrich and Polyscience) and the initiators, ammonium persulfate, sodium metabisulfite (Reagen), and 2,2’-azobisisobutyronitrile (Polyscience), analytical grade, were used as received. PEG (Aldrich), 2000 g·mol−1, was used as received, without additional purification. The weight-average molecular weight (MW) of amor- phous homopolymers was determined by light scattering using a Brookhaven Instruments equipment. 2.2. Blends Preparation Binary blends of varying compositions were prepared by casting from water and methanol solutions. To ensure complete removal of the solvent, the blends were kept under vacuum at 41˚C for ten days. 2.3. Blends Characterization and Determination of Crystallization Temperatures by DSC The DSC curves for homopolymers and blends were ob- tained on a DSC-50 Shimadzu module. Samples weights were maintained in the range of 10 mg. All experiments were performed under helium flow of 70 mL·min−1. The samples were heated from ambient to 210˚C at a rate of 20˚C·min−1, held at this temperature for 10 min to elimi- nate thermal history. After cooling the samples to −20˚C at a rate of 20˚C·min−1, they were heated again to 210˚C at 10˚C·min−1. The glass transition temperature and the melting en- thalpies (Hm) values were taken from the second heat- ing scan. The cooling scan was used to select the crystal- lization temperatures. 2.4. Isothermal Crystallization Isothermal crystallization was performed on a DSC-50 Shimadzu module based on the Hoffman-Weeks method [22]. Samples weights of 10 mg were heated from 25˚C to 200˚C at a rate of 20˚C·min−1, held at this temperature for 5 min, rapidly cooled (cooling rate~ 40˚C·min−1) to the desired crystallization temperature (Tc), maintained at this temperature for 2 min, and then cooled to 10˚C at a rate of 20˚C·min−1. After that, the samples were heated to 200˚C, at a rate of 20˚C·min−1, for the measurement of the Tm. This procedure was repeated for different crystal- lization temperatures. 2.5. Scanning Electron Microscopy (SEM) SEM micrographs of the blends were obtained using a JEOL JSM-5410 microscope and the samples were frac- tured in nitrogen and covered by sputtering with a Au/Pd alloy. 2.6. Density Measurements Density measurements of each homopolymer were car- ried out using a picnometer in a non-solvent (heptane and cyclohexane). 3. Results and Discussion The weight-average molecular weight of PAM and its N-alkyl substituted derivatives are, as seen in Table 1, at the same order of magnitude. Density values of PAM and its N-alkyl substituted de- rivatives are showed in Table 2. It’s shown in Figure 1 DSC curves of blends with 20 Table 1. Weight-average molecular weight of PAM and its N-alkyl substituted derivatives Homopolymer PAMPNIPA Am PTBAA PDMAAPDEAA MW × 10−5/g·mol−12.531.20 2.07 2.74 1.15 Table 2. Density values of homopolymers. Polymer PAMPNIPAAmPTBAA PDMAA PDEAAPEG Density/ g·mL−1 1.050.97 0.89 0.89 0.89 1.31 Copyright © 2013 SciRes. JMP 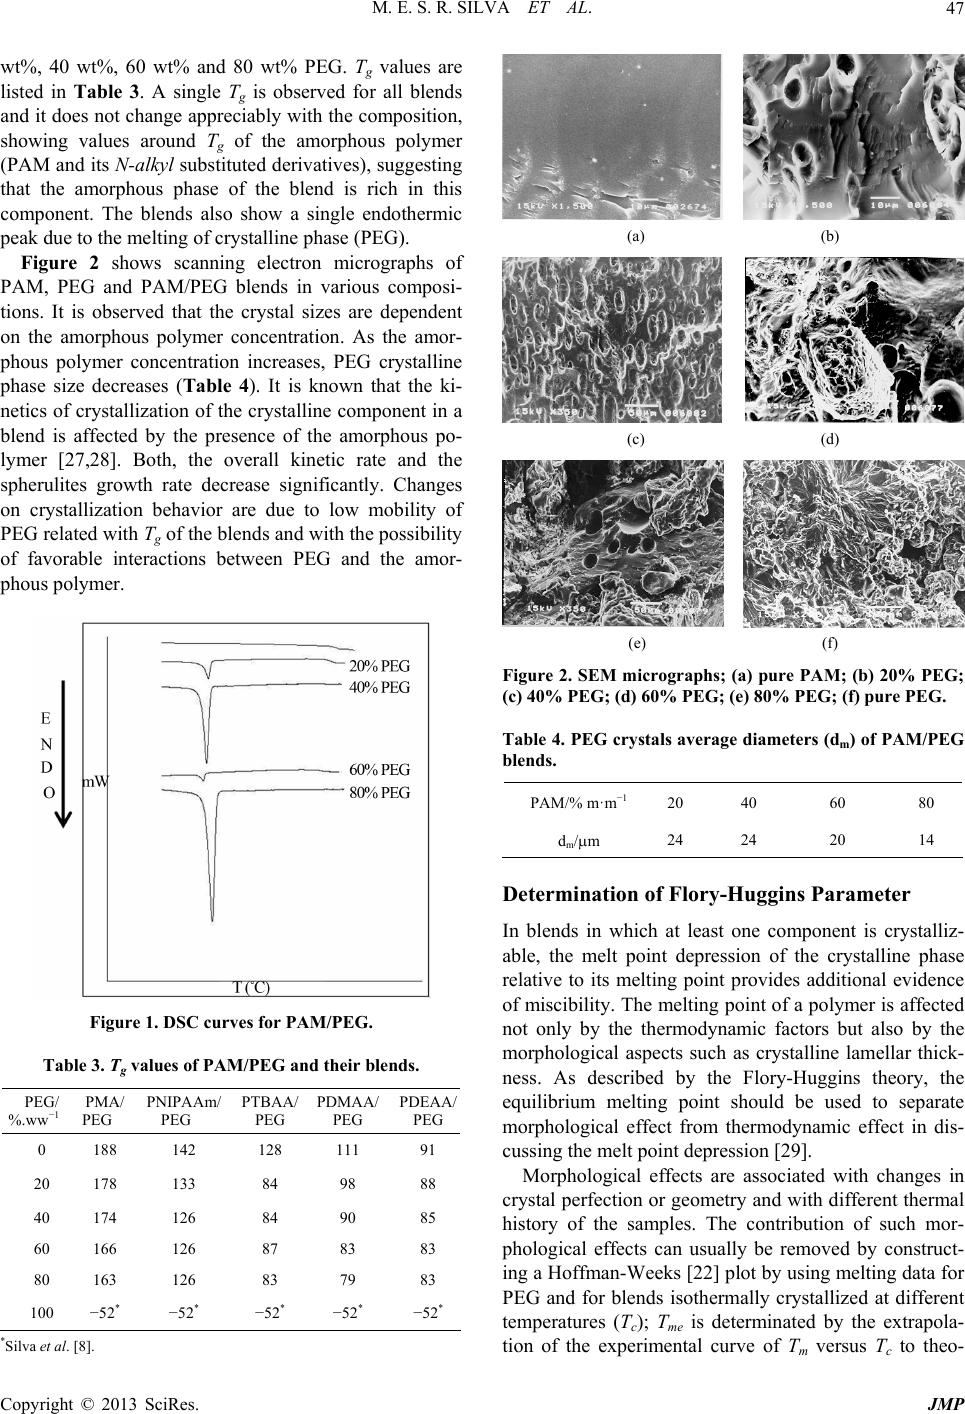 M. E. S. R. SILVA ET AL. 47 wt%, 40 wt%, 60 wt% and 80 wt% PEG. Tg values are listed in Table 3. A single Tg is observed for all blends and it does not change appreciably with the composition, showing values around Tg of the amorphous polymer (PAM and its N-alkyl substituted derivatives), suggesting that the amorphous phase of the blend is rich in this component. The blends also show a single endothermic peak due to the melting of crystalline phase (PEG). Figure 2 shows scanning electron micrographs of PAM, PEG and PAM/PEG blends in various composi- tions. It is observed that the crystal sizes are dependent on the amorphous polymer concentration. As the amor- phous polymer concentration increases, PEG crystalline phase size decreases (Table 4). It is known that the ki- netics of crystallization of the crystalline component in a blend is affected by the presence of the amorphous po- lymer [27,28]. Both, the overall kinetic rate and the spherulites growth rate decrease significantly. Changes on crystallization behavior are due to low mobility of PEG related with Tg of the blends and with the possibility of favorable interactions between PEG and the amor- phous polymer. Figure 1. DSC curves for PAM/PEG. Table 3. Tg values of PAM/PEG and their blends. PEG/ %.ww−1 PMA/ PEG PNIPAAm/ PEG PTBAA/ PEG PDMAA/ PEG PDEAA/ PEG 0 188 142 128 111 91 20 178 133 84 98 88 40 174 126 84 90 85 60 166 126 87 83 83 80 163 126 83 79 83 100 −52* −52* −52* −52* −52* *Silva et al. [8]. (a) (b) (c) (d) (e) (f) Figure 2. SEM micrographs; (a) pure PAM; (b) 20% PEG; (c) 40% PEG; (d) 60% PEG; (e) 80% PEG; (f) pure PEG. Table 4. PEG crystals average diameters (dm) of PAM/PEG blends. PAM/% m·m−80 12040 60 dm/m 2424 20 14 Determination of Flory-Huggins Parameter In blends in which at least one component is crystalliz- able, thint depressio of the crystalline pase releltinoint pides adnal evce of mis. The mg pof a poer is affected not only by the thermodynamic factors but also by the hick- , the by the extrapola- tio e melt po ative to its m n rov h ideng pditio cibilityeltinoint lym morphological aspects such as crystalline lamellar t ness. As described by the Flory-Huggins theory equilibrium melting point should be used to separate morphological effect from thermodynamic effect in dis- cussing the melt point depression [29]. Morphological effects are associated with changes in crystal perfection or geometry and with different thermal history of the samples. The contribution of such mor- phological effects can usually be removed by construct- ing a Hoffman-Weeks [22] plot by using melting data for PEG and for blends isothermally crystallized at different temperatures (Tc); Tme is determinated n of the experimental curve of Tm versus Tc to theo- Copyright © 2013 SciRes. JMP 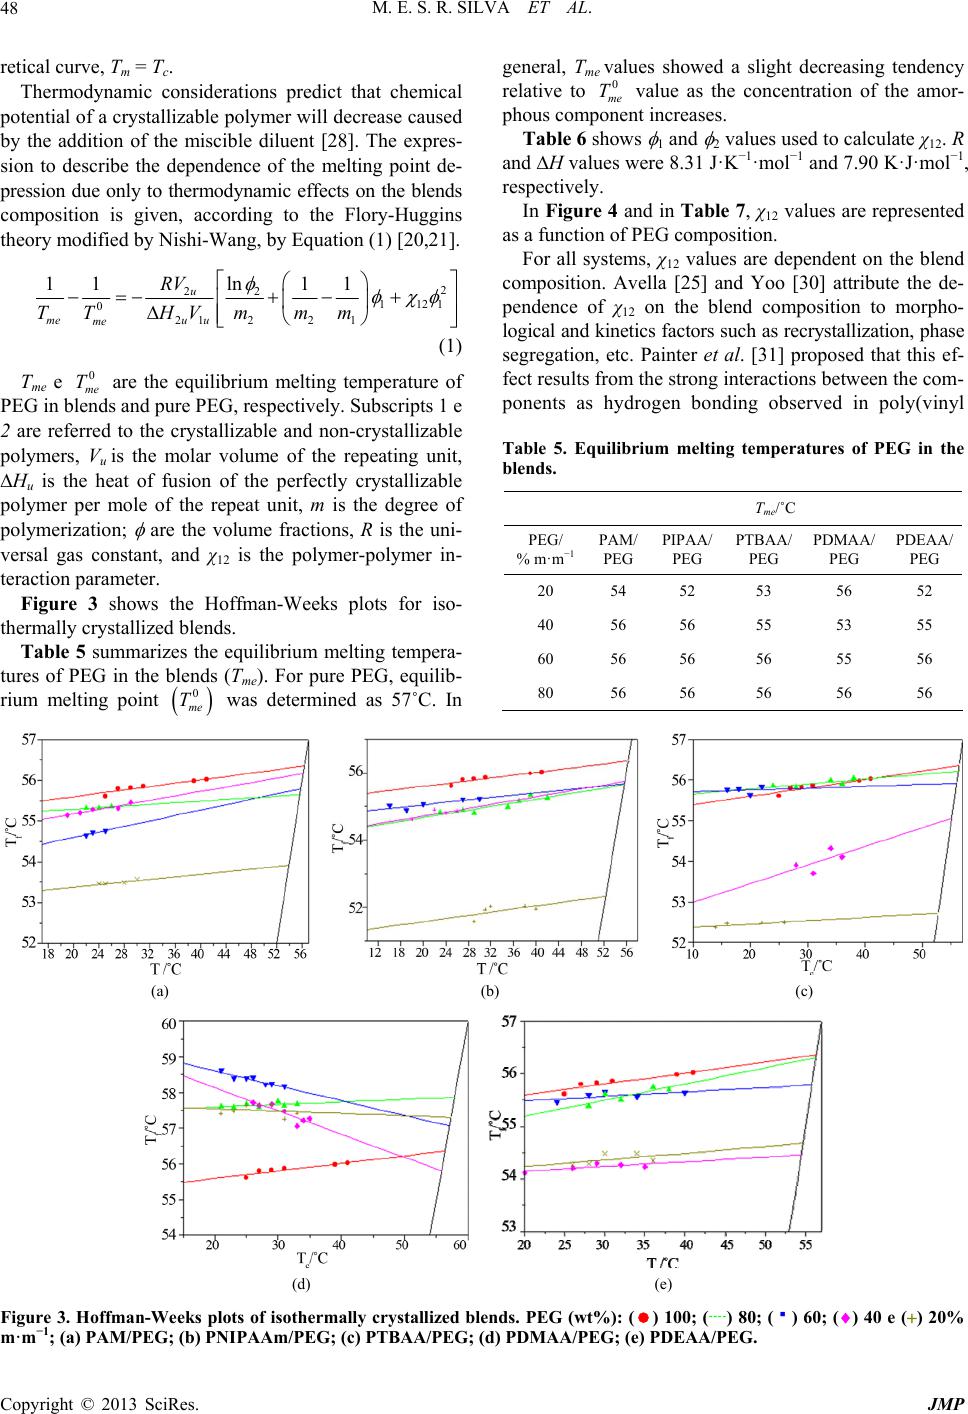 M. E. S. R. SILVA ET AL. Copyright © 2013 SciRes. JMP 48 -Wang, by Equation (1) [20,21]. retical curve, Tm = Tc. Thermodynamic considerations predict that chemical potential of a crystallizable polymer will decrease caused by the addition of the miscible diluent [28]. The expres- sion to describe the dependence of the melting point de- pression due only to thermodynamic effects on the blends composition is given, according to the Flory-Huggins theory modified by Nishi 2 22 1121 0 2122 1 ln 11 11 m u uu m ee RV THVmmm T (1) Tme e 0 me T are the equilibrium melting temperature of PEG in blends and pure PEG, respectively. Subscripts 1 e 2 are referred to the crystallizable and non-crystallizable polymers, Vu is the molar volume of the repeating unit Hu is the heat of fusion of the perfectly crystallizable polymer per mole of the repeat unit, m is the degree polymerization; are the volume fractions, R is the u ves c 0 T general, Tme values showed a slight decreasing tendency relative to me value as the concentration of the amor- phous component increases. Table 6 shows 1 and 2 values used to calculate χ12. R and H values were 8.31 J·K−1·mol−1 and 7.90 K·J·mol−1, respectively. In Figure 4 and in Table 7, χ12 values are represented as a function of PEG composition. For all systems, χ12 values are dependent on the blend composition. Avella [25] and Yoo [30] attribute the de- pendence of χ12 on the blend composition to morpho- logical and kinetics factors such as recrystallization, phase segregation, etc. Painter et al. [31] proposed that this ef- fect results from the strong interactions between the com- ponents as hydrogen bonding observed in poly(vinyl Table 5. Equilibrium melting temperatures of PEG in the blends. , of ni- Tme/˚C PEG/ % m·m−1 PAM/ PEG PIPAA/ PEG PTBAA/ PEG PDMAA/ PEG PDEAA/ PEG 20 54 52 53 56 52 40 56 56 55 53 55 60 56 56 56 55 56 80 56 56 56 56 56 rsal gaonstant, and χ12 is the polymer-polymer in- teraction parameter. Figure 3 shows the Hoffman-Weeks plots for iso- thermally crystallized blends. Table 5 summarizes the equilibrium melting tempera- tures of PEG in the blends (Tme). For pure PEG, equilib- rium melting point 0 me T was determined as 57˚C. In (a) (b) (c) (d) (e) Figure 3. Hoffman-Weeks plots of isothermally crystallized blends. PEG (wt%): () 100; () 80; () 60; () 40 e () 20% m·m−1; (a) PAM/PEG; (b) PNIPAAm/PEG; (c) PTBAA/PEG; (d) PDMAA/PEG; (e) PDEAA/PEG.  M. E. S. R. SILVA ET AL. 49 Table 6. 1 and 2 values. PAM/PEG PIPAA/PEG PTBAA/PEG PDMAA/PEG PDEAA/PEG PEG/% m·m−1 1 2 1 2 1 2 1 2 1 2 20 0.84 0.16 0.85 0.15 0.85 0.15 0.85 0.15 0.86 0.14 40 0.66 0.34 0.67 0.33 0.69 0.31 0.69 0.31 0.70 0.30 60 0.47 0.53 0.48 0.53 0.49 0.51 0.49 0.51 0.51 0.49 80 0.25 0.75 0.25 0.75 0.27 0.73 0.27 0.73 0.28 0.72 12 versus bleomposition: ()) NIPAAm/PEG, () PTBAA/PEG, () PDMAA/PEG e () PDEAA/PEG. Table 7. χ12 values as a function of PEG concentration. χ12 Figure 4. χnds c PAM/PEG, ( P PEG/ % m·m−1 PAM/ PEG PIPAA/ PEG PTBAA/ PEG PDMAA/ PEG PDEAA/ PEG 20 −0.032 −0.15 −0.15 7.2 × 10⁻⁴−0.18 40 0.012 −0.015 −0.081 −0.16 −0.13 60 −0.024 −0.072 −0.043 −0.11 −0.070 80 −0.20 −0.33 −0.074 0.060 2.0 × 13 0− phenol) and poli(ethylene-co-acrylic acid) blends. Lee et al. [32] studying, by DSC, blends of polystyrene and po- b 0. e molamass of the homopolym Linares and Acosta [33ied /Pdl fo alues in the o3 and of −0.153 to 2.201−3ectivdi, according to thors, that these syste mis Bs ofinhoNywe- ied by Koulouri and Kallitsis [34], through dynamic-me- chanl analMC Na- on to determine Flory-Huggins parameters. The results for blends can be found in Zhang blends of poly(butylene (PBSU) and poly(vinyl phenol) (PVPh) by Qiu et al. [36]. The existence of single composition de- p transitre and tva- lu of χ12 lculated using tshi-Wang equon, cate thBSU/h blends are thenamly le inmelt. éfice . [29rmine degf interaction een tmpof acarb-polyne blend through the Flory-Huggins interaction parameter. resuled tlend highnteno- lycarbonate tend to present χ closer to the critical val- nents was observed in all blends. Melting po e bl ly utadiene, found χ12 values in the range of 0.0040 to 0102, depending on the blend composition and on th r ers. ] stud und χ12 v PVDAVA an g PVDF/P 16 MMA b 4 02 ends and 5− e ranf −0. to 2. × 10 × 10, respely, in ms are partially cating he aut cible. lend poly(vyl alcol) and lon 6 re stud icaysis (DA), DS and theishi-Wng equa ti showed a single Tg and the χ12 value was –0.05, suggest- ing miscibility. Others χ12 values and their analysis as 12 ues, suggesting greater compatibility in these composi- tions. High molecular weight samples of the novel biode- gradable polyester poly(ethylene sebacate) (PESeb) with poly(4-vinyl phenol) (PVPh) blends were studied, with respect to miscibility, by Papageorgiou et al. [37]. A sin- gle glass transition temperature intermediate to those of pure compo criterion of miscibility et al. [28], Marcos et al. [35], and Cimmino et al. [24]. Miscibility was investigated in succinate) endent glassion temperatuhe negative es , cahe Niati indi miscib at P the PVPrmody ical Or et al] deteed three o betwhe conents o polyonatestyre The ts showhat bs wither cot of p int depression was observed with increasing content of the amorphous polymer. The equilibrium melting points were estimated using Hoffmann-Weeks extrapolation. The interaction parameter was calculated and it was found to be χ12 = −1.3. Blends miscibility was attributed to the formation of hydrogen bonds between the hydroxyl groups of PVPh and carbonyl groups of PESeb. In the present work, χ12 values are dependent on th end composition and are near zero or slightly negatives (Table 7), suggesting partial miscibility between PEG and the amorphous polymers in the melting, maybe as a result of interactions through hydrogen bonds. Addition- ally, Tg behavior and SEM micrographs corroborate this result. 4. Conclusion Binary blends of polyacrylamide and some of its N-alkyl substituted derivatives with PEG, obtained by co-disso- lution method, are partially miscible, as demonstrated by the smooth lowering of Tg values relative to the Tg value of the pure amorphous component. The polymer-polymer Copyright © 2013 SciRes. JMP  M. E. S. R. SILVA ET AL. 50 interaction parameters obtained from thermodynamic in melt- g temperature depression analysis are slightly negative and close to zero, suggesting partial miscibility among the components. Furthermore, for all blends studied, there is an endothermic peak corresponding to the melting of the PEG crystalline phase. For all blends studied, SEM micrographs indicate the presence of PEG crystalline phase. 5. Acknowledgements The authors thank the Brazilian Agencies CNPq, CAPES and FAPEMIG for financial support. REFERENCES [1] R. F. S. Freitas and E. L. Cussler, Chemical Engineering Science, Vol. 42, 1987, pp. 97-103. doi:10.1016/0009-2509(87)80213-0 [2] R. G. Sousa, R. F. S. Freitas and W. F. Magalhães, Poly- mer, Vol. 39, 1998, pp. 3815-3819. doi:10.1016/S0032-3861(97)10341-X and D. W. Wang, “Encyclopedia of Poly- ngineering,” John Wiley & Sons, New [3] W. M. Thomas mer Science E York, 1988. [4] F. Zeng, X. Zheng and Z. Tong, Polymer, Vol. 39, 1998, pp. 1249-1251. doi:10.1016/S0032-3861(97)00471-0 [5] J. Klein and R. Heitzmann, Die Makromolekulare Chemie, Vol. 179, 1978, pp. 1895-1904. doi:10.1002/macp.1978.021790803 [6] E. A. Smith and F. W. Oehme, Journal of Chromatogra- phic. Science, Vol. 31, 1993, pp. 192-195. doi:10.1093/chromsci/31.5.192 [7] S. C. S. Teixeira, Proceedings of the 3rd Congresso Bra- sileiro de Polímeros, Rio de Janeiro, 30 October-2 No- vember 1995, p. 925. [8] M. E. S. R. Silva, E. R. Dutra, V. Mano and J. C. Macha- do, Polymer Degradation and Stability, Vol. 67, 2000, pp 1-3910(99)00149-4 . 491-495. doi:10.1016/S014 Drug Delivery Reviews[9] A. S. Hoffman, Advanced , Vol. 54, 2002, pp. 3-12. doi:10.1016/S0169-409X(01)00239-3 [10] T. R. Hoare and D. S. Kohane, Polymer, Vol. 49, 2008, pp. 1993-2007. doi:10.1016/j.polymer.2008.01.027 [11] M. R. Jin, C. F J. Hou, Journal of Applied Polym5, pp. 285-288. . Wu, P. Y. Lin and W. er Science, Vol. 56, 199 doi:10.1002/app.1995.070560220 [12] H. Kanazawa, Y. Kashiwase, K. Yam ma, A. Kikuchi, Y. Sakurai and T. Ok amoto, Y. Matsushi- ano, Analytical Che- mistry, Vol. 69, 1997, pp. 823-830. doi:10.1021/ac961024k [13] G. C. Tavares, M. E. S. R. Silva, R. G. Sousa and R. F. S. Freitas, Macromolecular Symposia, Vol. 319, 2012, pp. 10-14. doi:10.1002/masy.201200009 [14] M. A. Silva, “Blendas de poli(óxido de etileno) com poli- olo- Tada and M. I. Felis- p. 438-436. (epicloridrina) e com poli(epicloridrina-co-óxido de etile- no): Comportamento de fases, miscibilidade e morf gia,” M.Sc. Dissertation, UNICAMP, Campinas, 1995. [15] A. C. Quental, F. P. Carvalho, E. S. berti, Química Nova, Vol. 33, 2012, p doi:10.1590/S0100-40422010000200035 [16] D. S. Rosa, C. G. F. Guedes, C. M. Oliveira lisberti, Journal of Polymers an and M. I. Fe- d the Environment, Vol. 16, 2008, pp. 230-240. doi:10.1007/s10924-008-0114-7 [17] D. F. Parra, J. Fusaro, F. Gaboardi and D. S. Rosa, Poly- mer Degradation and Stability, Vol. 91, 2006, pp. 1954- 1959. doi:10.1016/j.polymdegradstab.2006.02.008 [18] H. J. Chiu, Polymer, Vol. 46, 2005, pp. 3906-3913. doi:10.1016/j.polymer.2005.03.032 [19] M. A. Silva, M. A. De Paoli and M. I. Felisberti, Polymer, Vol. 39, 1998, pp. 2551-2556. doi:10.1016/S0032-3861(97)00574-0 [20] T. Nish, T. T. Wang and T. K. Kwei, Macromolecules, ll Vol. 8, 1975, pp. 227-234. [21] P. J. Flory, “Principles of Polymer Chemistry,” Corne University Press, Ithaca, 1953. [22] J. D. Hoffman and J. J. Weeks, Journal of Chemical Phy- sics, Vol. 37, 1962, pp. 1723-1741. doi:10.1063/1.1733363 M. M. Cortazar, M. E. C[23] alahorra and G. M. Guzman, Eu- ropean Polymer Journal, Vol. 18, 1982, pp.165-166. doi:10.1016/0014-3057(82)90196-3 [24] S. Cimmino, E. Di Pace, E. Martusce Die M lli and C. Silvestre, akromolekulare Chemie, Vol. 191, 1990, pp. 2447- 2454. doi:10.1002/macp.1990.021911022 [25] M. Avella and E. Martuscelli, Polymer, Vol. 29, 1988, pp. 1731-1737. doi:10.1016/0032-3861(88)90384-9 [26] S. M. S. Neiro, D. C. Dragunsky, A. F. Rubira and E. C. Muniz, European Polymer Journal, Vol. 36, 2000, pp 583-589. . 82-8doi:10.1016/S0014-3057(99)000 [27] G. Dreezen, Z. Fang and G. Groeninckz, Polymer, Vol. 40, 1999, pp. 5907-5917. doi:10.1016/S0032-3861(98)00809-X [28] L. L. Zang, S. H. Goh, S. Y. Lee and G. R. Hee, Polymer, Vol. 41, 2000, pp. 1429-1439. doi:10.1016/S0032-3861(99)00320-1 [29] R. L. Oréfice, W. L. Vasconcelos and M. A. S. Moraes, límeros: Ciência e Tecnologia, Vol Po- . 14, 2004, pp. 129- 133. doi:10.1590/S0104-14282004000200017 [30] H. Y. Yoo, S. Umemoto, T. Kikutani mer, Vol. 35, 1994, pp. 117-122. and N. Okui, Poly- doi:10.1016/0032-3861(94)90058-2 P. C. Painter, S. L. Shenoy, [31] D. E. Bhagwagar, J. Fishburn and M. M. Coleman, Macromolecules, Vol. 24, 1991, pp. 5623-5629. doi:10.1021/ma00020a022 . 1301-1308. 4628(19970516)64:7<1301::AID [32] H. S. Lee, W. N. Kim and C. M. Burns, Journal of Appli- ed Polymer Science, Vol. 64, 1997, pp doi:10.1002/(SICI)1097- -APP9>3.0.CO;2-N [33] A. Linares and J. L. Acosta, Journal of Applied Polym Science, Vol. 67, 1998, pp. 997-1004 er . doi:10.1002/(SICI)1097-4628(19980207)67:6<997::AID- APP5>3.0.CO;2-H Copyright © 2013 SciRes. JMP  M. E. S. R. SILVA ET AL. Copyright © 2013 SciRes. JMP 51 , Vol. 39, 1998[34] E. G. Koulouri and J. K. Kallitsis, Polymer , pp. 2373-2379. doi:10.1016/S0032-3861(97)00542-9 [35] J. I. Marcos, E. Orlandi and G. Zerbi, Polymer, Vol. 31, 1990, pp. 1899-1903. doi:10.1016/0032-3861(90)90014-P [36] Z. Qiu, K. Motonori, I. Takayuki and N. Toshio, Polymer, Vol. 44, 2003, pp. 8111-8117. doi:10.1016/j.polymer.2003.10.030 [37] G. Z. Papageorgiou, D. N. Bikiaris and C. G. Panayiotou Polymer, Vol. 52, 2011, pp. 4553-4561. , r.2011.07.050doi:10.1016/j.polyme |