

Paper Menu >>
Journal Menu >>
 Vol.2, No.3, 51-56 (2013) Modern Chemotherapy http://dx.doi.org/10.4236/mc.2013.23006 CIMAvax®EGF vaccine therapy for non-small cell lung cancer: A weighted log-rank tests-based evaluation Carmen Viada Gonzalez1*, Jean-François Dupuy2, Martha Fors López3, Patricia Lorenzo Luaces1, Gisela González Marinello1, Elia Neninger Vinagera4, Beatriz García Verdecia1, Tania Crombet-Ramos1 1Clinical Trials Department, Center of Molecular Immunology, Havana, Cuba; *Corresponding Author: [email protected] 2National Institute of Applied Sciences of Rennes, Rennes, France 3National Coordinator Center of Clinical Trial, Havana, Cuba 4Hermanos Ameijeiras Hospital, Havana, Cuba Received 2 January 2013; revised 12 February 2013; accepted 1 March 2013 Copyright © 2013 Carmen Viada Gonzalez et al. This is an open access article distributed under the Creative Commons Attribution License, which permits unrestricted use, distribution, and reproduction in any medium, provided the original work is properly cited. ABSTRACT Time-to-event has become one of the primary endpoints of many clinical trials. Comparing treatments and therapies using time-to-event (or “survival”) data requires some care, since survi- val differences may occur either early or late in the follow-up period, depending on various fac- tors such as the initial po tency or the duration of efficacy of the drugs. In this work, we investi- gate the effect of the CIMAvax®EGF vaccine the- rapy on the survival of patients with non-small cell lung cancer, using stratified and unstratified weighted log-rank tests. Weighted log-rank tests are designed to identify early and late survival differences between treatments. Using these tests, we conclude that the vaccine is more efficient than the standard therapy among patients less than 60 years of age. Keywords: Log-Rank Test; Fleming-Harrington Test; Stratified Tests 1. INTRODUCTION The Center of Molecular Immunology (CIM) is one of the centers of the Scientific Pole in Cuba devoted to the research, development, and manufacturing of human biotechnological products. The CIMAVax®EGF vaccine, developed at CIM. Investigating the effect of the CI- MAVax ®EGF vaccine on patients with NSCLC can be based on comparing the survival functions under CI- MAVax ®EGF and a control therapy. The log-rank test is the classical tool that comes to mind for such an analysis. However, this test is not appropriate for detecting a de- layed separation of the survival curves that may occur due to some late effect of one of the treatments. Previous studies suggest that such an effect exist for the CIMA Vax®EGF vaccine. Moreover, the log-rank test is useful when each treatment group is homogeneous, in the sense that the survival distribution is the same for every patient in the group. Again, previous studies suggest that an evaluation of CIMAVax®EGF efficacy should be strati- fied over age, since homogeneity only holds within the two subpopulations of patients under (respectively over) 60 years of age. Stratified weighted log-rank tests, such as the stratified Fleming-Harrington’s family of tests, can be used to deal simultaneously with the issues of late effects and stratification. In this work, we apply these tests to survival data arising from two clinical trials that were conducted to evaluate the CIMAVax®EGF vaccine in patients with NSCLC. The first study is a finished phase II trial that included 80 patients, the second is an on-going phase III trial including 356 patients. Both tri- als were randomized and controlled with two treatment arms, one arm receiving the CIMAVax®EGF vaccine and a standard therapy, the other (control group) receiving only the standard therapy. In both trials, the primary endpoint of interest was the overall survival, measured as the duration between inclusion in the trial and death of the patient. 2. PURPOSE The purpose of this work is to analyze survival data from patients with NSCLC with standard therapy com- Copyright © 2013 SciRes. OPEN A CCESS 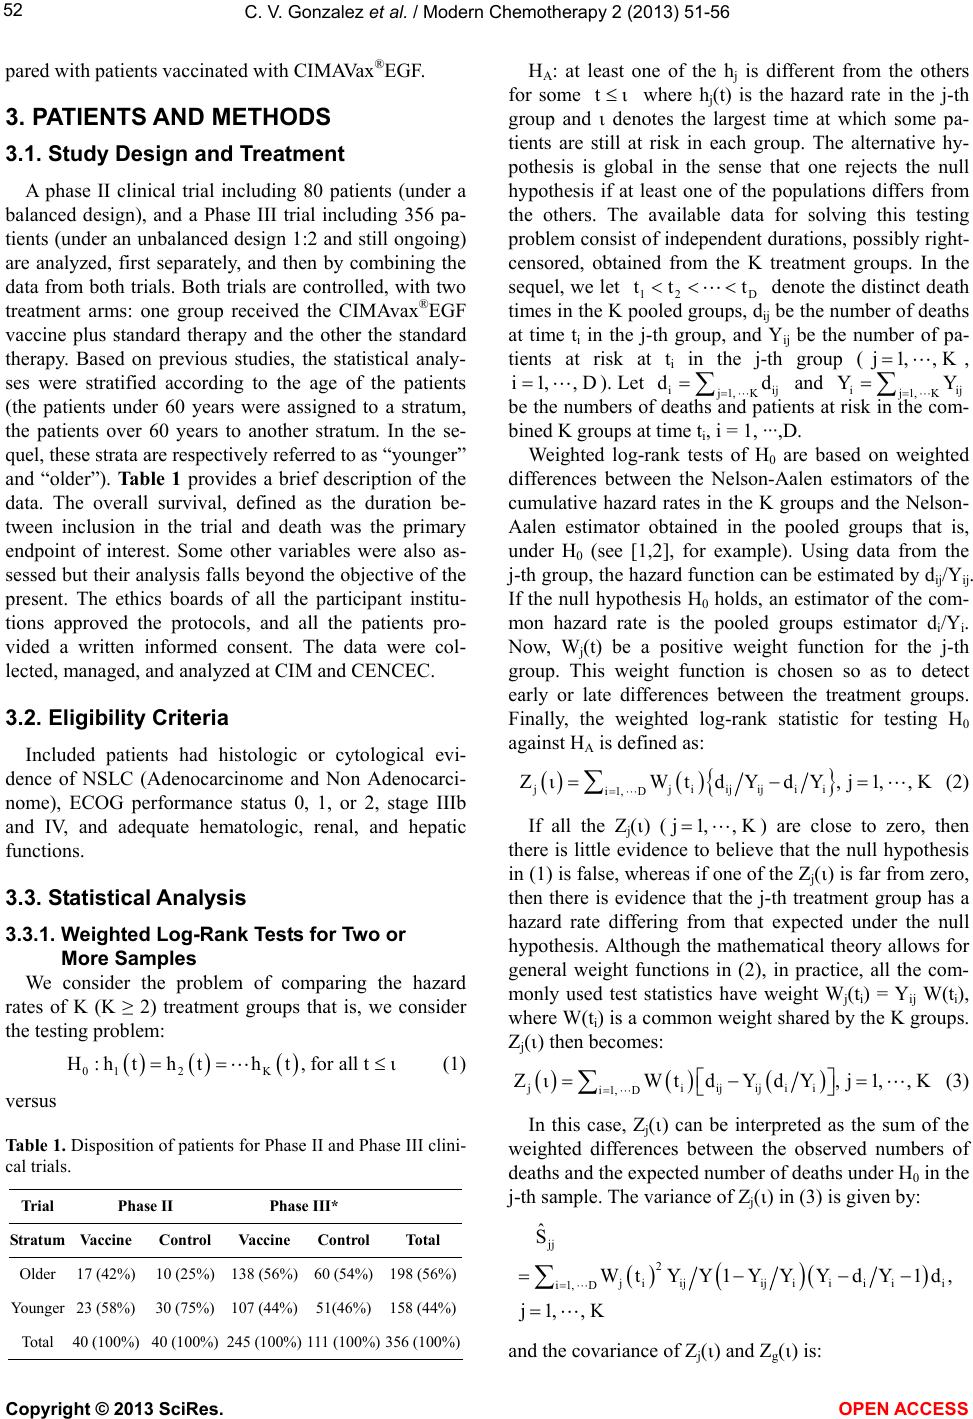 C. V. Gonzalez et al. / Modern Chemotherapy 2 (2013) 51-56 52 pared with patients vaccinated with CIMAVax®EGF. 3. PATIENTS AND METHODS 3.1. Study Design and Treatment A phase II clinical trial including 80 patients (under a balanced design), and a Phase III trial including 356 pa- tients (under an unbalanced design 1:2 and still ongoing) are analyzed, first separately, and then by combining the data from both trials. Both trials are controlled, with two treatment arms: one group received the CIMAvax®EGF vaccine plus standard therapy and the other the standard therapy. Based on previous studies, the statistical analy- ses were stratified according to the age of the patients (the patients under 60 years were assigned to a stratum, the patients over 60 years to another stratum. In the se- quel, these strata are respectively referred to as “younger” and “older”). Ta bl e 1 provides a brief description of the data. The overall survival, defined as the duration be- tween inclusion in the trial and death was the primary endpoint of interest. Some other variables were also as- sessed but their analysis falls beyond the objective of the present. The ethics boards of all the participant institu- tions approved the protocols, and all the patients pro- vided a written informed consent. The data were col- lected, managed, and analyzed at CIM and CENCEC. 3.2. Eligibility Criteria Included patients had histologic or cytological evi- dence of NSLC (Adenocarcinome and Non Adenocarci- nome), ECOG performance status 0, 1, or 2, stage IIIb and IV, and adequate hematologic, renal, and hepatic functions. 3.3. Statistical Analysis 3.3.1. Weighted Log-Rank Tests for Two or More Samples We consider the problem of comparing the hazard rates of K (K ≥ 2) treatment groups that is, we consider the testing problem: 01 2K H:h ththt,foralltι (1) versus Table 1. Disposition of patients for Phase II and Phase III clini- cal trials. Trial Phase II Phase III* Stratum Vaccine Control Vaccine Control Total Older 17 (42%) 10 (25%) 138 (56%) 60 (54%) 198 (56%) Younger 23 (58%) 30 (75%) 107 (44%) 51(46%) 158 (44%) Total 40 (100%) 40 (100%) 245 (100%) 111 (100%) 356 (100%) HA: at least one of the hj is different from the others for some tι where hj(t) is the hazard rate in the j-th group and denotes the largest time at which some pa- tients are still at risk in each group. The alternative hy- pothesis is global in the sense that one rejects the null hypothesis if at least one of the populations differs from the others. The available data for solving this testing problem consist of independent durations, possibly right- censored, obtained from the K treatment groups. In the sequel, we let 12 D tt t denote the distinct death times in the K pooled groups, dij be the number of deaths at time ti in the j-th group, and Yij be the number of pa- tients at risk at ti in the j-th group (j1, ,K , i1, ,D ). Let iij j1, K dd and iij j1, K YY be the numbers of deaths and patients at risk in the com- bined K groups at time ti, i = 1, ···,D. Weighted log-rank tests of H0 are based on weighted differences between the Nelson-Aalen estimators of the cumulative hazard rates in the K groups and the Nelson- Aalen estimator obtained in the pooled groups that is, under H0 (see [1,2], for example). Using data from the j-th group, the hazard function can be estimated by dij/Yij. If the null hypothesis H0 holds, an estimator of the com- mon hazard rate is the pooled groups estimator di/Yi. Now, Wj(t) be a positive weight function for the j-th group. This weight function is chosen so as to detect early or late differences between the treatment groups. Finally, the weighted log-rank statistic for testing H0 against HA is defined as: jjiijijii i1, D ZιWtd YdY,j1,,K (2) If all the Zj() (j1, ,K ) are close to zero, then there is little evidence to believe that the null hypothesis in (1) is false, whereas if one of the Zj() is far from zero, then there is evidence that the j-th treatment group has a hazard rate differing from that expected under the null hypothesis. Although the mathematical theory allows for general weight functions in (2), in practice, all the com- monly used test statistics have weight Wj(ti) = Yij W(ti), where W(ti) is a common weight shared by the K groups. Zj() then becomes: jiijij ii i1, D ZιWtdYd Y,j1,,K (3) In this case, Zj() can be interpreted as the sum of the weighted differences between the observed numbers of deaths and the expected number of deaths under H0 in the j-th sample. The variance of Zj() in (3) is given by: jj 2 j iijijiiiii i1, D ˆ S WtYY1YYYdY 1d, j1, ,K and the covariance of Zj() and Zg() is: Copyright © 2013 SciRes. OPEN A CCESS 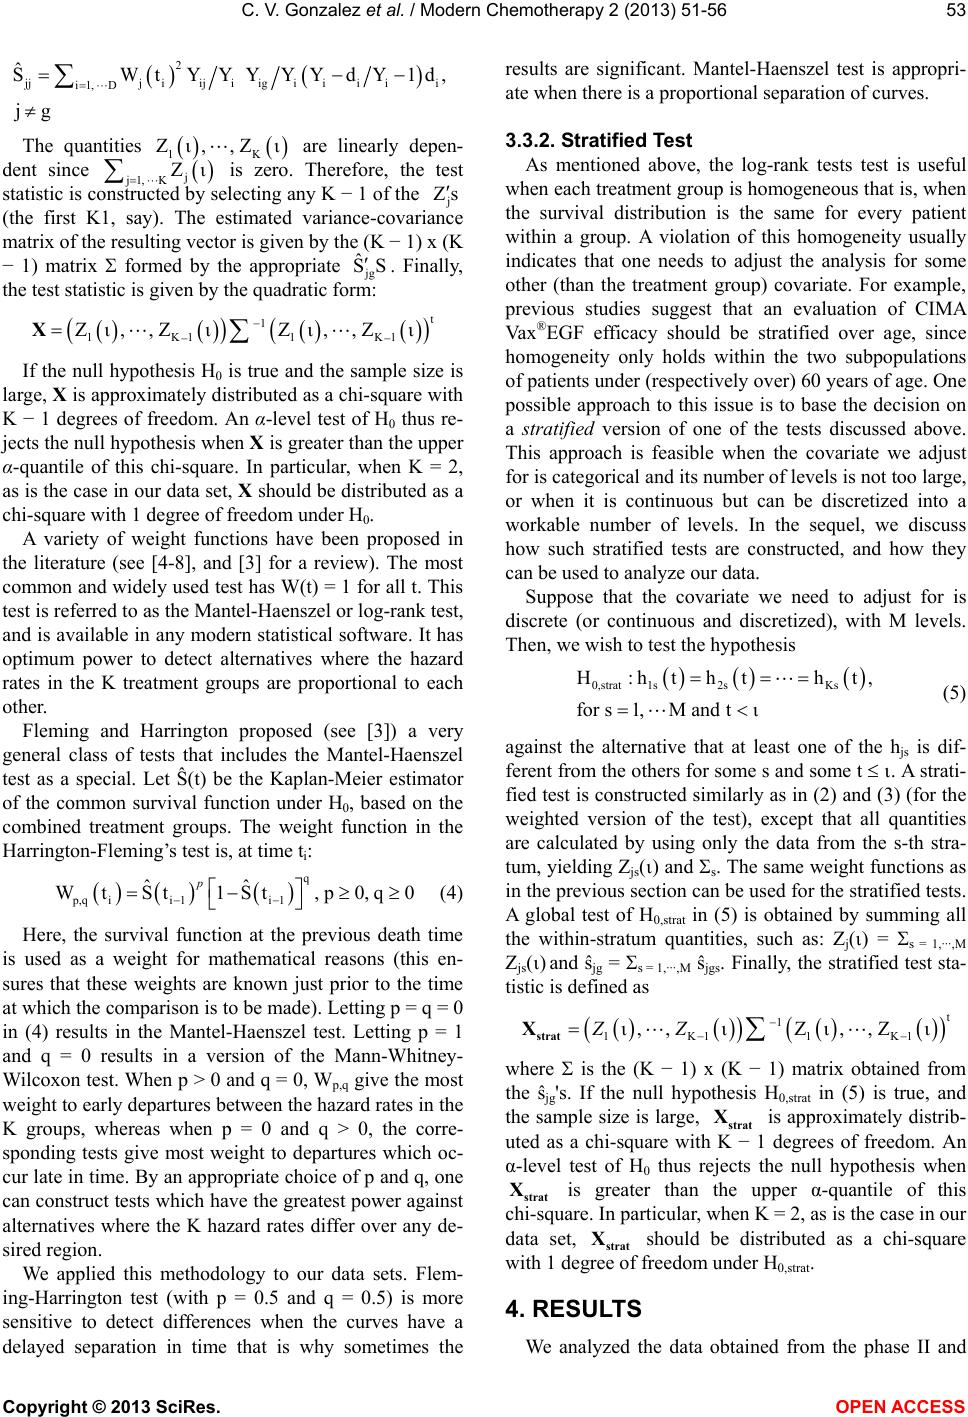 C. V. Gonzalez et al. / Modern Chemotherapy 2 (2013) 51-56 53 2 jjj iijiigiiiii i1, D ˆ SWtYYYYYdY1 jg d, The quantities are linearly depen- dent since j1 , K is zero. Therefore, the test statistic is constructed by selecting any K − 1 of the j 1K Zι,,Zι j Zι Zs (the first K1, say). The estimated variance-covariance matrix of the resulting vector is given by the (K − 1) x (K − 1) matrix formed by the appropriate jg . Finally, the test statistic is given by the quadratic form: ˆ SS t 1 1K1 1K1 Zι,,ZιZι,,Zι X If the null hypothesis H0 is true and the sample size is large, X is approximately distributed as a chi-square with K − 1 degrees of freedom. An α-level test of H0 thus re- jects the null hypothesis when X is greater than the upper α-quantile of this chi-square. In particular, when K = 2, as is the case in our data set, X should be distributed as a chi-square with 1 degree of freedom under H0. A variety of weight functions have been proposed in the literature (see [4-8], and [3] for a review). The most common and widely used test has W(t) = 1 for all t. This test is referred to as the Mantel-Haenszel or log-rank test, and is available in any modern statistical software. It has optimum power to detect alternatives where the hazard rates in the K treatment groups are proportional to each other. Fleming and Harrington proposed (see [3]) a very general class of tests that includes the Mantel-Haenszel test as a special. Let Ŝ(t) be the Kaplan-Meier estimator of the common survival function under H0, based on the combined treatment groups. The weight function in the Harrington-Fleming’s test is, at time ti: q p,qii 1i 1 ˆˆ Wt St1St,p0,q0 p (4) Here, the survival function at the previous death time is used as a weight for mathematical reasons (this en- sures that these weights are known just prior to the time at which the comparison is to be made). Letting p = q = 0 in (4) results in the Mantel-Haenszel test. Letting p = 1 and q = 0 results in a version of the Mann-Whitney- Wilcoxon test. When p > 0 and q = 0, Wp,q give the most weight to early departures between the hazard rates in the K groups, whereas when p = 0 and q > 0, the corre- sponding tests give most weight to departures which oc- cur late in time. By an appropriate choice of p and q, one can construct tests which have the greatest power against alternatives where the K hazard rates differ over any de- sired region. We applied this methodology to our data sets. Flem- ing-Harrington test (with p = 0.5 and q = 0.5) is more sensitive to detect differences when the curves have a delayed separation in time that is why sometimes the results are significant. Mantel-Haenszel test is appropri- ate when there is a proportional separation of curves. 3.3.2. Stratifi ed Test As mentioned above, the log-rank tests test is useful when each treatment group is homogeneous that is, when the survival distribution is the same for every patient within a group. A violation of this homogeneity usually indicates that one needs to adjust the analysis for some other (than the treatment group) covariate. For example, previous studies suggest that an evaluation of CIMA Vax®EGF efficacy should be stratified over age, since homogeneity only holds within the two subpopulations of patients under (respectively over) 60 years of age. One possible approach to this issue is to base the decision on a stratified version of one of the tests discussed above. This approach is feasible when the covariate we adjust for is categorical and its number of levels is not too large, or when it is continuous but can be discretized into a workable number of levels. In the sequel, we discuss how such stratified tests are constructed, and how they can be used to analyze our data. Suppose that the covariate we need to adjust for is discrete (or continuous and discretized), with M levels. Then, we wish to test the hypothesis 0,strat 1s2sKs H:htht ht, for s1,M andtι (5) against the alternative that at least one of the hjs is dif- ferent from the others for some s and some t . A strati- fied test is constructed similarly as in (2) and (3) (for the weighted version of the test), except that all quantities are calculated by using only the data from the s-th stra- tum, yielding Zjs() and s. The same weight functions as in the previous section can be used for the stratified tests. A global test of H0,strat in (5) is obtained by summing all the within-stratum quantities, such as: Zj() = s = 1,···,M Zjs() and ŝjg = s = 1,···,M ŝjgs. Finally, the stratified test sta- tistic is defined as t 1 1K1 1K1 ι,, ιZι,,ZιZZ strat X where is the (K − 1) x (K − 1) matrix obtained from the ŝjg's. If the null hypothesis H0,strat in (5) is true, and the sample size is large, strat is approximately distrib- uted as a chi-square with K − 1 degrees of freedom. An α-level test of H0 thus rejects the null hypothesis when strat is greater than the upper α-quantile of this chi-square. In particular, when K = 2, as is the case in our data set, strat should be distributed as a chi-square with 1 degree of freedom under H0,strat. X X X 4. RESULTS We analyzed the data obtained from the phase II and Copyright © 2013 SciRes. OPEN A CCESS 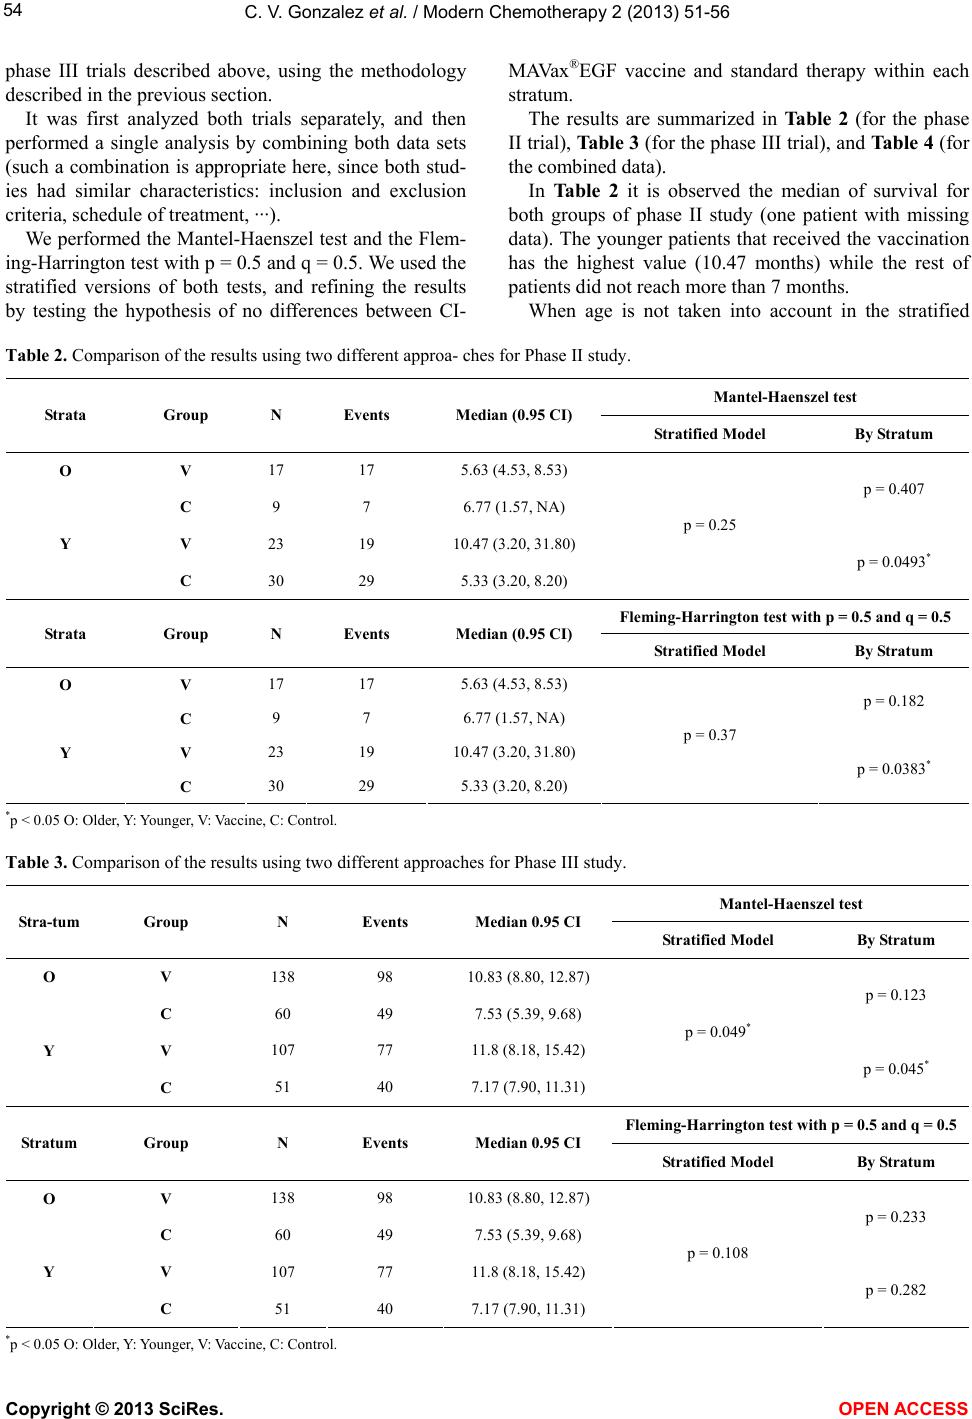 C. V. Gonzalez et al. / Modern Chemotherapy 2 (2013) 51-56 Copyright © 2013 SciRes. OPEN A CCESS 54 phase III trials described above, using the methodology described in the previous section. It was first analyzed both trials separately, and then performed a single analysis by combining both data sets (such a combination is appropriate here, since both stud- ies had similar characteristics: inclusion and exclusion criteria, schedule of treatment, ···). We performed the Mantel-Haenszel test and the Flem- ing-Harrington test with p = 0.5 and q = 0.5. We used the stratified versions of both tests, and refining the results by testing the hypothesis of no differences between CI- MAVax ®EGF vaccine and standard therapy within each stratum. The results are summarized in Ta bl e 2 (for the phase II trial), Tabl e 3 (for the phase III trial), and Tab le 4 (for the combined data). In Table 2 it is observed the median of survival for both groups of phase II study (one patient with missing data). The younger patients that received the vaccination has the highest value (10.47 months) while the rest of patients did not reach more than 7 months. When age is not taken into account in the stratified Table 2. Comparison of the results using two different approa- ches for Phase II study. Mantel-Haenszel test Strata Group N Events Median (0.95 CI) Stratified Model By Stratum O V 17 17 5.63 (4.53, 8.53) C 9 7 6.77 (1.57, NA) p = 0.407 Y V 23 19 10.47 (3.20, 31.80) C 30 29 5.33 (3.20, 8.20) p = 0.25 p = 0.0493* Fleming-Harrington test with p = 0.5 and q = 0.5 Strata Group N Events Median (0.95 CI) Stratified Model By Stratum O V 17 17 5.63 (4.53, 8.53) C 9 7 6.77 (1.57, NA) p = 0.182 Y V 23 19 10.47 (3.20, 31.80) C 30 29 5.33 (3.20, 8.20) p = 0.37 p = 0.0383* *p < 0.05 O: Older, Y: Younger, V: Vaccine, C: Control. Table 3. Comparison of the results using two different approaches for Phase III study. Mantel-Haenszel test Stra-tum Group N Events Median 0.95 CI Stratified Model By Stratum O V 138 98 10.83 (8.80, 12.87) C 60 49 7.53 (5.39, 9.68) p = 0.123 Y V 107 77 11.8 (8.18, 15.42) C 51 40 7.17 (7.90, 11.31) p = 0.049* p = 0.045* Fleming-Harrington test with p = 0.5 and q = 0.5 Stratum Group N Events Median 0.95 CI Stratified Model By Stratum O V 138 98 10.83 (8.80, 12.87) C 60 49 7.53 (5.39, 9.68) p = 0.233 Y V 107 77 11.8 (8.18, 15.42) C 51 40 7.17 (7.90, 11.31) p = 0.108 p = 0.282 *p < 0.05 O: Older, Y: Younger, V: Vaccine, C: Control. 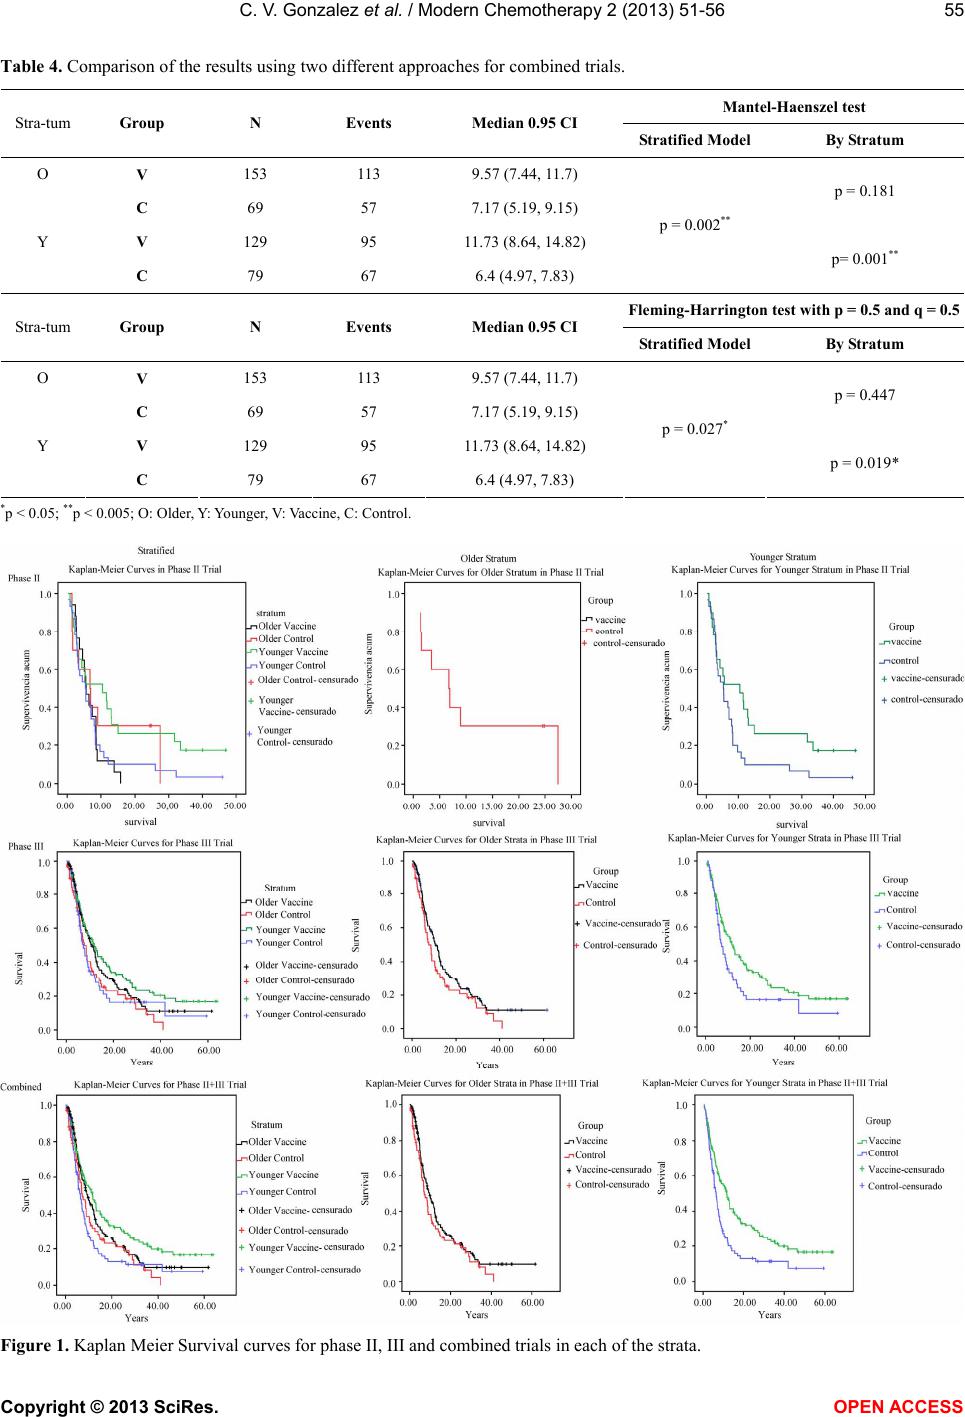 C. V. Gonzalez et al. / Modern Chemotherapy 2 (2013) 51-56 55 Table 4. Comparison of the results using two different approaches for combined trials. Mantel-Haenszel test Stra-tum Group N Events Median 0.95 CI Stratified Model By Stratum O V 153 113 9.57 (7.44, 11.7) C 69 57 7.17 (5.19, 9.15) p = 0.181 Y V 129 95 11.73 (8.64, 14.82) C 79 67 6.4 (4.97, 7.83) p = 0.002** p= 0.001** Fleming-Harrington test with p = 0.5 and q = 0.5 Stra-tum Group N Events Median 0.95 CI Stratified Model By Stratum O V 153 113 9.57 (7.44, 11.7) C 69 57 7.17 (5.19, 9.15) p = 0.447 Y V 129 95 11.73 (8.64, 14.82) C 79 67 6.4 (4.97, 7.83) p = 0.027* p = 0.019* *p < 0.05; **p < 0.005; O: Older, Y: Younger, V: Vaccine, C: Control. F igure 1. Kaplan Meier Survival curves for phase II, III and combined trials in each of the strata. Copyright © 2013 SciRes. OPEN A CCESS 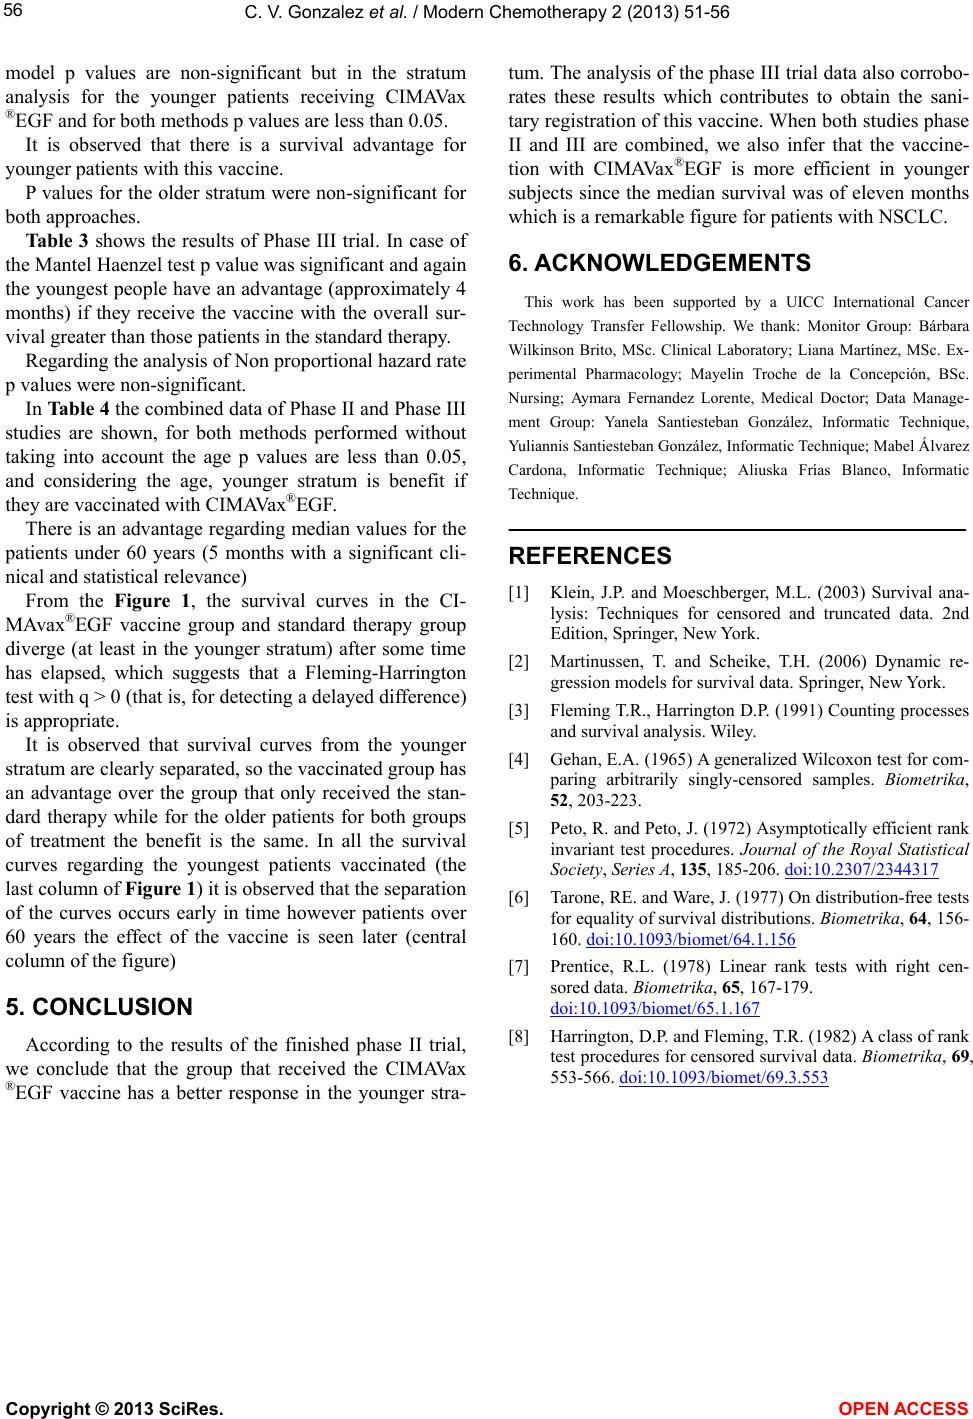 C. V. Gonzalez et al. / Modern Chemotherapy 2 (2013) 51-56 Copyright © 2013 SciRes. 56 model p values are non-significant but in the stratum analysis for the younger patients receiving CIMAVax ®EGF and for both methods p values are less than 0.05. It is observed that there is a survival advantage for younger patients with this vaccine. P values for the older stratum were non-significant for both approaches. Tabl e 3 shows the results of Phase III trial. In case of the Mantel Haenzel test p value was significant and again the youngest people have an advantage (approximately 4 months) if they receive the vaccine with the overall sur- vival greater than those patients in the standard therapy. OPEN ACCESS Regarding the analysis of Non proportional hazard rate p values were non-significant. In Table 4 the combined data of Phase II and Phase III studies are shown, for both methods performed without taking into account the age p values are less than 0.05, and considering the age, younger stratum is benefit if they are vaccinated with CIMAVax®EGF. There is an advantage regarding median values for the patients under 60 years (5 months with a significant cli- nical and statistical relevance) From the Figure 1, the survival curves in the CI- MAvax®EGF vaccine group and standard therapy group diverge (at least in the younger stratum) after some time has elapsed, which suggests that a Fleming-Harrington test with q > 0 (that is, for detecting a delayed difference) is appropriate. It is observed that survival curves from the younger stratum are clearly separated, so the vaccinated group has an advantage over the group that only received the stan- dard therapy while for the older patients for both groups of treatment the benefit is the same. In all the survival curves regarding the youngest patients vaccinated (the last column of Figure 1) it is observed that the separation of the curves occurs early in time however patients over 60 years the effect of the vaccine is seen later (central column of the figure) 5. CONCLUSION According to the results of the finished phase II trial, we conclude that the group that received the CIMAVax ®EGF vaccine has a better response in the younger stra- tum. The analysis of the phase III trial data also corrobo- rates these results which contributes to obtain the sani- tary registration of this vaccine. When both studies phase II and III are combined, we also infer that the vaccine- tion with CIMAVax®EGF is more efficient in younger subjects since the median survival was of eleven months which is a remarkable figure for patients with NSCLC. 6. ACKNOWLEDGEMENTS This work has been supported by a UICC International Cancer Technology Transfer Fellowship. We thank: Monitor Group: Bárbara Wilkinson Brito, MSc. Clinical Laboratory; Liana Martínez, MSc. Ex- perimental Pharmacology; Mayelin Troche de la Concepción, BSc. Nursing; Aymara Fernandez Lorente, Medical Doctor; Data Manage- ment Group: Yanela Santiesteban González, Informatic Technique, Yuliannis Santiesteban González, Informatic Technique; Mabel Álvarez Cardona, Informatic Technique; Aliuska Frías Blanco, Informatic Technique. REFERENCES [1] Klein, J.P. and Moeschberger, M.L. (2003) Survival ana- lysis: Techniques for censored and truncated data. 2nd Edition, Springer, New York. [2] Martinussen, T. and Scheike, T.H. (2006) Dynamic re- gression models for survival data. Springer, New York. [3] Fleming T.R., Harrington D.P. (1991) Counting processes and survival analysis. Wiley. [4] Gehan, E.A. (1965) A generalized Wilcoxon test for com- paring arbitrarily singly-censored samples. Biometrika, 52, 203-223. [5] Peto, R. and Peto, J. (1972) Asymptotically efficient rank invariant test procedures. Journal of the Royal Statistical Society, Series A, 135, 185-206. doi:10.2307/2344317 [6] Tarone, RE. and Ware, J. (1977) On distribution-free tests for equality of survival distributions. Biometrika, 64, 156- 160. doi:10.1093/biomet/64.1.156 [7] Prentice, R.L. (1978) Linear rank tests with right cen- sored data. Biometrika, 65, 167-179. doi:10.1093/biomet/65.1.167 [8] Harrington, D.P. and Fleming, T.R. (1982) A class of rank test procedures for censored survival data. Biometrika, 69, 553-566. doi:10.1093/biomet/69.3.553 |