

Paper Menu >>
Journal Menu >>
 Open Journal of Metal, 2013, 3, 42-50 http://dx.doi.org/10.4236/ojmetal.2013.32A1006 Published Online July 2013 (http://www.scirp.org/journal/ojmetal) Zinc and Chromium Load in Road Dust, Suspended Particulate Matter and Foliar Dust Deposits of Anand City, Gujarat Tanushree Bhattacharya1*, Sukalyan Chakraborty1, Dhara Tuteja2, Mitul Patel2 1Environmental Science and Engineering Group, Birla Institute of Technology, Mesra, Ranchi, India 2Department of Environmental Science & Technology, Institute of Science and Technology for Advanced Studies & Research, Vallabh Vidyanagar, India Email: *[email protected] Received May 23, 2013; revised June 26, 2013; accepted July 3, 2013 Copyright © 2013 Tanushree Bhattacharya et al. This is an open access article distributed under the Creative Commons Attribution License, which permits unrestricted use, distribution, and reproduction in any medium, provided the original work is properly cited. ABSTRACT Anand, the milk capital of India, is a developing city with increasing vehicles and developmental activities going on at a fast pace. This study attempts to investigate the zinc and chromium concentration in street dust, suspended particulate matter and in foliar dust deposits. Ten sampling locations were selected based on the traffic density on the roads and different anthropogenic activity. Sampling was carried out in the dry months of January to March 2011. The range of Zn and Cr was 16.82 - 108.29 ppm and 118 - 151.5 ppm in the street dust respectively. Zn concentration in Suspended par- ticulate matter lies in the range of 12.41 to 86 ppm and Cr concentration between 75 to 130 ppm. The range of Cr in foliar deposited dust varied from 79.54 ppm to 31 ppm. Whereas, for Zn maximum concentration was in S10 which is 42.34 ppm and minimum was in site S9, 23.73 ppm. ANOVA single factor showed that at 0.05 level of significance site wise variation of zinc and chromium concentration in SPM, Street dust and foliar deposited dust was not significant signifying similar source of contamination. Which is further strengthened by the good positive correlation found be- tween the Zn and Cr concentration of street dust, leaf deposited dust and SPM. The Contamination Factor in the sites where metal concentration was high was 1.24 in S10 and 1.06 in S5 for Zn. For chromium the value of CF was 1.77 in S10 and 1.67 in S5. These values indicate that street dust is moderately contaminated with respect to zinc and chromium. Keywords: Heavy Metal; Street Dust; Contamination; Foliar Deposit; Suspended Particulate Matter 1. Introduction Soils along road environments typically contain high concentrations of heavy metals because of non-point con- tamination sources, most commonly vehicle exhaust and wear of vehicle parts. To many people, heavy metal pol- lution is a problem associated with areas of intensive in- dustry [1]. However, roadways and automobiles now are considered to be one of the largest sources of heavy met- als. Zinc, copper, and lead are three of the most common heavy metals released from road travel, accounting for at least 90 of the total metals in road run off. Lead concen- trations; however, consistently have been decreasing since leaded gasoline was discontinued. Smaller amounts of many other metals, such as nickel and cadmium, chro- mium are also found in road runoff and exhaust. About half of the zinc and copper contribution to the environ- ment from urbanization is from automobiles. Brakes re- lease copper, while tire wear releases zinc. Motor oil also tends to accumulate metals as it comes into contact with surrounding parts as the engine runs, so oil leaks become another pathway by which metals enter the environment. However, chromium comes from the chrome plating of some of the vehicular parts. Road dust also consists of deposition of vehicle exhausts and industrial exhausts, tire and brake wears, dust from paved roads or potholes, and dust from construction sites [2]. On the road surface, most heavy metals become bound to the surfaces of road dust or other particulates. During precipitation, the bound metals will either become solu- ble (dissolved) or be swept off the roadway with the dust. In either case, the metals enter the soil or are channeled into a storm drain. Whether in the soil or aquatic envi- ronment, metals can be transported by several processes. These processes are governed by the chemical nature of *Corresponding author. C opyright © 2013 SciRes. OJMetal 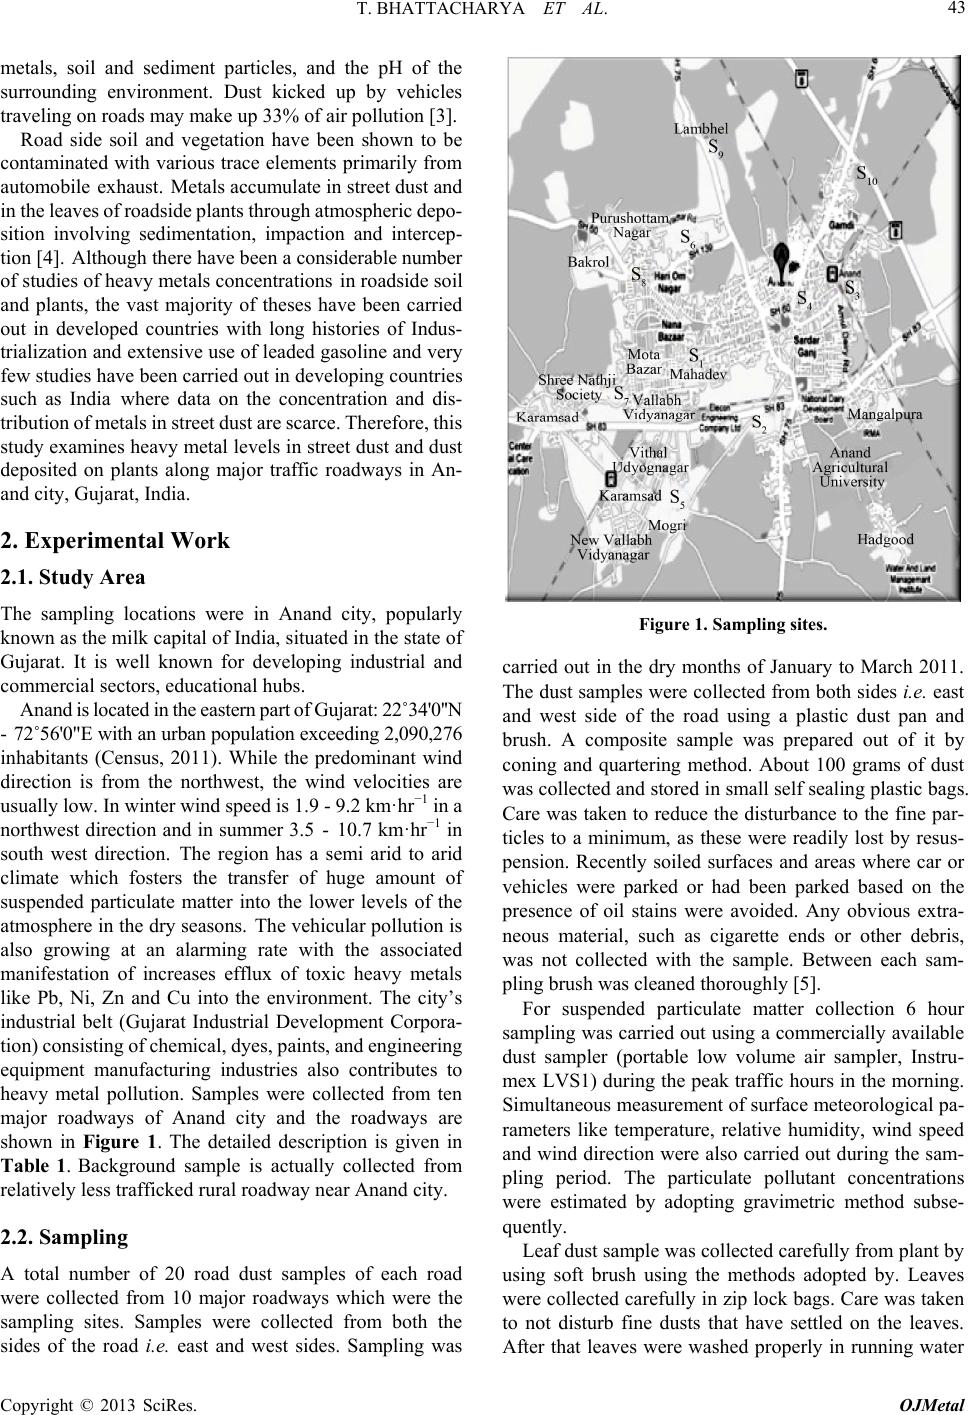 T. BHATTACHARYA ET AL. 43 metals, soil and sediment particles, and the pH of the surrounding environment. Dust kicked up by vehicles traveling on roads may make up 33% of air pollution [3]. Road side soil and vegetation have been shown to be contaminated with various trace elements primarily from automobile exhaust. Metals accumulate in street dust and in the leaves of roadside plants through atmospheric depo- sition involving sedimentation, impaction and intercep- tion [4]. Although there have been a considerable number of studies of heavy metals concentrations in roadside soil and plants, the vast majority of theses have been carried out in developed countries with long histories of Indus- trialization and extensive use of leaded gasoline and very few studies have been carried out in developing countries such as India where data on the concentration and dis- tribution of metals in street dust are scarce. Therefore, this study examines heavy metal levels in street dust and dust deposited on plants along major traffic roadways in An- and city, Gujarat, India. 2. Experimental Work 2.1. Study Area The sampling locations were in Anand city, popularly known as the milk capital of India, situated in the state of Gujarat. It is well known for developing industrial and commercial sectors, educational hubs. Anand is located in the eastern part of Gujarat: 22˚34'0''N - 72˚56'0"E with an urban population exceeding 2,090,276 inhabitants (Census, 2011). While the predominant wind direction is from the northwest, the wind velocities are usually low. In winter wind speed is 1.9 - 9.2 km·hr−1 in a northwest direction and in summer 3.5 - 10.7 km·hr−1 in south west direction. The region has a semi arid to arid climate which fosters the transfer of huge amount of suspended particulate matter into the lower levels of the atmosphere in the dry seasons. The vehicular pollution is also growing at an alarming rate with the associated manifestation of increases efflux of toxic heavy metals like Pb, Ni, Zn and Cu into the environment. The city’s industrial belt (Gujarat Industrial Development Corpora- tion) consisting of chemical, dyes, paints, and engineering equipment manufacturing industries also contributes to heavy metal pollution. Samples were collected from ten major roadways of Anand city and the roadways are shown in Figure 1. The detailed description is given in Table 1. Background sample is actually collected from relatively less trafficked rural roadway near Anand city. 2.2. Sampling A total number of 20 road dust samples of each road were collected from 10 major roadways which were the sampling sites. Samples were collected from both the sides of the road i.e. east and west sides. Sampling was Figure 1. Sampling sites. carried out in the dry months of January to March 2011. The dust samples were collected from both sides i.e. east and west side of the road using a plastic dust pan and brush. A composite sample was prepared out of it by coning and quartering method. About 100 grams of dust was collected and stored in small self sealing plastic bags. Care was taken to reduce the disturbance to the fine par- ticles to a minimum, as these were readily lost by resus- pension. Recently soiled surfaces and areas where car or vehicles were parked or had been parked based on the presence of oil stains were avoided. Any obvious extra- neous material, such as cigarette ends or other debris, was not collected with the sample. Between each sam- pling brush was cleaned thoroughly [5]. For suspended particulate matter collection 6 hour sampling was carried out using a commercially available dust sampler (portable low volume air sampler, Instru- mex LVS1) during the peak traffic hours in the morning. Simultaneous measurement of surface meteorological pa- rameters like temperature, relative humidity, wind speed and wind direction were also carried out during the sam- pling period. The particulate pollutant concentrations were estimated by adopting gravimetric method subse- quently. Leaf dust sample was collected carefully from plant by using soft brush using the methods adopted by. Leaves were collected carefully in zip lock bags. Care was taken to not disturb fine dusts that have settled on the leaves. fter that leaves were washed properly in running water A Copyright © 2013 SciRes. OJMetal 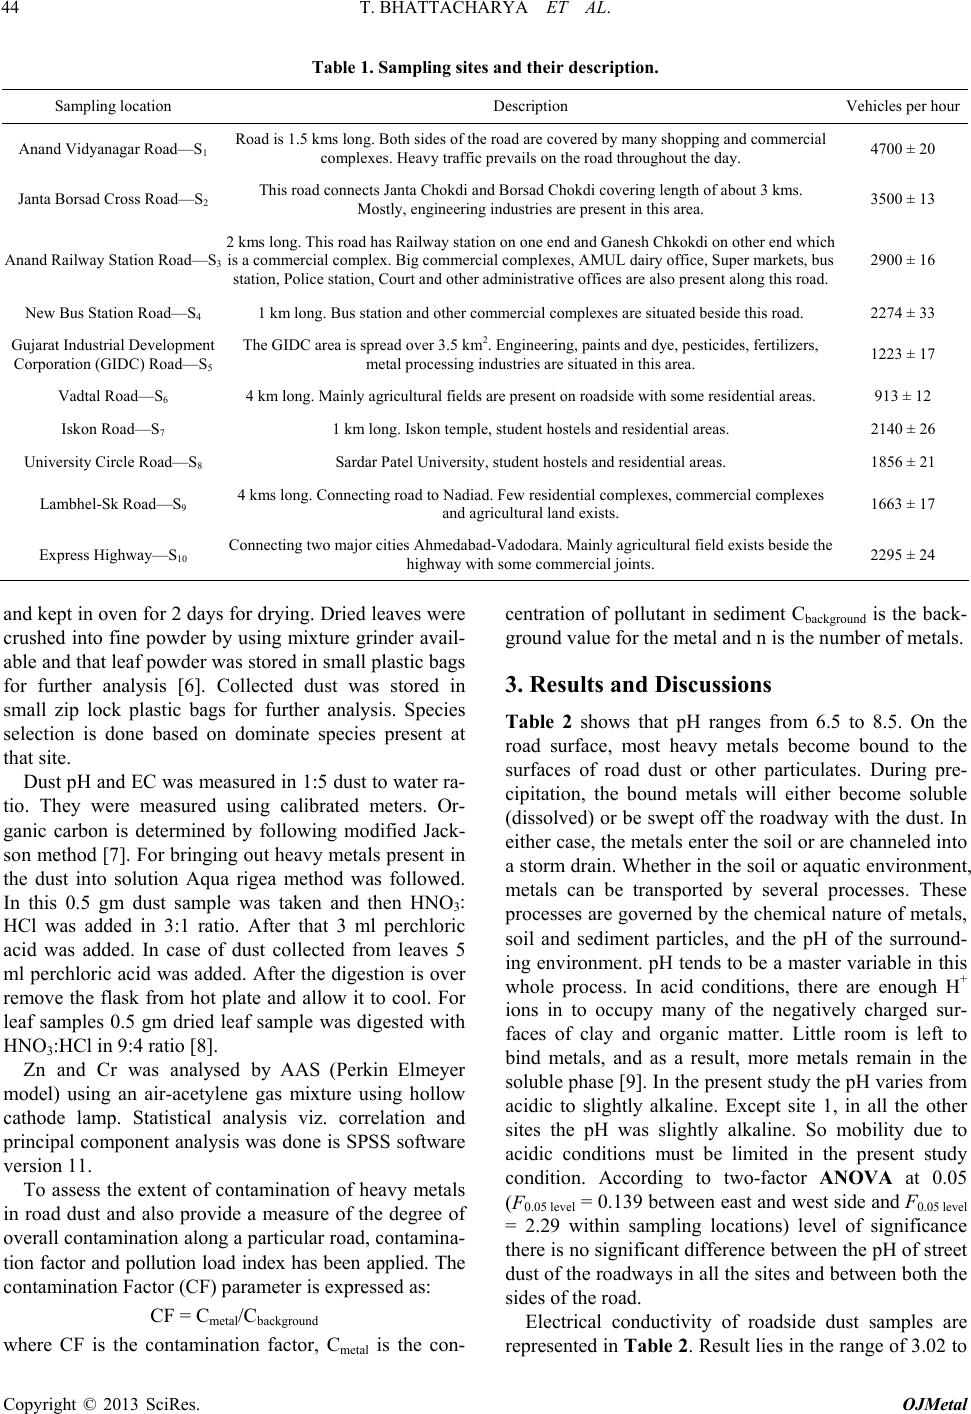 T. BHATTACHARYA ET AL. Copyright © 2013 SciRes. OJMetal 44 Table 1. Sampling sites and their descri ption. Sampling location Description Vehicles per hour Anand Vidyanagar Road—S1 Road is 1.5 kms long. Both sides of the road are covered by many shopping and commercial complexes. Heavy traffic prevails on the road throughout the day. 4700 ± 20 Janta Borsad Cross Road—S2 This road connects Janta Chokdi and Borsad Chokdi covering length of about 3 kms. Mostly, engineering industries are present in this area. 3500 ± 13 Anand Railway Station Road—S3 2 kms long. This road has Railway station on one end and Ganesh Chkokdi on other end which is a commercial complex. Big commercial complexes, AMUL dairy office, Super markets, bus station, Police station, Court and other administrative offices are also present along this road. 2900 ± 16 New Bus Station Road—S4 1 km long. Bus station and other commercial complexes are situated beside this road. 2274 ± 33 Gujarat Industrial Development Corporation (GIDC) Road—S5 The GIDC area is spread over 3.5 km2. Engineering, paints and dye, pesticides, fertilizers, metal processing industries are situated in this area. 1223 ± 17 Vadtal Road—S6 4 km long. Mainly agricultural fields are present on roadside with some residential areas. 913 ± 12 Iskon Road—S7 1 km long. Iskon temple, student hostels and residential areas. 2140 ± 26 University Circle Road—S8 Sardar Patel University, student hostels and residential areas. 1856 ± 21 Lambhel-Sk Road—S9 4 kms long. Connecting road to Nadiad. Few residential complexes, commercial complexes and agricultural land exists. 1663 ± 17 Express Highway—S10 Connecting two major cities Ahmedabad-Vadodara. Mainly agricultural field exists beside the highway with some commercial joints. 2295 ± 24 and kept in oven for 2 days for drying. Dried leaves were crushed into fine powder by using mixture grinder avail- able and that leaf powder was stored in small plastic bags for further analysis [6]. Collected dust was stored in small zip lock plastic bags for further analysis. Species selection is done based on dominate species present at that site. Dust pH and EC was measured in 1:5 dust to water ra- tio. They were measured using calibrated meters. Or- ganic carbon is determined by following modified Jack- son method [7]. For bringing out heavy metals present in the dust into solution Aqua rigea method was followed. In this 0.5 gm dust sample was taken and then HNO3: HCl was added in 3:1 ratio. After that 3 ml perchloric acid was added. In case of dust collected from leaves 5 ml perchloric acid was added. After the digestion is over remove the flask from hot plate and allow it to cool. For leaf samples 0.5 gm dried leaf sample was digested with HNO3:HCl in 9:4 ratio [8]. Zn and Cr was analysed by AAS (Perkin Elmeyer model) using an air-acetylene gas mixture using hollow cathode lamp. Statistical analysis viz. correlation and principal component analysis was done is SPSS software version 11. To assess the extent of contamination of heavy metals in road dust and also provide a measure of the degree of overall contamination along a particular road, contamina- tion factor and pollution load index has been applied. The contamination Factor (CF) parameter is expressed as: CF = Cmetal/C background where CF is the contamination factor, Cmetal is the con- centration of pollutant in sediment Cbackground is the back- ground value for the metal and n is the number of metals. 3. Results and Discussions Table 2 shows that pH ranges from 6.5 to 8.5. On the road surface, most heavy metals become bound to the surfaces of road dust or other particulates. During pre- cipitation, the bound metals will either become soluble (dissolved) or be swept off the roadway with the dust. In either case, the metals enter the soil or are channeled into a storm drain. Whether in the soil or aquatic environment, metals can be transported by several processes. These processes are governed by the chemical nature of metals, soil and sediment particles, and the pH of the surround- ing environment. pH tends to be a master variable in this whole process. In acid conditions, there are enough H+ ions in to occupy many of the negatively charged sur- faces of clay and organic matter. Little room is left to bind metals, and as a result, more metals remain in the soluble phase [9]. In the present study the pH varies from acidic to slightly alkaline. Except site 1, in all the other sites the pH was slightly alkaline. So mobility due to acidic conditions must be limited in the present study condition. According to two-factor ANOVA at 0.05 (F0.05 level = 0.139 between east and west side and F0.05 level = 2.29 within sampling locations) level of significance there is no significant difference between the pH of street dust of the roadways in all the sites and between both the sides of the road. Electrical conductivity of roadside dust samples are represented in Table 2 . Result lies in the range of 3.02 to 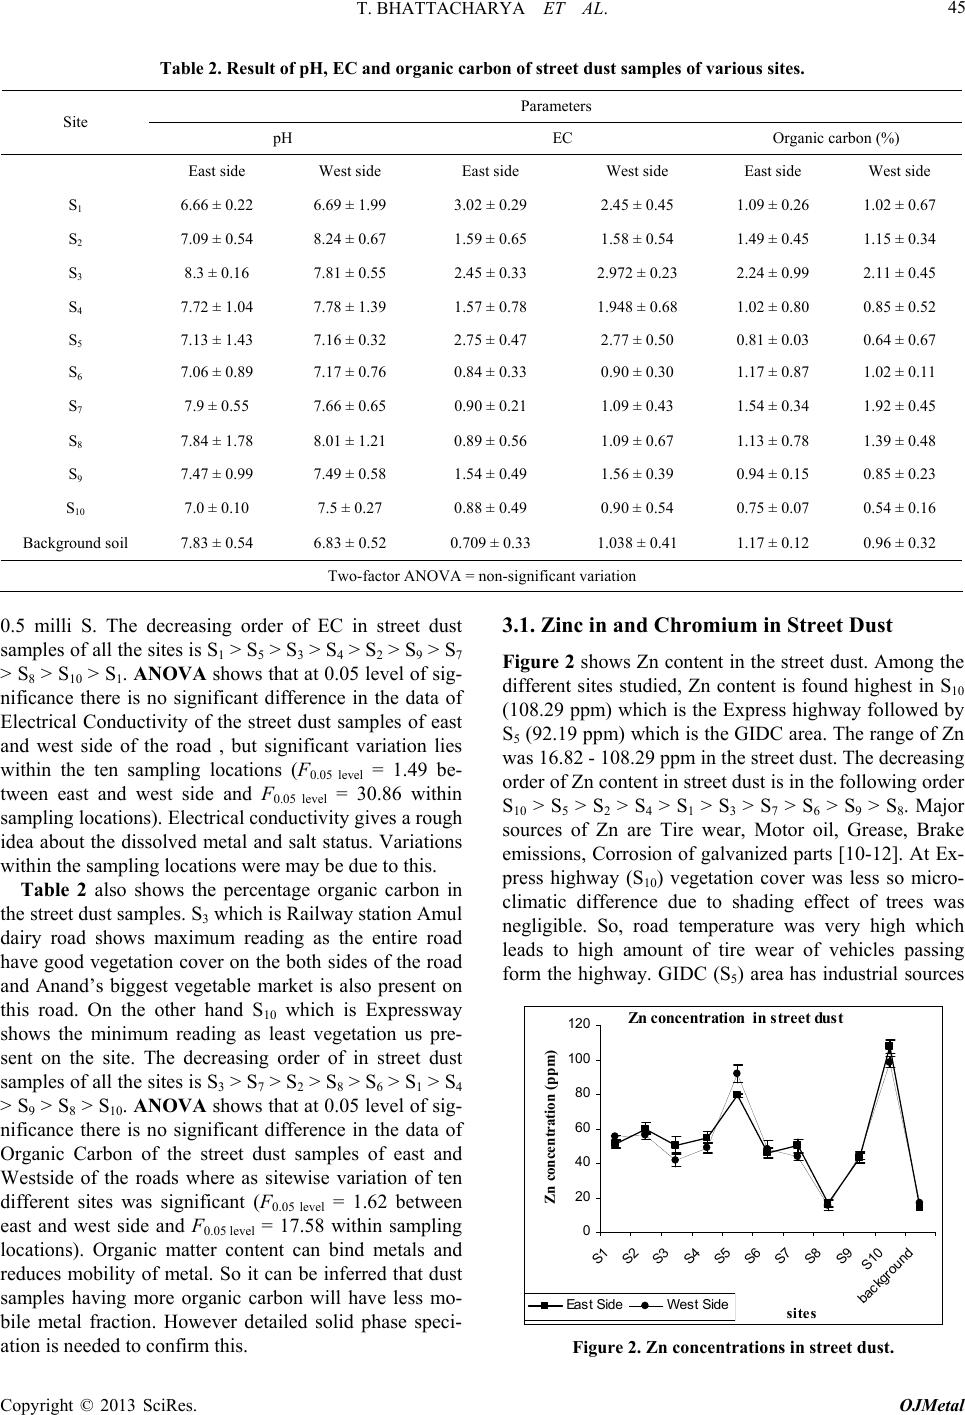 T. BHATTACHARYA ET AL. 45 Table 2. Result of pH, EC and organic carbon of street dust samples of various sites. Parameters Site pH EC Organic carbon (%) East side West side East side West side East side West side S1 6.66 ± 0.22 6.69 ± 1.99 3.02 ± 0.29 2.45 ± 0.45 1.09 ± 0.26 1.02 ± 0.67 S2 7.09 ± 0.54 8.24 ± 0.67 1.59 ± 0.65 1.58 ± 0.54 1.49 ± 0.45 1.15 ± 0.34 S3 8.3 ± 0.16 7.81 ± 0.55 2.45 ± 0.33 2.972 ± 0.23 2.24 ± 0.99 2.11 ± 0.45 S4 7.72 ± 1.04 7.78 ± 1.39 1.57 ± 0.78 1.948 ± 0.68 1.02 ± 0.80 0.85 ± 0.52 S5 7.13 ± 1.43 7.16 ± 0.32 2.75 ± 0.47 2.77 ± 0.50 0.81 ± 0.03 0.64 ± 0.67 S6 7.06 ± 0.89 7.17 ± 0.76 0.84 ± 0.33 0.90 ± 0.30 1.17 ± 0.87 1.02 ± 0.11 S7 7.9 ± 0.55 7.66 ± 0.65 0.90 ± 0.21 1.09 ± 0.43 1.54 ± 0.34 1.92 ± 0.45 S8 7.84 ± 1.78 8.01 ± 1.21 0.89 ± 0.56 1.09 ± 0.67 1.13 ± 0.78 1.39 ± 0.48 S9 7.47 ± 0.99 7.49 ± 0.58 1.54 ± 0.49 1.56 ± 0.39 0.94 ± 0.15 0.85 ± 0.23 S10 7.0 ± 0.10 7.5 ± 0.27 0.88 ± 0.49 0.90 ± 0.54 0.75 ± 0.07 0.54 ± 0.16 Background soil 7.83 ± 0.54 6.83 ± 0.52 0.709 ± 0.33 1.038 ± 0.41 1.17 ± 0.12 0.96 ± 0.32 Two-factor ANOVA = non-significant variation 0.5 milli S. The decreasing order of EC in street dust samples of all the sites is S1 > S5 > S3 > S4 > S2 > S9 > S7 > S8 > S10 > S1. ANOVA shows that at 0.05 level of sig- nificance there is no significant difference in the data of Electrical Conductivity of the street dust samples of east and west side of the road , but significant variation lies within the ten sampling locations (F0.05 level = 1.49 be- tween east and west side and F0.05 level = 30.86 within sampling locations). Electrical conductivity gives a rough idea about the dissolved metal and salt status. Variations within the sampling locations were may be due to this. Table 2 also shows the percentage organic carbon in the street dust samples. S3 which is Railway station Amul dairy road shows maximum reading as the entire road have good vegetation cover on the both sides of the road and Anand’s biggest vegetable market is also present on this road. On the other hand S10 which is Expressway shows the minimum reading as least vegetation us pre- sent on the site. The decreasing order of in street dust samples of all the sites is S3 > S7 > S2 > S8 > S6 > S1 > S4 > S9 > S8 > S10. ANOVA shows that at 0.05 level of sig- nificance there is no significant difference in the data of Organic Carbon of the street dust samples of east and Westside of the roads where as sitewise variation of ten different sites was significant (F0.05 level = 1.62 between east and west side and F0.05 level = 17.58 within sampling locations). Organic matter content can bind metals and reduces mobility of metal. So it can be inferred that dust samples having more organic carbon will have less mo- bile metal fraction. However detailed solid phase speci- ation is needed to confirm this. 3.1. Zinc in and Chromium in Street Dust Figure 2 shows Zn content in the street dust. Among the different sites studied, Zn content is found highest in S10 (108.29 ppm) which is the Express highway followed by S5 (92.19 ppm) which is the GIDC area. The range of Zn was 16.82 - 108.29 ppm in the street dust. The decreasing order of Zn content in street dust is in the following order S10 > S5 > S2 > S4 > S1 > S3 > S7 > S6 > S9 > S8. Major sources of Zn are Tire wear, Motor oil, Grease, Brake emissions, Corrosion of galvanized parts [10-12]. At Ex- press highway (S10) vegetation cover was less so micro- climatic difference due to shading effect of trees was negligible. So, road temperature was very high which leads to high amount of tire wear of vehicles passing form the highway. GIDC (S5) area has industrial sources Zn concentra tion in street dust 0 20 40 60 80 100 120 S1 S2 S3 S4 S5 S6 S7 S8 S9 S10 background site s Zn concentration (ppm) East SideWest Side Figure 2. Zn concentrations in street dust. Copyright © 2013 SciRes. OJMetal 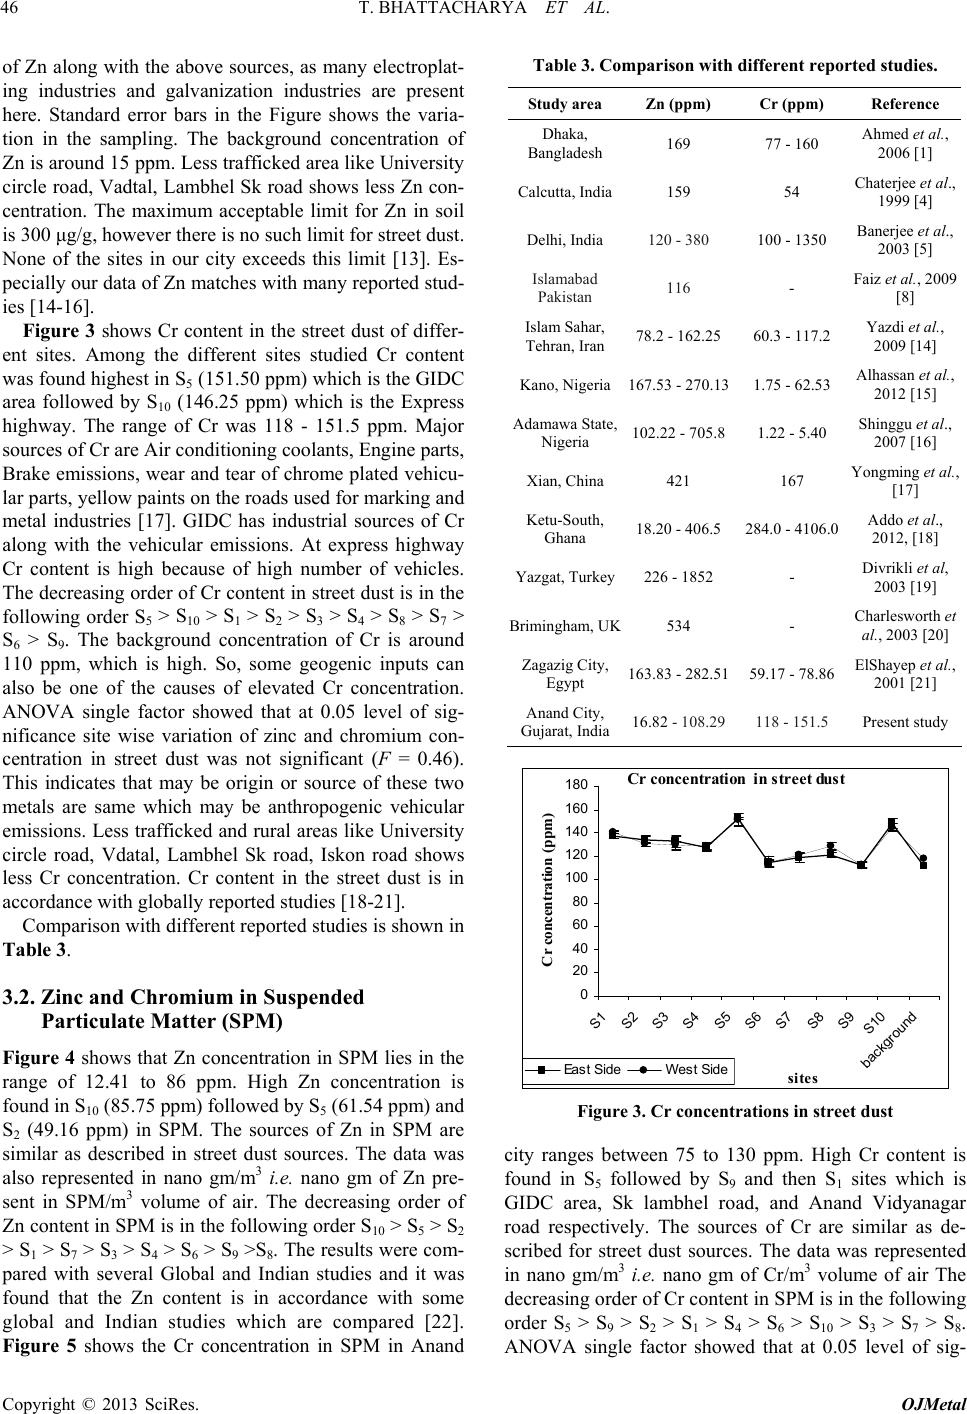 T. BHATTACHARYA ET AL. 46 of Zn along with the above sources, as many electroplat- ing industries and galvanization industries are present here. Standard error bars in the Figure shows the varia- tion in the sampling. The background concentration of Zn is around 15 ppm. Less trafficked area like University circle road, Vadtal, Lambhel Sk road shows less Zn con- centration. The maximum acceptable limit for Zn in soil is 300 μg/g, however there is no such limit for street dust. None of the sites in our city exceeds this limit [13]. Es- pecially our data of Zn matches with many reported stud- ies [14-16]. Figure 3 shows Cr content in the street dust of differ- ent sites. Among the different sites studied Cr content was found highest in S5 (151.50 ppm) which is the GIDC area followed by S10 (146.25 ppm) which is the Express highway. The range of Cr was 118 - 151.5 ppm. Major sources of Cr are Air conditioning coolants, Engine parts, Brake emissions, wear and tear of chrome plated vehicu- lar parts, yellow paints on the roads used for marking and metal industries [17]. GIDC has industrial sources of Cr along with the vehicular emissions. At express highway Cr content is high because of high number of vehicles. The decreasing order of Cr content in street dust is in the following order S5 > S10 > S1 > S2 > S3 > S4 > S8 > S7 > S6 > S9. The background concentration of Cr is around 110 ppm, which is high. So, some geogenic inputs can also be one of the causes of elevated Cr concentration. ANOVA single factor showed that at 0.05 level of sig- nificance site wise variation of zinc and chromium con- centration in street dust was not significant (F = 0.46). This indicates that may be origin or source of these two metals are same which may be anthropogenic vehicular emissions. Less trafficked and rural areas like University circle road, Vdatal, Lambhel Sk road, Iskon road shows less Cr concentration. Cr content in the street dust is in accordance with globally reported studies [18-21]. Comparison with different reported studies is shown in Table 3. 3.2. Zinc and Chromium in Suspended Particulate Matter (SPM) Figure 4 shows that Zn concentration in SPM lies in the range of 12.41 to 86 ppm. High Zn concentration is found in S10 (85.75 ppm) followed by S5 (61.54 ppm) and S2 (49.16 ppm) in SPM. The sources of Zn in SPM are similar as described in street dust sources. The data was also represented in nano gm/m3 i.e. nano gm of Zn pre- sent in SPM/m3 volume of air. The decreasing order of Zn content in SPM is in the following order S10 > S5 > S2 > S1 > S7 > S3 > S4 > S6 > S9 >S8. The results were com- pared with several Global and Indian studies and it was found that the Zn content is in accordance with some global and Indian studies which are compared [22]. Figure 5 shows the Cr concentration in SPM in Anand Table 3. Comparison with different reported studies. Study area Zn (ppm) Cr (ppm) Reference Dhaka, Bangladesh 169 77 - 160 Ahmed et al., 2006 [1] Calcutta, India159 54 Chaterjee et al., 1999 [4] Delhi, India 120 - 380 100 - 1350 Banerjee et al., 2003 [5] Islamabad Pakistan 116 - Faiz et al., 2009 [8] Islam Sahar, Tehran, Iran 78.2 - 162.2560.3 - 117.2 Yazdi et al., 2009 [14] Kano, Nigeria167.53 - 270.131.75 - 62.53 Alhassan et al., 2012 [15] Adamawa State, Nigeria 102.22 - 705.81.22 - 5.40 Shinggu et al., 2007 [16] Xian, China 421 167 Yongming et al., [17] Ketu-South, Ghana 18.20 - 406.5284.0 - 4106.0 Addo et al., 2012, [18] Yazgat, Turkey226 - 1852 - Divrikli et al, 2003 [19] Brimingham, UK534 - Charlesworth et al., 2003 [20] Zagazig City, Egypt 163.83 - 282.5159.17 - 78.86 ElShayep et al., 2001 [21] Anand City, Gujarat, India16.82 - 108.29118 - 151.5 Present study C r concentration i n stree t dust 0 20 40 60 80 100 120 140 160 180 S1 S2 S3 S4 S5 S6 S7 S8 S9 S10 background site s Cr concentration (ppm) East SideWest Side Figure 3. Cr concentrations in street dust city ranges between 75 to 130 ppm. High Cr content is found in S5 followed by S9 and then S1 sites which is GIDC area, Sk lambhel road, and Anand Vidyanagar road respectively. The sources of Cr are similar as de- scribed for street dust sources. The data was represented in nano gm/m3 i.e. nano gm of Cr/m3 volume of air The decreasing order of Cr content in SPM is in the following order S5 > S9 > S2 > S1 > S4 > S6 > S10 > S3 > S7 > S8. ANOVA single factor showed that at 0.05 level of sig- Copyright © 2013 SciRes. OJMetal 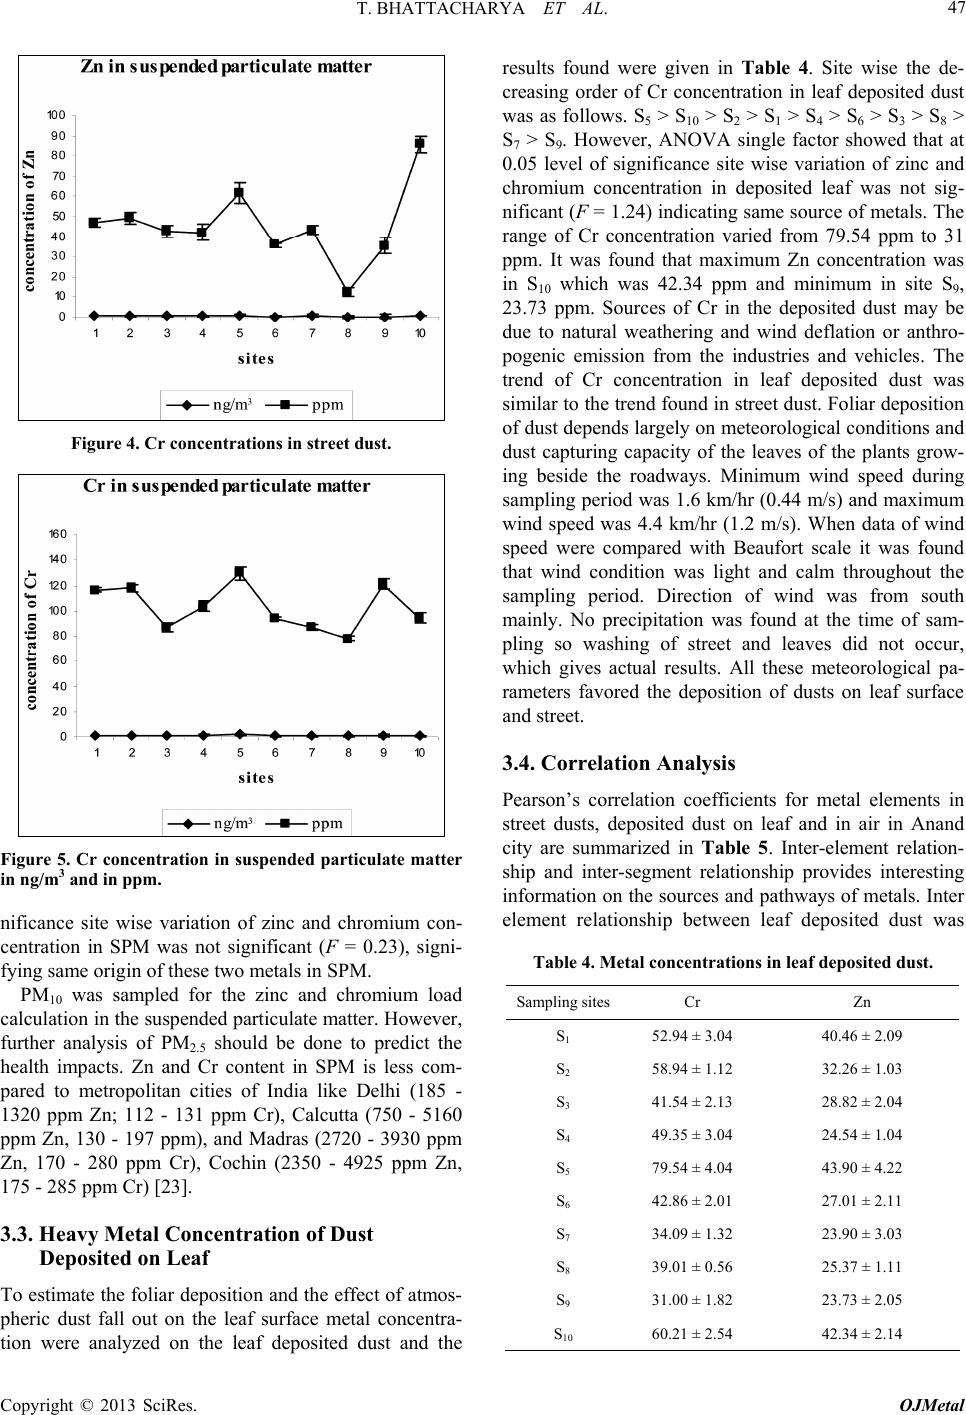 T. BHATTACHARYA ET AL. 47 Figure 4. Cr concentrations in street dust. Figure 5. Cr concentration in suspended particulate matter in ng/m3 and in ppm. nificance site wise variation of zinc and chromium con- centration in SPM was not significant (F = 0.23), signi- fying same origin of these two metals in SPM. PM10 was sampled for the zinc and chromium load calculation in the suspended particulate matter. However, further analysis of PM2.5 should be done to predict the health impacts. Zn and Cr content in SPM is less com- pared to metropolitan cities of India like Delhi (185 - 1320 ppm Zn; 112 - 131 ppm Cr), Calcutta (750 - 5160 ppm Zn, 130 - 197 ppm), and Madras (2720 - 3930 ppm Zn, 170 - 280 ppm Cr), Cochin (2350 - 4925 ppm Zn, 175 - 285 ppm Cr) [23]. 3.3. Heavy Metal Concentration of Dust Deposited on Leaf To estimate the foliar deposition and the effect of atmos- pheric dust fall out on the leaf surface metal concentra- tion were analyzed on the leaf deposited dust and the results found were given in Table 4. Site wise the de- creasing order of Cr concentration in leaf deposited dust was as follows. S5 > S10 > S2 > S1 > S4 > S6 > S3 > S8 > S7 > S9. However, ANOVA single factor showed that at 0.05 level of significance site wise variation of zinc and chromium concentration in deposited leaf was not sig- nificant (F = 1.24) indicating same source of metals. The range of Cr concentration varied from 79.54 ppm to 31 ppm. It was found that maximum Zn concentration was in S10 which was 42.34 ppm and minimum in site S9, 23.73 ppm. Sources of Cr in the deposited dust may be due to natural weathering and wind deflation or anthro- pogenic emission from the industries and vehicles. The trend of Cr concentration in leaf deposited dust was similar to the trend found in street dust. Foliar deposition of dust depends largely on meteorological conditions and dust capturing capacity of the leaves of the plants grow- ing beside the roadways. Minimum wind speed during sampling period was 1.6 km/hr (0.44 m/s) and maximum wind speed was 4.4 km/hr (1.2 m/s). When data of wind speed were compared with Beaufort scale it was found that wind condition was light and calm throughout the sampling period. Direction of wind was from south mainly. No precipitation was found at the time of sam- pling so washing of street and leaves did not occur, which gives actual results. All these meteorological pa- rameters favored the deposition of dusts on leaf surface and street. 3.4. Correlation Analysis Pearson’s correlation coefficients for metal elements in street dusts, deposited dust on leaf and in air in Anand city are summarized in Table 5. Inter-element relation- ship and inter-segment relationship provides interesting information on the sources and pathways of metals. Inter element relationship between leaf deposited dust was Table 4. Metal concentrations in leaf deposite d dust. Sampling sitesCr Zn S1 52.94 ± 3.04 40.46 ± 2.09 S2 58.94 ± 1.12 32.26 ± 1.03 S3 41.54 ± 2.13 28.82 ± 2.04 S4 49.35 ± 3.04 24.54 ± 1.04 S5 79.54 ± 4.04 43.90 ± 4.22 S6 42.86 ± 2.01 27.01 ± 2.11 S7 34.09 ± 1.32 23.90 ± 3.03 S8 39.01 ± 0.56 25.37 ± 1.11 S9 31.00 ± 1.82 23.73 ± 2.05 S10 60.21 ± 2.54 42.34 ± 2.14 Copyright © 2013 SciRes. OJMetal 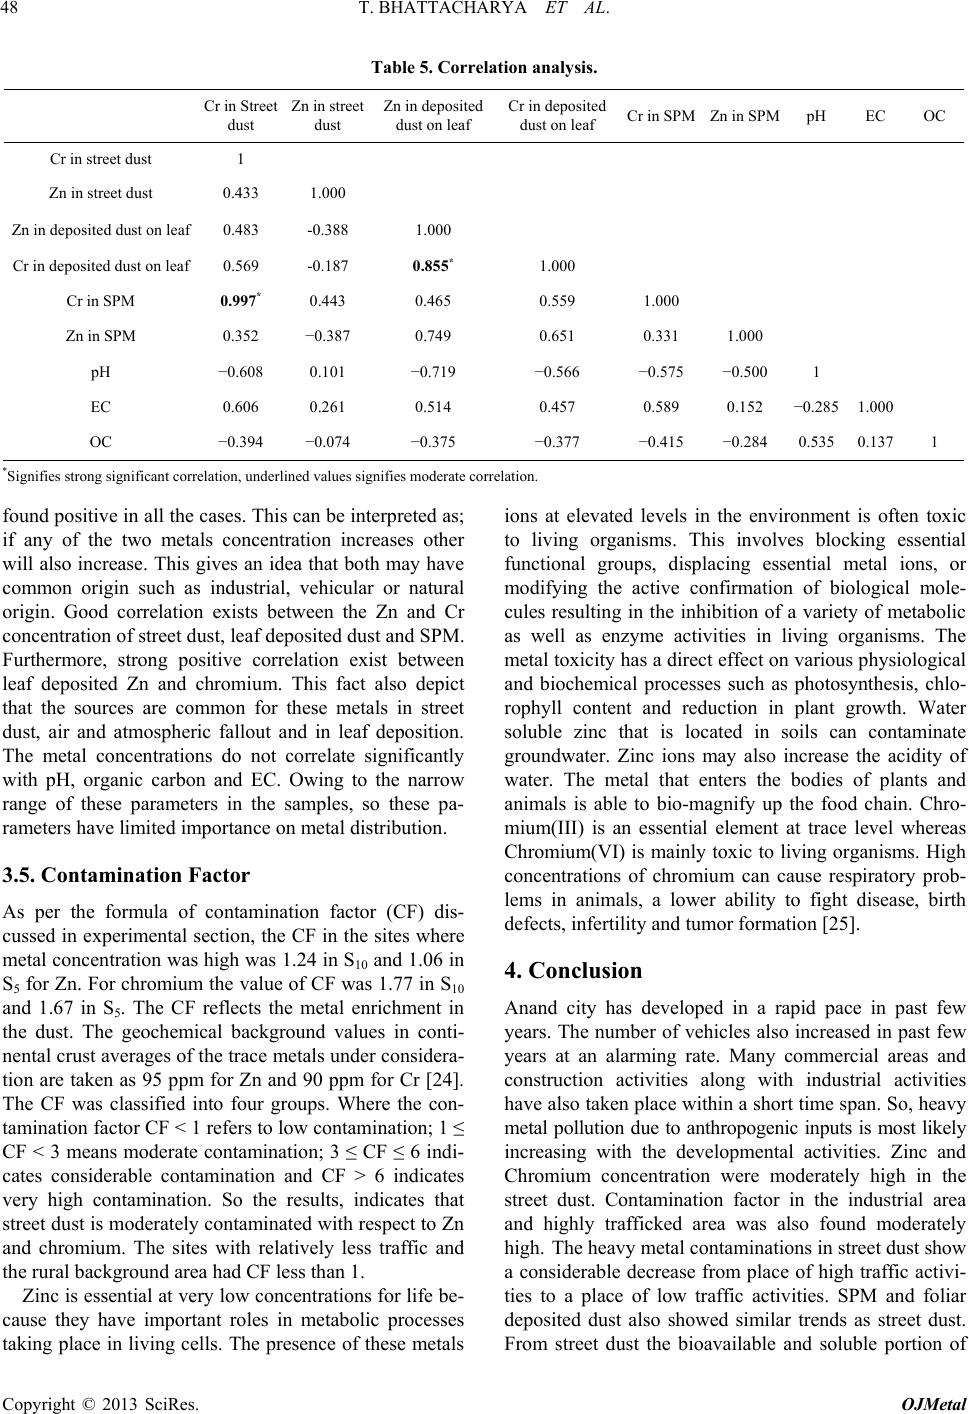 T. BHATTACHARYA ET AL. Copyright © 2013 SciRes. OJMetal 48 Table 5. Correlation analysis. Cr in Street dust Zn in street dust Zn in deposited dust on leaf Cr in deposited dust on leaf Cr in SPMZn in SPM pH EC OC Cr in street dust 1 Zn in street dust 0.433 1.000 Zn in deposited dust on leaf 0.483 -0.388 1.000 Cr in deposited dust on leaf 0.569 -0.187 0.855* 1.000 Cr in SPM 0.997* 0.443 0.465 0.559 1.000 Zn in SPM 0.352 −0.387 0.749 0.651 0.331 1.000 pH −0.608 0.101 −0.719 −0.566 −0.575 −0.500 1 EC 0.606 0.261 0.514 0.457 0.589 0.152 −0.285 1.000 OC −0.394 −0.074 −0.375 −0.377 −0.415 −0.284 0.535 0.1371 *Signifies strong significant correlation, underlined values signifies moderate correlation. found positive in all the cases. This can be interpreted as; if any of the two metals concentration increases other will also increase. This gives an idea that both may have common origin such as industrial, vehicular or natural origin. Good correlation exists between the Zn and Cr concentration of street dust, leaf deposited dust and SPM. Furthermore, strong positive correlation exist between leaf deposited Zn and chromium. This fact also depict that the sources are common for these metals in street dust, air and atmospheric fallout and in leaf deposition. The metal concentrations do not correlate significantly with pH, organic carbon and EC. Owing to the narrow range of these parameters in the samples, so these pa- rameters have limited importance on metal distribution. 3.5. Contamination Factor As per the formula of contamination factor (CF) dis- cussed in experimental section, the CF in the sites where metal concentration was high was 1.24 in S10 and 1.06 in S5 for Zn. For chromium the value of CF was 1.77 in S10 and 1.67 in S5. The CF reflects the metal enrichment in the dust. The geochemical background values in conti- nental crust averages of the trace metals under considera- tion are taken as 95 ppm for Zn and 90 ppm for Cr [24]. The CF was classified into four groups. Where the con- tamination factor CF < 1 refers to low contamination; 1 ≤ CF < 3 means moderate contamination; 3 ≤ CF ≤ 6 indi- cates considerable contamination and CF > 6 indicates very high contamination. So the results, indicates that street dust is moderately contaminated with respect to Zn and chromium. The sites with relatively less traffic and the rural background area had CF less than 1. Zinc is essential at very low concentrations for life be- cause they have important roles in metabolic processes taking place in living cells. The presence of these metals ions at elevated levels in the environment is often toxic to living organisms. This involves blocking essential functional groups, displacing essential metal ions, or modifying the active confirmation of biological mole- cules resulting in the inhibition of a variety of metabolic as well as enzyme activities in living organisms. The metal toxicity has a direct effect on various physiological and biochemical processes such as photosynthesis, chlo- rophyll content and reduction in plant growth. Water soluble zinc that is located in soils can contaminate groundwater. Zinc ions may also increase the acidity of water. The metal that enters the bodies of plants and animals is able to bio-magnify up the food chain. Chro- mium(III) is an essential element at trace level whereas Chromium(VI) is mainly toxic to living organisms. High concentrations of chromium can cause respiratory prob- lems in animals, a lower ability to fight disease, birth defects, infertility and tumor formation [25]. 4. Conclusion Anand city has developed in a rapid pace in past few years. The number of vehicles also increased in past few years at an alarming rate. Many commercial areas and construction activities along with industrial activities have also taken place within a short time span. So, heavy metal pollution due to anthropogenic inputs is most likely increasing with the developmental activities. Zinc and Chromium concentration were moderately high in the street dust. Contamination factor in the industrial area and highly trafficked area was also found moderately high. The heavy metal contaminations in street dust show a considerable decrease from place of high traffic activi- ties to a place of low traffic activities. SPM and foliar deposited dust also showed similar trends as street dust. From street dust the bioavailable and soluble portion of 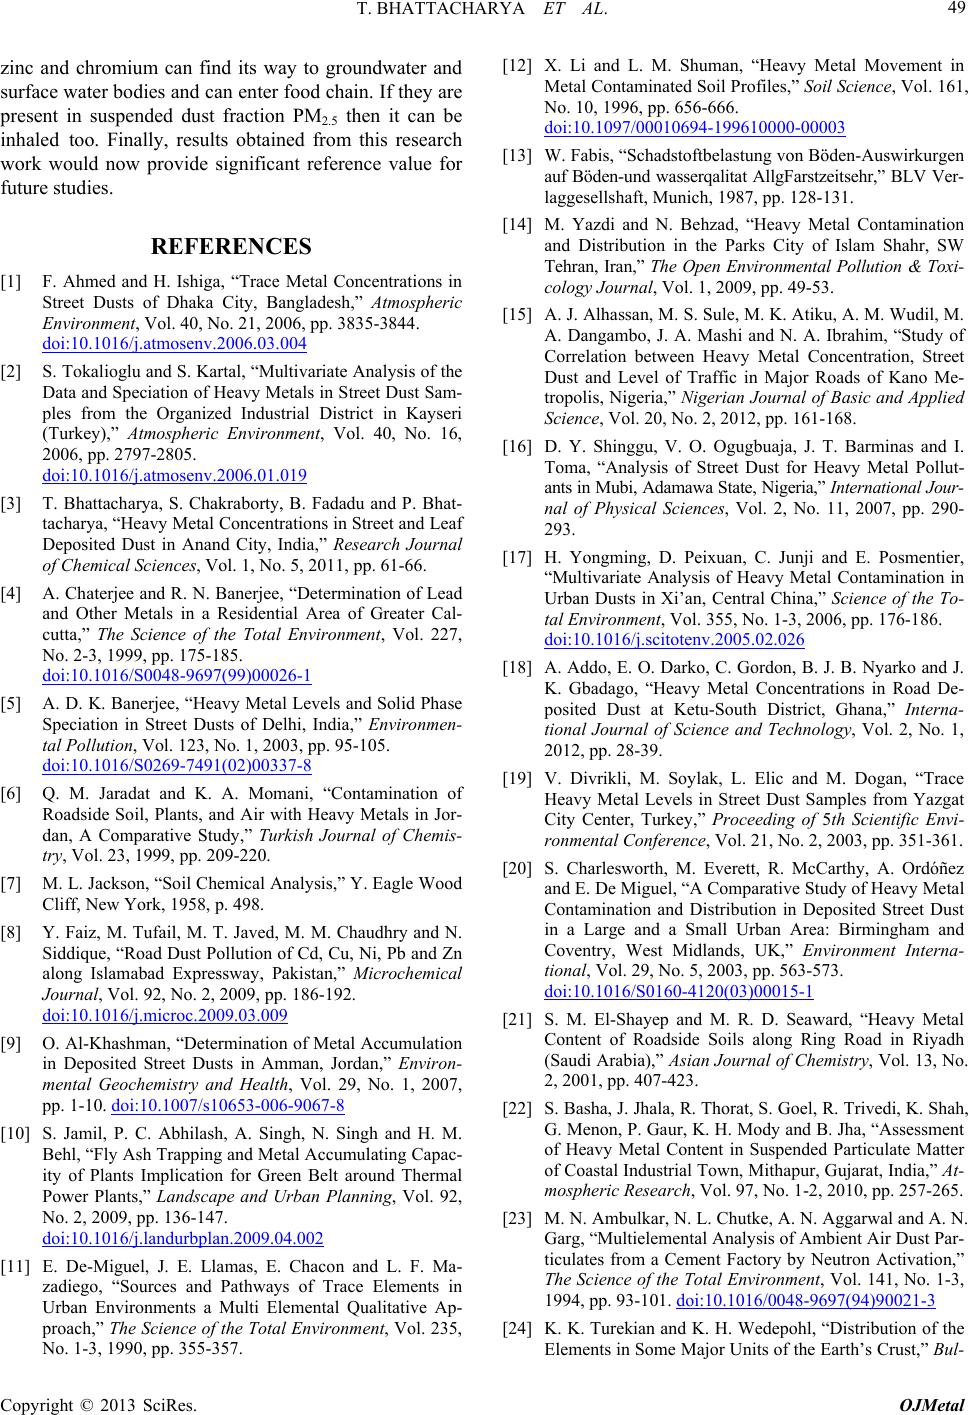 T. BHATTACHARYA ET AL. 49 zinc and chromium can find its way to groundwater and surface water bodies and can enter food chain. If they are present in suspended dust fraction PM2.5 then it can be inhaled too. Finally, results obtained from this research work would now provide significant reference value for future studies. REFERENCES [1] F. Ahmed and H. Ishiga, “Trace Metal Concentrations in Street Dusts of Dhaka City, Bangladesh,” Atmospheric Environment, Vol. 40, No. 21, 2006, pp. 3835-3844. doi:10.1016/j.atmosenv.2006.03.004 [2] S. Tokalioglu and S. Kartal, “Multivariate Analysis of the Data and Speciation of Heavy Metals in Street Dust Sam- ples from the Organized Industrial District in Kayseri (Turkey),” Atmospheric Environment, Vol. 40, No. 16, 2006, pp. 2797-2805. doi:10.1016/j.atmosenv.2006.01.019 [3] T. Bhattacharya, S. Chakraborty, B. Fadadu and P. Bhat- tacharya, “Heavy Metal Concentrations in Street and Leaf Deposited Dust in Anand City, India,” Research Journal of Chemical Sciences, Vol. 1, No. 5, 2011, pp. 61-66. [4] A. Chaterjee and R. N. Banerjee, “Determination of Lead and Other Metals in a Residential Area of Greater Cal- cutta,” The Science of the Total Environment, Vol. 227, No. 2-3, 1999, pp. 175-185. doi:10.1016/S0048-9697(99)00026-1 [5] A. D. K. Banerjee, “Heavy Metal Levels and Solid Phase Speciation in Street Dusts of Delhi, India,” Environmen- tal Pollution, Vol. 123, No. 1, 2003, pp. 95-105. doi:10.1016/S0269-7491(02)00337-8 [6] Q. M. Jaradat and K. A. Momani, “Contamination of Roadside Soil, Plants, and Air with Heavy Metals in Jor- dan, A Comparative Study,” Turkish Journal of Chemis- try, Vol. 23, 1999, pp. 209-220. [7] M. L. Jackson, “Soil Chemical Analysis,” Y. Eagle Wood Cliff, New York, 1958, p. 498. [8] Y. Faiz, M. Tufail, M. T. Javed, M. M. Chaudhry and N. Siddique, “Road Dust Pollution of Cd, Cu, Ni, Pb and Zn along Islamabad Expressway, Pakistan,” Microchemical Journal, Vol. 92, No. 2, 2009, pp. 186-192. doi:10.1016/j.microc.2009.03.009 [9] O. Al-Khashman, “Determination of Metal Accumulation in Deposited Street Dusts in Amman, Jordan,” Environ- mental Geochemistry and Health, Vol. 29, No. 1, 2007, pp. 1-10. doi:10.1007/s10653-006-9067-8 [10] S. Jamil, P. C. Abhilash, A. Singh, N. Singh and H. M. Behl, “Fly Ash Trapping and Metal Accumulating Capac- ity of Plants Implication for Green Belt around Thermal Power Plants,” Landscape and Urban Planning, Vol. 92, No. 2, 2009, pp. 136-147. doi:10.1016/j.landurbplan.2009.04.002 [11] E. De-Miguel, J. E. Llamas, E. Chacon and L. F. Ma- zadiego, “Sources and Pathways of Trace Elements in Urban Environments a Multi Elemental Qualitative Ap- proach,” The Science of the Total Environment, Vol. 235, No. 1-3, 1990, pp. 355-357. [12] X. Li and L. M. Shuman, “Heavy Metal Movement in Metal Contaminated Soil Profiles,” Soil Science, Vol. 161, No. 10, 1996, pp. 656-666. doi:10.1097/00010694-199610000-00003 [13] W. Fabis, “Schadstoftbelastung von Böden-Auswirkurgen auf Böden-und wasserqalitat AllgFarstzeitsehr,” BLV Ver- laggesellshaft, Munich, 1987, pp. 128-131. [14] M. Yazdi and N. Behzad, “Heavy Metal Contamination and Distribution in the Parks City of Islam Shahr, SW Tehran, Iran,” The Open Environmental Pollution & Toxi- cology Journal, Vol. 1, 2009, pp. 49-53. [15] A. J. Alhassan, M. S. Sule, M. K. Atiku, A. M. Wudil, M. A. Dangambo, J. A. Mashi and N. A. Ibrahim, “Study of Correlation between Heavy Metal Concentration, Street Dust and Level of Traffic in Major Roads of Kano Me- tropolis, Nigeria,” Nigerian Journal of Basic and Applied Science, Vol. 20, No. 2, 2012, pp. 161-168. [16] D. Y. Shinggu, V. O. Ogugbuaja, J. T. Barminas and I. Toma, “Analysis of Street Dust for Heavy Metal Pollut- ants in Mubi, Adamawa State, Nigeria,” International Jour- nal of Physical Sciences, Vol. 2, No. 11, 2007, pp. 290- 293. [17] H. Yongming, D. Peixuan, C. Junji and E. Posmentier, “Multivariate Analysis of Heavy Metal Contamination in Urban Dusts in Xi’an, Central China,” Science of the To- tal Environment, Vol. 355, No. 1-3, 2006, pp. 176-186. doi:10.1016/j.scitotenv.2005.02.026 [18] A. Addo, E. O. Darko, C. Gordon, B. J. B. Nyarko and J. K. Gbadago, “Heavy Metal Concentrations in Road De- posited Dust at Ketu-South District, Ghana,” Interna- tional Journal of Science and Technology, Vol. 2, No. 1, 2012, pp. 28-39. [19] V. Divrikli, M. Soylak, L. Elic and M. Dogan, “Trace Heavy Metal Levels in Street Dust Samples from Yazgat City Center, Turkey,” Proceeding of 5th Scientific Envi- ronmental Conference, Vol. 21, No. 2, 2003, pp. 351-361. [20] S. Charlesworth, M. Everett, R. McCarthy, A. Ordόñez and E. De Miguel, “A Comparative Study of Heavy Metal Contamination and Distribution in Deposited Street Dust in a Large and a Small Urban Area: Birmingham and Coventry, West Midlands, UK,” Environment Interna- tional, Vol. 29, No. 5, 2003, pp. 563-573. doi:10.1016/S0160-4120(03)00015-1 [21] S. M. El-Shayep and M. R. D. Seaward, “Heavy Metal Content of Roadside Soils along Ring Road in Riyadh (Saudi Arabia),” Asian Journal of Chemistry, Vol. 13, No. 2, 2001, pp. 407-423. [22] S. Basha, J. Jhala, R. Thorat, S. Goel, R. Trivedi, K. Shah, G. Menon, P. Gaur, K. H. Mody and B. Jha, “Assessment of Heavy Metal Content in Suspended Particulate Matter of Coastal Industrial Town, Mithapur, Gujarat, India,” At- mospheric Research, Vol. 97, No. 1-2, 2010, pp. 257-265. [23] M. N. Ambulkar, N. L. Chutke, A. N. Aggarwal and A. N. Garg, “Multielemental Analysis of Ambient Air Dust Par- ticulates from a Cement Factory by Neutron Activation,” The Science of the Total Environment, Vol. 141, No. 1-3, 1994, pp. 93-101. doi:10.1016/0048-9697(94)90021-3 [24] K. K. Turekian and K. H. Wedepohl, “Distribution of the Elements in Some Major Units of the Earth’s Crust,” Bul- Copyright © 2013 SciRes. OJMetal  T. BHATTACHARYA ET AL. Copyright © 2013 SciRes. OJMetal 50 letin of Geological Society of America, Vol. 72, No. 2, 1961, pp. 175-192. [25] Agency for Toxic Substances and Disease Registry, “Toxi- cological Profile for Chromium,” US Department of Health and Human Service public Health Service, Atlanta, 2000. |