

Paper Menu >>
Journal Menu >>
 Journal of Modern Physics, 2013, 4, 8-15 http://dx.doi.org/10.4236/jmp.2013.47A2002 Published Online July 2013 (http://www.scirp.org/journal/jmp) Thermal Analysis of Thermophysical Data for Equilibrium Pur e Fluids Boris Sedunov Computer and Information Systems Department, Russian New University (ROSNOU), Moscow, Russia Email: [email protected] Received April 30, 2013; revised June 4, 2013; accepted July 4, 2013 Copyright © 2013 Boris Sedunov. This is an open access article distributed under the Creative Commons Attribution License, which permits unrestricted use, distribution, and reproduction in any medium, provided the original work is properly cited. ABSTRACT The thermal analysis of precise thermophysical data for pure fluids from electronic databases is developed to investigate the molecular interaction mechanisms and parameters and the structural features of heterogeneities in fluids. The method is based on the series expansion of thermophysical values by powers of the monomer fraction density. Unlike the virial expansion by powers of the total density, the series expansion terms in this method directly reflect properties of the corresponding cluster fractions. The internal energy had been selected among thermophysical properties as the most informative for this method. The thermal analysis of its series expansion coefficients permits to estimate the tem- perature dependence of the pair bond parameters, the clusters’ bond energies and equilibrium constants, the structural transitions between dominating isomers of clusters. The application of method to different pure fluids, including noble and molecular gases with van der Waals and polar molecular interactions, brings unknown clusters’ characteristics for the fluids under investigation. The thermal analysis of the ordinary and heavy Water vapors points on no trivial isotopic effects. The unpredictable growth of the pair bond energy with temperature in Alkanes points on existence in hydrocar- bons of some unknown molecular interaction forces in addition to dispersion forces. Keywords: Molecular Interaction; Cluster; Equilibrium Constant; Bond Energy; Structural Transition; Isotopic Effect 1. Introduction In the thermal physics of fluids there are clearly seen two different aspects: The statistical behavior of many particle systems with a supposed universal attraction-repulsion mechanism leading to universal laws, such as the famous van der Waals equation of state or the corresponding states law; The particular features of interactions between mole- cules with their unique quantum structure leading to a diversity of specific for every fluid thermophysical pro- perties and equations of state. The steady growth of the experimental data precision and growing requirements to the fine tuning of techno- logical processes makes now the first aspect rather ex- hausted and explains an enlarged attention to the indi- vidual features of fluids, reflected in modern publications [1]. The investigation of equilibrium molecular interac- tions [2,3] in real gases, liquids and supercritical fluids presents a very complex problem. The energies of mo- lecular interactions are of the same order of magnitude as the energies of thermal movements, therefore, the spec- trum of bound states is not discrete, but rather continuous [4]. For this reason the methods of spectroscopy, being very informative at the chemical bonding investigations, become not so effective as far as the molecular interac- tions in fluids are concerned. So, there is a need in alter- native methods to study molecular interactions in fluids. The investigation of molecular interactions in local equilibrium heterogeneities of fluids is very important for better understanding of the fluids’ structures and for fur- ther improvement of the technological processes. The he- terogeneity of the fluids’ structure [5,6] is very essential and should be taken into consideration for the molecular interactions study because the fluids possess temporarily existing local molecular agglomerations of different struc- tures and sizes: In real gases, in addition to the dominating fraction of monomers [7], there are fractions of dimers, trimers, tetramers and larger clusters [8-12]. The molecular clus- ters are presented in different isomer configurations [13], the number of which grows with the number of particles in the cluster. The clusters in gases are the C opyright © 2013 SciRes. JMP  B. SEDUNOV 9 centers of nucleation [14-16] developing at a super saturation into liquid drops or solid particles [17], like in a fog. In liquids there is a continuous net of molecules with short intermolecular distances, interrupted by point va- cancies [18] and pores of larger dimensions depend- ing on density. The local number of the intermolecu- lar bonds in the net may differ for different mole- cules. The supercritical fluids possess at subcritical densities a fog-like and at supercritical densities a foam-like structure with a superposition of clusters in pores and pores in clusters [19,20]. The local structures in fluids change with time, tem- perature and density; the change of an average density does not lead to a uniform change of intermolecular dis- tances. The fluids’ models based on assumptions of the uniform stretching are not productive for the molecular interactions study. For example, widely used in practice virial expansion of thermophysical values by powers of the fluid density [13,21] silently supposes the uniform distribution of the density in a volume. But the given in thermophysical tables density averages the local densities inherent to heterogeneities and is not a universal variable for all local objects in a fluid. For this reason this type of series expansion cannot lead to a correct picture of the fluid structure. A more adequate variable is needed as ba- sic for the method aimed at the fluids’ structural features and molecular interaction mechanisms and parameters. The goal of this paper is to describe the new method of thermal analysis of the molecular interactions in pure fluids based on the series expansions of precise equilib- rium thermophysical data by powers of the monomer frac- tion density [4,7,22]. This phenomenological approach is capable to open significant details of the microscopic structural features of fluids. 2. The Thermal Analysis of Precise Thermophysical Data for Equilibrium Pure Fluids The bulk of the thermal analysis methods develop their own experimental tools and procedures. But the thermal analysis of thermophysical data, to be discussed here, uti- lizes already existing experimental data. To provide valu- able results we should select as precise data as possible from the state of art level sources. The greatest precision of thermophysical data is now achieved by the generali- zation of experimental results of different research groups from all over the World [23] and by their computer pro- cessing with an account of thermodynamically driven cor- relations between different thermophysical values [24]. These data accumulate collective efforts of researchers during a long period of experimental and analytical in- vestigations. In modern science and technology a large attention is paid to pure fluids, which thermophysical properties can be determined very precisely. The purity of fluids insures the reproducibility of technological processes and leads to a high precision of thermophysical data. For this rea- son our method utilizes precise electronic databases for thermophysical properties of pure fluids. The method can be extended also to mixtures provided the precision of composition and thermophysical data for mixtures stays at the same level as for pure fluids. 2.1. The Source of Experimental Data for New Method of Thermal Analysis Now, due to the joint computer processing of raw experi- mental data from different sources, it is possible to im- prove the resulting precision of the generalized data. This process is named as the critical evaluation of experimen- tal data [24,25]. The web site of the Thermodynamics Research Center (TRC) of the US National Institute of Standards and Technology (NIST) presents this sort of scientific activity as [25]: “Critical evaluation is a process of analyzing all avail- able experimental data for a given property to arrive at recommended values together with estimates of uncer- tainty, providing a highly useful form of thermodynamic data for our customers. The analysis is based on inter- comparisons, interpolation, extrapolation, and correlation of the original experimental data collected at TRC. Data are evaluated for thermodynamic consistency using fun- damental thermodynamic principles, including consisten- cy checks between data and correlations for related pro- perties. While automated as much as possible, this proc- ess is overseen by experts with a great deal of experience in the field of thermodynamic data.” The thermodynamically driven correlations between different thermophysical values are very important. For example, the individual measurements of equilibrium compressibility, heat capacities, sound speed, Joule-Thom- son coefficient and some other thermophysical values in a wide range of pressures and temperatures can be gener- alized in a mutually correlated system of thermophysical properties and presented in a form of an electronic data- base, such as the NIST databases for thermophysical pro- perties of pure fluids [26,27]. All initial data for this work had been taken from the NIST Database: “Thermophy- sical Properties of Fluid Systems” [26]. The extraction of the molecular interaction parameters from thermophysical data is the inverse mathematical problem that suffers from enlarged final errors even at rather small initial errors. So, the regularization of ex- perimental data leading to generalized data with mini- mized errors is obligatory for this type of analysis. Copyright © 2013 SciRes. JMP 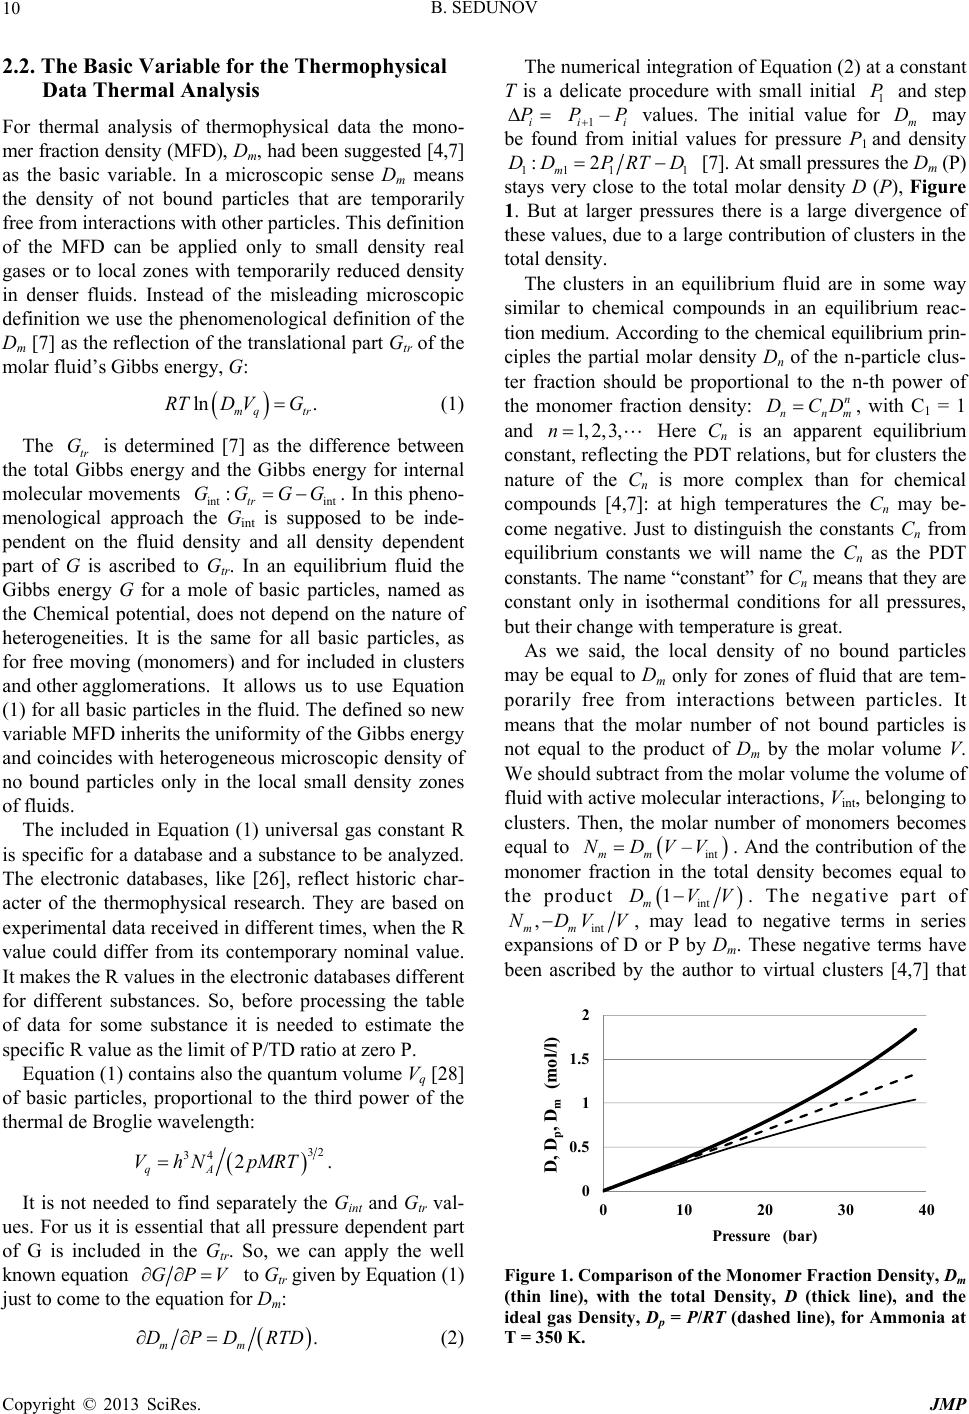 B. SEDUNOV 10 2.2. The Basic Variable for the Thermophysical Data Thermal Analysis For thermal analysis of thermophysical data the mono- mer fraction density (MFD), Dm, had been suggested [4,7] as the basic variable. In a microscopic sense Dm means the density of not bound particles that are temporarily free from interactions with other particles. This definition of the MFD can be applied only to small density real gases or to local zones with temporarily reduced density in denser fluids. Instead of the misleading microscopic definition we use the phenomenological definition of the Dm [7] as the reflection of the translational part Gtr of the molar fluid’s Gibbs energy, G: . mq tr D VG :tr GG GG lnRT G (1) The tr is determined [7] as the difference between the total Gibbs energy and the Gibbs energy for internal molecular movements intint . In this pheno- menological approach the Gint is supposed to be inde- pendent on the fluid density and all density dependent part of G is ascribed to Gtr. In an equilibrium fluid the Gibbs energy G for a mole of basic particles, named as the Chemical potential, does not depend on the nature of heterogeneities. It is the same for all basic particles, as for free moving (monomers) and for included in clusters and other agglomerations. It allows us to use Equation (1) for all basic particles in the fluid. The defined so new variable MFD inherits the uniformity of the Gibbs energy and coincides with heterogeneous microscopic density of no bound particles only in the local small density zones of fluids. The included in Equation (1) universal gas constant R is specific for a database and a substance to be analyzed. The electronic databases, like [26], reflect historic char- acter of the thermophysical research. They are based on experimental data received in different times, when the R value could differ from its contemporary nominal value. It makes the R values in the electronic databases different for different substances. So, before processing the table of data for some substance it is needed to estimate the specific R value as the limit of P/TD ratio at zero P. Equation (1) contains also the quantum volume Vq [28] of basic particles, proportional to the third power of the thermal de Broglie wavelength: 32 34 2.pMRT qA VhN It is not needed to find separately the Gint and Gtr val- ues. For us it is essential that all pressure dependent part of G is included in the Gtr. So, we can apply the well known equation GPV to Gtr given by Equation (1) just to come to the equation for Dm: . (2) mm DPDRTD P P The numerical integration of Equation (2) at a constant T is a delicate procedure with small initial 1 and step i 1 – ii values. The initial value for m may be found from initial values for pressure P1 and density PP D 11 11m :2DD PRTD n DCD 1, 2, 3,n [7]. At small pressures the Dm (P) stays very close to the total molar density D (P), Figure 1. But at larger pressures there is a large divergence of these values, due to a large contribution of clusters in the total density. The clusters in an equilibrium fluid are in some way similar to chemical compounds in an equilibrium reac- tion medium. According to the chemical equilibrium prin- ciples the partial molar density Dn of the n-particle clus- ter fraction should be proportional to the n-th power of the monomer fraction density: nn m , with C1 = 1 and Here Cn is an apparent equilibrium constant, reflecting the PDT relations, but for clusters the nature of the Cn is more complex than for chemical compounds [4,7]: at high temperatures the Cn may be- come negative. Just to distinguish the constants Cn from equilibrium constants we will name the Cn as the PDT constants. The name “constant” for Cn means that they are constant only in isothermal conditions for all pressures, but their change with temperature is great. As we said, the local density of no bound particles may be equal to Dm only for zones of fluid that are tem- porarily free from interactions between particles. It means that the molar number of not bound particles is not equal to the product of Dm by the molar volume V. We should subtract from the molar volume the volume of fluid with active molecular interactions, Vint, belonging to clusters. Then, the molar number of monomers becomes equal to –NDVVintmm . And the contribution of the monomer fraction in the total density becomes equal to the product 1DVVintm. The negative part of intmm ,NDVV , may lead to negative terms in series expansions of D or P by Dm. These negative terms have been ascribed by the author to virtual clusters [4,7] that 0 0.5 1 1.5 2 0 10203040 D, D p , D m (mol/l) Pressure (bar) Figure 1. Comparison of the Monomer Fraction Density, Dm (thin line), with the total Density, D (thick line), and the ideal gas Density, Dp = P/RT (dashed line), for Ammonia at T = 350 K. Copyright © 2013 SciRes. JMP  B. SEDUNOV 11 do not exist physically, but appear in series expansions of P and D by Dm. The total density D and pressure P are the sums of par- tial contributions [4,7]: , n nnm D nCD . n nnm RTCD Dn (3) PRTD (4) The divergence of D and Dm at large pressures, seen at Figure 1, is due to contributions of clusters and ex- plains why the virial expansion by D differs from the series expansion by Dm. 2.3. The Series Expansion of the Potential Energy The isothermal series expansion terms of some thermo- physical value by powers of Dm reflect contributions of corresponding cluster fractions in this thermophysical value. For our thermal analysis method the most infor- mative thermophysical property is the potential energy U, defined phenomenologically as the difference between molar internal energy E at a given pressure P and its value at zero pressure: ,0P ET n nMC D CC ,,UTPET. The defined so potential energy is negative and includes in its pressure dependence the microscopic changes of both potential and kinetic energy [4]. Instead of the molar potential energy U we expand by Dm the positive potential energy density W, equal to –UD. The series expansion of W may be better understood in comparison with the expansion for specific density nm , where M is the molecular mass of basic particles and nM is the cluster’s mass. For W we use in- stead of nM the bond energy En of the n-particle cluster and instead of the Cn, reflecting the PDT relations, the equilibrium constant Cun for potential energy. Unlike the PDT constant Cn, it does not contain the virtual part, be- cause the monomers do not contribute to the potential energy. The equilibrium constant Cun has the same sense as the spectroscopic equilibrium constant Csn. At the domina- tion of only one isomer in the n-particle cluster fraction unsn . In general, it differs from the spectroscopic equilibrium constant due to different mechanics of the cluster isomers’ contribution in energetic and spectro- scopic characteristics. 2.4. The Parameters of Molecular Interactions in Pure Fluids The pair bond energ y, E2. It may be found from the temperature dependence for the second coefficient Ku2 of the W series expansion by Dm. It is the average molar energy of the dimer fraction decomposition to free moving particles. The energy of the dimer bound state is the minimal energy of the pair interaction po- tential plus the kinetic energy of the dimer’s internal molecular movements. This energy may depend not only on the distance between particles, but also on the mutual orientation of particles. This effect is very im- portant for polar gases, but also may influence the pair bonding in the van der Waals gases, even in atomic gases, due to the lack of rotational symmetry of their electronic outer shells. The bond energ y, En, for n-p article cluster fraction. It may be found from the temperature dependence for the n-th coefficient Kun of the W series expansion by Dm. It is the average molar energy of the n-particle cluster fraction decomposition to free moving parti- cles. In the temperature range, where only one isomer dominates, the En value may be close to a constant. But in the temperature range, where two or more isomers may coexist, the En depends on temperature. The equilibrium constant Cun for the n-particle cluster fraction. It may be found by division of the n-order series expansion coefficient Kun for W by the bond energy REn. The spectroscopic method can feel the difference in spectrums of different isomers, there- fore, the equilibrium constant Csn may be split on par- tial isomers’ equilibrium constants, but the Cun is a thermodynamic average for all isomers of the n-par- ticle cluster fraction. The pair attraction zone volume, V2. It may be found by division of the equilibrium constant Cu2 by the Boltzmann factor exp (E2/RT). The cluster attraction zone volume, Vn. Its dimen- sion is equal to 3 (n − 1) and it may be found by divi- sion of the equilibrium constant Cun by the Boltzmann factor exp (En/RT). The pair interaction excluded volume, Vex. It may be found from values for the pair attraction zone vo- lume V2 and the PDT constant C2: 22 2 exp 1 ex VV ERTC. (5) 2.5. The Method of the Cluster Bond Energies En Estimation To estimate the cluster fractions’ bond energies we use the temperature dependencies of series expansion coeffi- cients Kun (T) for the potential energy density W. The ln (Kun) plot versus reverse temperature 1000 T for some temperature ranges may have almost linear parts corresponding to the dominating cluster isomers in the n-particle cluster fraction. Figure 2 shows the depend- ence of the ln (Ku4) for 4-particle cluster fraction in the Methanol vapor from the reverse temperature, 1000/T. It is seen that there are two almost linear parts of the graph Copyright © 2013 SciRes. JMP 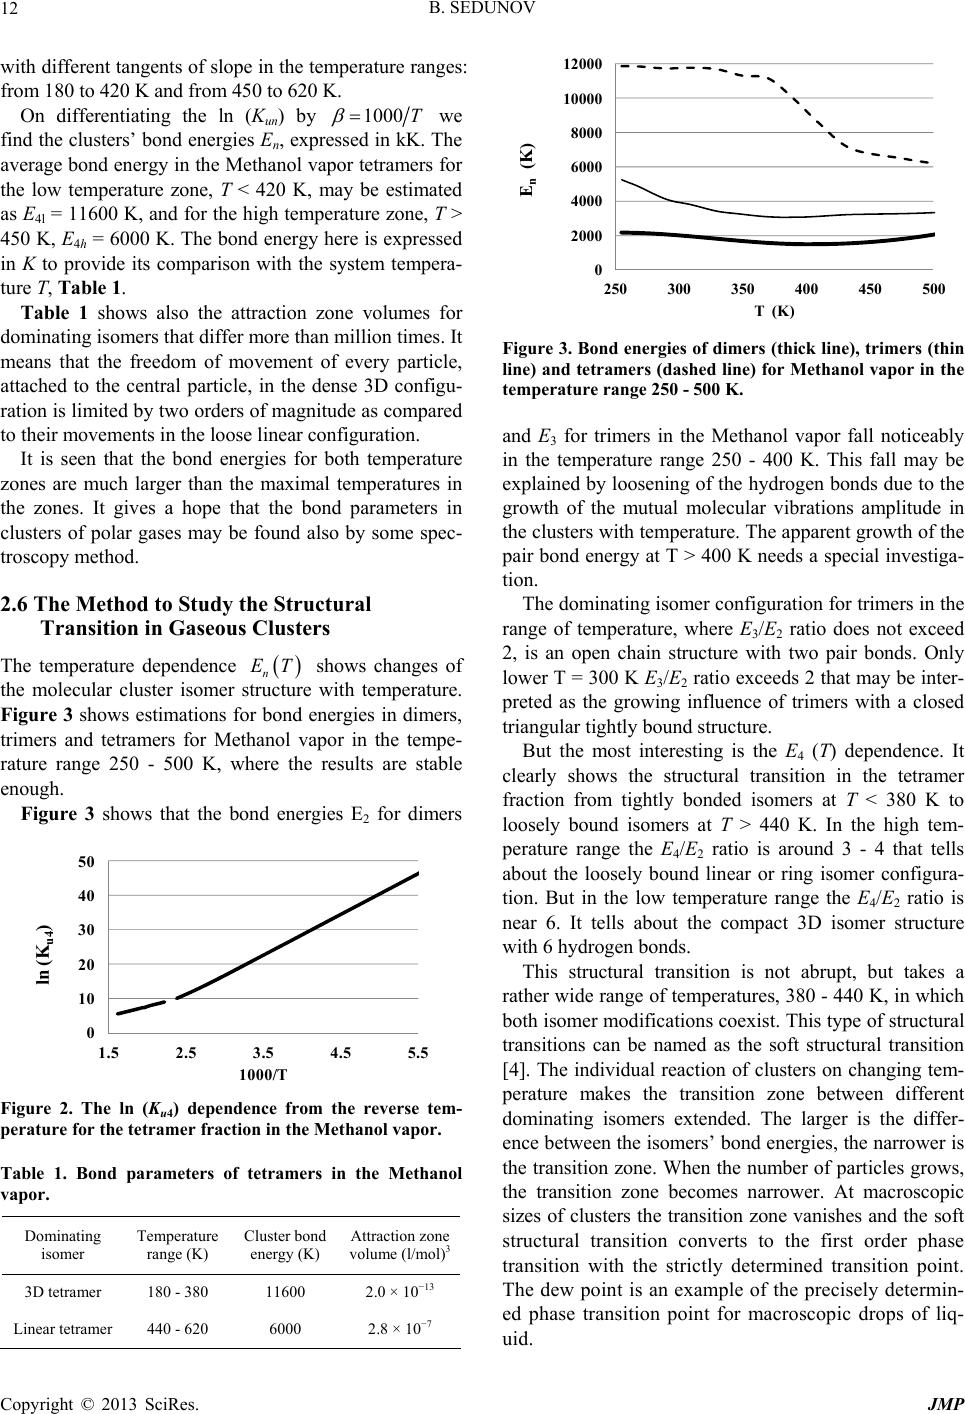 B. SEDUNOV 12 with different tangents of slope in the temperature ranges: from 180 to 420 K and from 450 to 620 K. 0 2000 4000 6000 8000 10000 12000 250 300 350 400 450 500 E n (K) T (K) On differentiating the ln (Kun) by 1000 T ET we find the clusters’ bond energies En, expressed in kK. The average bond energy in the Methanol vapor tetramers for the low temperature zone, T < 420 K, may be estimated as E4l = 11600 K, and for the high temperature zone, T > 450 K, E4h = 6000 K. The bond energy here is expressed in K to provide its comparison with the system tempera- ture T, Table 1. Table 1 shows also the attraction zone volumes for dominating isomers that differ more than million times. It means that the freedom of movement of every particle, attached to the central particle, in the dense 3D configu- ration is limited by two orders of magnitude as compared to their movements in the loose linear configuration. It is seen that the bond energies for both temperature zones are much larger than the maximal temperatures in the zones. It gives a hope that the bond parameters in clusters of polar gases may be found also by some spec- troscopy method. 2.6 The Method to Study the Structural Transition in Gaseous Clusters The temperature dependence n shows changes of the molecular cluster isomer structure with temperature. Figure 3 shows estimations for bond energies in dimers, trimers and tetramers for Methanol vapor in the tempe- rature range 250 - 500 K, where the results are stable enough. Figure 3 shows that the bond energies E2 for dimers 0 10 20 30 40 50 1.5 2.5 3.5 ln (Ku4) 1000/T 4.5 5.5 Figure 2. The ln (Ku4) dependence from the reverse tem- perature for the tetramer fraction in the Methanol vapor. Table 1. Bond parameters of tetramers in the Methanol vapor. Dominating isomer Temperature range (K) Cluster bond energy (K) Attraction zone volume (l/mol)3 3D tetramer 180 - 380 11600 2.0 × 10⁻¹³ Linear tetramer 440 - 620 6000 2.8 × 10⁻⁷ Figure 3. Bond energies of dimers (thick line), trimers (thin line) and tetramers (dashe d line) for Methanol vapor in the temperature range 250 - 500 K. and E3 for trimers in the Methanol vapor fall noticeably in the temperature range 250 - 400 K. This fall may be explained by loosening of the hydrogen bonds due to the growth of the mutual molecular vibrations amplitude in the clusters with temperature. The apparent growth of the pair bond energy at T > 400 K needs a special investiga- tion. The dominating isomer configuration for trimers in the range of temperature, where E3/E2 ratio does not exceed 2, is an open chain structure with two pair bonds. Only lower T = 300 K E3/E2 ratio exceeds 2 that may be inter- preted as the growing influence of trimers with a closed triangular tightly bound structure. But the most interesting is the E4 (T) dependence. It clearly shows the structural transition in the tetramer fraction from tightly bonded isomers at T < 380 K to loosely bound isomers at T > 440 K. In the high tem- perature range the E4/E2 ratio is around 3 - 4 that tells about the loosely bound linear or ring isomer configura- tion. But in the low temperature range the E4/E2 ratio is near 6. It tells about the compact 3D isomer structure with 6 hydrogen bonds. This structural transition is not abrupt, but takes a rather wide range of temperatures, 380 - 440 K, in which both isomer modifications coexist. This type of structural transitions can be named as the soft structural transition [4]. The individual reaction of clusters on changing tem- perature makes the transition zone between different dominating isomers extended. The larger is the differ- ence between the isomers’ bond energies, the narrower is the transition zone. When the number of particles grows, the transition zone becomes narrower. At macroscopic sizes of clusters the transition zone vanishes and the soft structural transition converts to the first order phase transition with the strictly determined transition point. The dew point is an example of the precisely determin- ed phase transition point for macroscopic drops of liq- uid. Copyright © 2013 SciRes. JMP 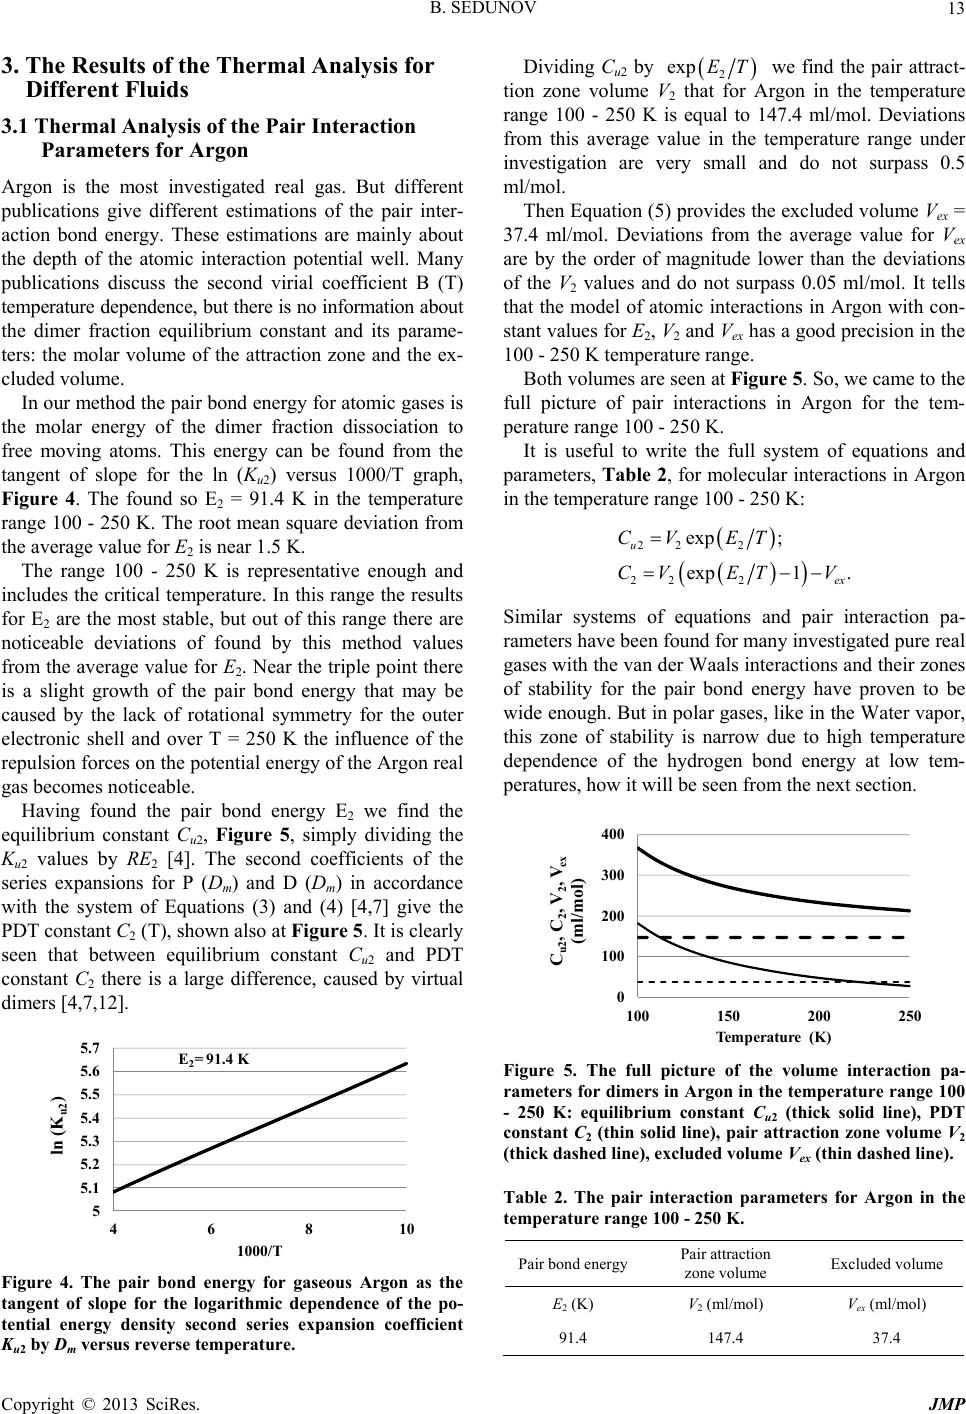 B. SEDUNOV 13 3. The Results of the Thermal Analysis for Different Fluids 3.1 Thermal Analysis of the Pair Interaction Parameters for Argon Argon is the most investigated real gas. But different publications give different estimations of the pair inter- action bond energy. These estimations are mainly about the depth of the atomic interaction potential well. Many publications discuss the second virial coefficient B (T) temperature dependence, but there is no information about the dimer fraction equilibrium constant and its parame- ters: the molar volume of the attraction zone and the ex- cluded volume. In our method the pair bond energy for atomic gases is the molar energy of the dimer fraction dissociation to free moving atoms. This energy can be found from the tangent of slope for the ln (Ku2) versus 1000/T graph, Figure 4. The found so E2 = 91.4 K in the temperature range 100 - 250 K. The root mean square deviation from the average value for E2 is near 1.5 K. The range 100 - 250 K is representative enough and includes the critical temperature. In this range the results for E2 are the most stable, but out of this range there are noticeable deviations of found by this method values from the average value for E2. Near the triple point there is a slight growth of the pair bond energy that may be caused by the lack of rotational symmetry for the outer electronic shell and over T = 250 K the influence of the repulsion forces on the potential energy of the Argon real gas becomes noticeable. Having found the pair bond energy E2 we find the equilibrium constant Cu2, Figure 5, simply dividing the Ku2 values by RE2 [4]. The second coefficients of the series expansions for P (Dm) and D (Dm) in accordance with the system of Equations (3) and (4) [4,7] give the PDT constant C2 (T), shown also at Figure 5. It is clearly seen that between equilibrium constant Cu2 and PDT constant C2 there is a large difference, caused by virtual dimers [4,7,12]. E 2 = 91.4 K 5 5.1 5.2 5.3 5.4 5.5 5.6 46 ln (K u2 ) 1000/T 5.7 810 Figure 4. The pair bond energy for gaseous Argon as the tangent of slope for the logarithmic dependence of the po- tential energy density second series expansion coefficient Ku2 by Dm versus reverse temperature. Dividing Cu2 by exp ET 2 we find the pair attract- tion zone volume V2 that for Argon in the temperature range 100 - 250 K is equal to 147.4 ml/mol. Deviations from this average value in the temperature range under investigation are very small and do not surpass 0.5 ml/mol. Then Equation (5) provides the excluded volume Vex = 37.4 ml/mol. Deviations from the average value for Vex are by the order of magnitude lower than the deviations of the V2 values and do not surpass 0.05 ml/mol. It tells that the model of atomic interactions in Argon with con- stant values for E2, V2 and Vex has a good precision in the 100 - 250 K temperature range. Both volumes are seen at Figure 5. So, we came to the full picture of pair interactions in Argon for the tem- perature range 100 - 250 K. It is useful to write the full system of equations and parameters, Table 2, for molecular interactions in Argon in the temperature range 100 - 250 K: 222 22 2 exp ; exp1 . u ex CV ET CV ET V Similar systems of equations and pair interaction pa- rameters have been found for many investigated pure real gases with the van der Waals interactions and their zones of stability for the pair bond energy have proven to be wide enough. But in polar gases, like in the Water vapor, this zone of stability is narrow due to high temperature dependence of the hydrogen bond energy at low tem- peratures, how it will be seen from the next section. 0 100 200 300 400 100 150 200 250 C u2 , C 2 , V 2 , V ex (ml/mol) Temp era ture ( K) Figure 5. The full picture of the volume interaction pa- rameters for dimers in Argon in the temperature range 100 - 250 K: equilibrium constant Cu2 (thick solid line), PDT constant C2 (thin solid line), pair attraction zone volume V2 (thick dashed line), excluded volume Vex (thin dashed line). Table 2. The pair interaction parameters for Argon in the temperature range 100 - 250 K. Pair bond energyPair attraction zone volume Excluded volume E2 (K) V2 (ml/mol) Vex (ml/mol) 91.4 147.4 37.4 Copyright © 2013 SciRes. JMP 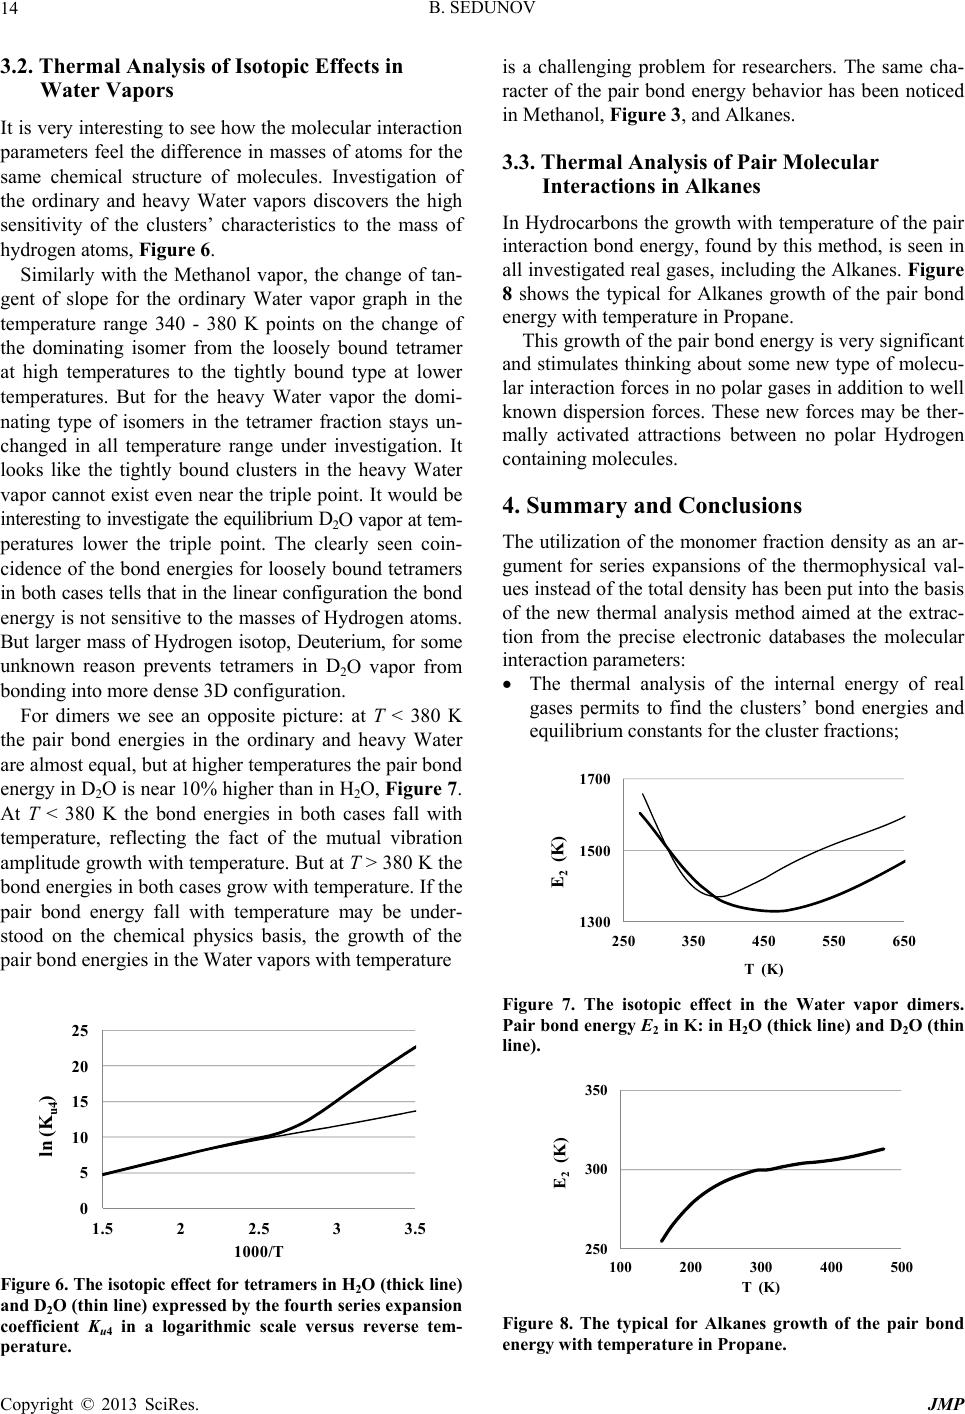 B. SEDUNOV 14 3.2. Thermal Analysis of Isotopic Effects in Water Vapors It is very interesting to see how the molecular interaction parameters feel the difference in masses of atoms for the same chemical structure of molecules. Investigation of the ordinary and heavy Water vapors discovers the high sensitivity of the clusters’ characteristics to the mass of hydrogen atoms, Figure 6. Similarly with the Methanol vapor, the change of tan- gent of slope for the ordinary Water vapor graph in the temperature range 340 - 380 K points on the change of the dominating isomer from the loosely bound tetramer at high temperatures to the tightly bound type at lower temperatures. But for the heavy Water vapor the domi- nating type of isomers in the tetramer fraction stays un- changed in all temperature range under investigation. It looks like the tightly bound clusters in the heavy Water vapor cannot exist even near the triple point. It would be interesting to investigate the equilibrium D2O vapor at tem- peratures lower the triple point. The clearly seen coin- cidence of the bond energies for loosely bound tetramers in both cases tells that in the linear configuration the bond energy is not sensitive to the masses of Hydrogen atoms. But larger mass of Hydrogen isotop, Deuterium, for some unknown reason prevents tetramers in D2O vapor from bonding into more dense 3D configuration. For dimers we see an opposite picture: at T < 380 K the pair bond energies in the ordinary and heavy Water are almost equal, but at higher temperatures the pair bond energy in D2O is near 10% higher than in H2O, Figure 7. At T < 380 K the bond energies in both cases fall with temperature, reflecting the fact of the mutual vibration amplitude growth with temperature. But at T > 380 K the bond energies in both cases grow with temperature. If the pair bond energy fall with temperature may be under- stood on the chemical physics basis, the growth of the pair bond energies in the Water vapors with temperature 0 5 10 15 20 1.5 2 2.5 ln (K u4 ) 1000/T 25 3 3.5 Figure 6. The isotopic effect for tetramers in H2O (thick line) and D2O (thin line) expressed by the fourth series expansion coefficient Ku4 in a logarithmic scale versus reverse tem- perature. is a challenging problem for researchers. The same cha- racter of the pair bond energy behavior has been noticed in Methanol, Figure 3, and Alkanes. 3.3. Thermal Analysis of Pair Molecular Interactions in Alkanes In Hydrocarbons the growth with temperature of the pair interaction bond energy, found by this method, is seen in all investigated real gases, including the Alkanes. Figure 8 shows the typical for Alkanes growth of the pair bond energy with temperature in Propane. This growth of the pair bond energy is very significant and stimulates thinking about some new type of molecu- lar interaction forces in no polar gases in addition to well known dispersion forces. These new forces may be ther- mally activated attractions between no polar Hydrogen containing molecules. 4. Summary and Conclusions The utilization of the monomer fraction density as an ar- gument for series expansions of the thermophysical val- ues instead of the total density has been put into the basis of the new thermal analysis method aimed at the extrac- tion from the precise electronic databases the molecular interaction parameters: The thermal analysis of the internal energy of real gases permits to find the clusters’ bond energies and equilibrium constants for the cluster fractions; 1300 1500 1700 250 350 450 550 650 E 2 (K) T (K) Figure 7. The isotopic effect in the Water vapor dimers. Pair bond energy E2 in K: in H2O (thick line) and D2O (thin line). 250 300 350 100 200 300 400 500 E2(K) T (K) Figure 8. The typical for Alkanes growth of the pair bond energy with temperature in Prop ane. Copyright © 2013 SciRes. JMP 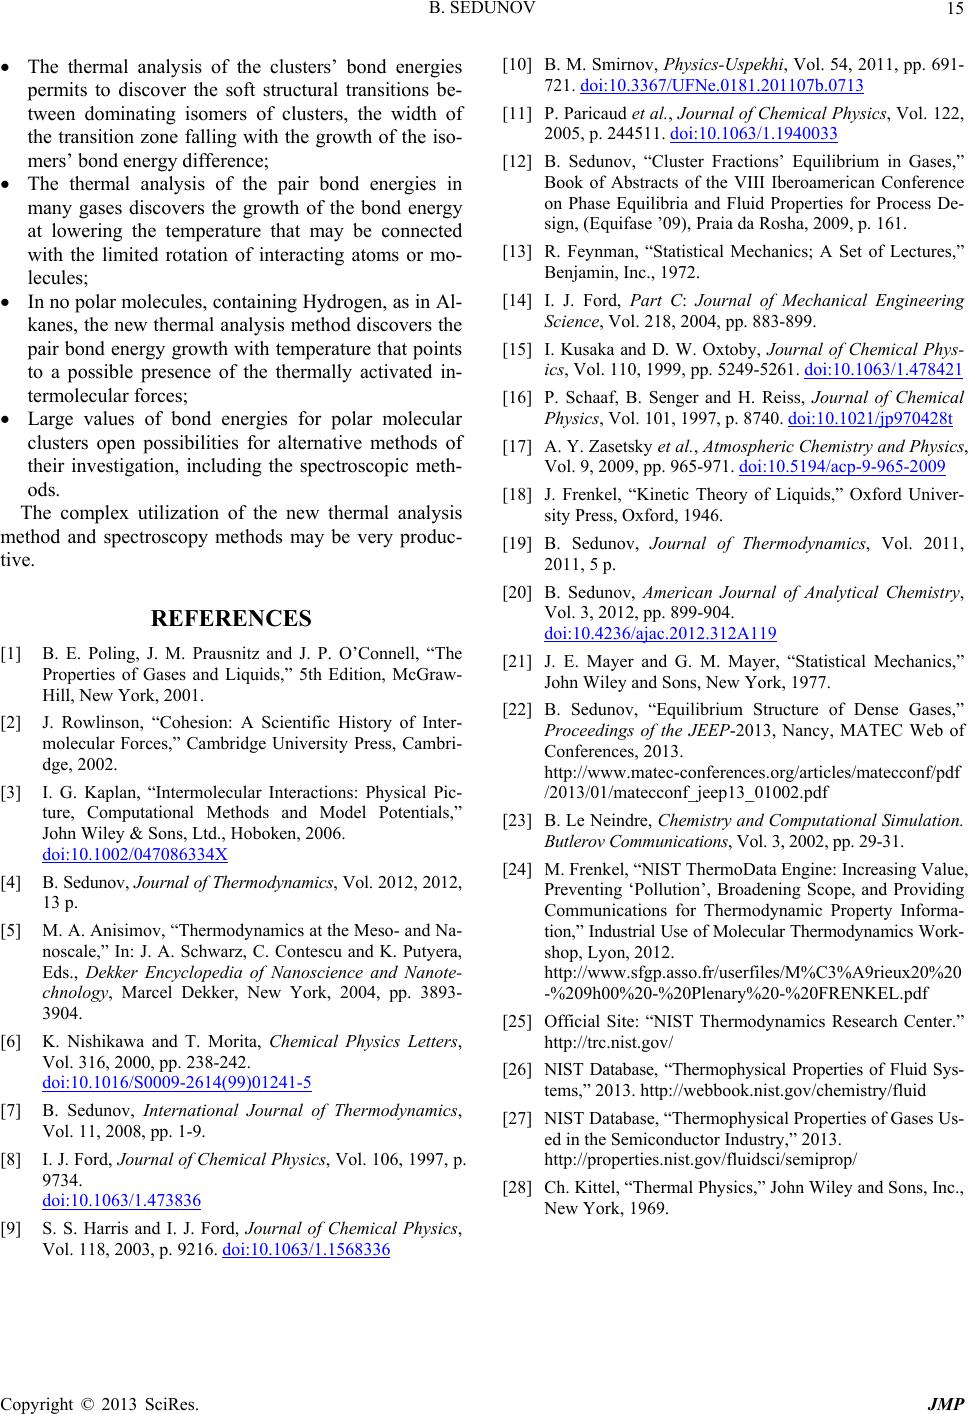 B. SEDUNOV Copyright © 2013 SciRes. JMP 15 The thermal analysis of the clusters’ bond energies permits to discover the soft structural transitions be- tween dominating isomers of clusters, the width of the transition zone falling with the growth of the iso- mers’ bond energy difference; The thermal analysis of the pair bond energies in many gases discovers the growth of the bond energy at lowering the temperature that may be connected with the limited rotation of interacting atoms or mo- lecules; In no polar molecules, containing Hydrogen, as in Al- kanes, the new thermal analysis method discovers the pair bond energy growth with temperature that points to a possible presence of the thermally activated in- termolecular forces; Large values of bond energies for polar molecular clusters open possibilities for alternative methods of their investigation, including the spectroscopic meth- ods. The complex utilization of the new thermal analysis method and spectroscopy methods may be very produc- tive. REFERENCES [1] B. E. Poling, J. M. Prausnitz and J. P. O’Connell, “The Properties of Gases and Liquids,” 5th Edition, McGraw- Hill, New York, 2001. [2] J. Rowlinson, “Cohesion: A Scientific History of Inter- molecular Forces,” Cambridge University Press, Cambri- dge, 2002. [3] I. G. Kaplan, “Intermolecular Interactions: Physical Pic- ture, Computational Methods and Model Potentials,” John Wiley & Sons, Ltd., Hoboken, 2006. doi:10.1002/047086334X [4] B. Sedunov, Journal of Thermodynamic s, Vol. 2012, 2012, 13 p. [5] M. A. Anisimov, “Thermodynamics at the Meso- and Na- noscale,” In: J. A. Schwarz, C. Contescu and K. Putyera, Eds., Dekker Encyclopedia of Nanoscience and Nanote- chnology, Marcel Dekker, New York, 2004, pp. 3893- 3904. [6] K. Nishikawa and T. Morita, Chemical Physics Letters, Vol. 316, 2000, pp. 238-242. doi:10.1016/S0009-2614(99)01241-5 [7] B. Sedunov, International Journal of Thermodynamics, Vol. 11, 2008, pp. 1-9. [8] I. J. Ford, Journal of Chemical Physics, Vol. 106, 1997, p. 9734. doi:10.1063/1.473836 [9] S. S. Harris and I. J. Ford, Journal of Chemical Physics, Vol. 118, 2003, p. 9216. doi:10.1063/1.1568336 [10] B. M. Smirnov, Physics-Uspekhi, Vol. 54, 2011, pp. 691- 721. doi:10.3367/UFNe.0181.201107b.0713 [11] P. Paricaud et al. , Journal of Chemical Physics, Vol. 122, 2005, p. 244511. doi:10.1063/1.1940033 [12] B. Sedunov, “Cluster Fractions’ Equilibrium in Gases,” Book of Abstracts of the VIII Iberoamerican Conference on Phase Equilibria and Fluid Properties for Process De- sign, (Equifase ’09), Praia da Rosha, 2009, p. 161. [13] R. Feynman, “Statistical Mechanics; A Set of Lectures,” Benjamin, Inc., 1972. [14] I. J. Ford, Part C: Journal of Mechanical Engineering Science, Vol. 218, 2004, pp. 883-899. [15] I. Kusaka and D. W. Oxtoby, Journal of Chemical Phys- ics, Vol. 110, 1999, pp. 5249-5261. doi:10.1063/1.478421 [16] P. Schaaf, B. Senger and H. Reiss, Journal of Chemical Physics, Vol. 101, 1997, p. 8740. doi:10.1021/jp970428t [17] A. Y. Zasetsky et al., Atmospheric Chemistry and Physics, Vol. 9, 2009, pp. 965-971. doi:10.5194/acp-9-965-2009 [18] J. Frenkel, “Kinetic Theory of Liquids,” Oxford Univer- sity Press, Oxford, 1946. [19] B. Sedunov, Journal of Thermodynamics, Vol. 2011, 2011, 5 p. [20] B. Sedunov, American Journal of Analytical Chemistry, Vol. 3, 2012, pp. 899-904. doi:10.4236/ajac.2012.312A119 [21] J. E. Mayer and G. M. Mayer, “Statistical Mechanics,” John Wiley and Sons, New York, 1977. [22] B. Sedunov, “Equilibrium Structure of Dense Gases,” Proceedings of the JEEP-2013, Nancy, MATEC Web of Conferences, 2013. http://www.matec-conferences.org/articles/matecconf/pdf /2013/01/matecconf_jeep13_01002.pdf [23] B. Le Neindre, Chemistry and Computational Simulation. Butlerov Communications, Vol. 3, 2002, pp. 29-31. [24] M. Frenkel, “NIST ThermoData Engine: Increasing Value, Preventing ‘Pollution’, Broadening Scope, and Providing Communications for Thermodynamic Property Informa- tion,” Industrial Use of Molecular Thermodynamics Work- shop, Lyon, 2012. http://www.sfgp.asso.fr/userfiles/M%C3%A9rieux20%20 -%209h00%20-%20Plenary%20-%20FRENKEL.pdf [25] Official Site: “NIST Thermodynamics Research Center.” http://trc.nist.gov/ [26] NIST Database, “Thermophysical Properties of Fluid Sys- tems,” 2013. http://webbook.nist.gov/chemistry/fluid [27] NIST Database, “Thermophysical Properties of Gases Us- ed in the Semiconductor Industry,” 2013. http://properties.nist.gov/fluidsci/semiprop/ [28] Ch. Kittel, “Thermal Physics,” John Wiley and Sons, Inc., New York, 1969. |