

Paper Menu >>
Journal Menu >>
 Vol.2, No.12, 1425-1431 (2010) doi:10.4236/ns.2010.212174 Copyright © 2010 SciRes. Openly accessible at http:// www.scirp.org/journal/NS/ Natural Science Application of random walk model to fit temperature in 46 gamma world cities from 1901 to 1998 Shaomin Yan1, Guang Wu1,2* 1State Key Laboratory of Non-food Biomass Enzyme Technology, National Engineering Research Center for Non-food Biorefinery, Guangxi Key Laboratory of Biorefinery, Guangxi Academy of Sciences, Nanning, China 2DreamSciTech Consulting, Shenzhen, China; *Corresp onding Author: [email protected] Received 2 October 2010; revised 3 November 2010; accepted 6 November 2010. ABSTRACT Very recently, we have applied the random walk model to fit the global temperature anomaly, CRUTEM3. With encouraging results, we apply the random walk model to fit the temperature walk that is the conversion of recorded tem- perature and real recorded temperature in 46 gamma world cities from 1901 to 1998 in this study. The results show that the random walk model can fit both temperature walk and real recorded temperature although the fitted results from other climate models are unavailable for comparison in these 46 cities. Therefore, the random walk model can fit not only the global temperature anomaly, but also the real recorded temperatures in various cities around the world. Keywords: Gamma World Cities; Global W ar mi ng ; Modeling; Random Walk; Tempe ratu re Cha ng e 1. INTRODUCTION During our recen t studies on the potential influen ce of global warming on the evolution of proteins from influ- enza A virus [1-5], we noticed that the temperature fluc- tuates around the temperature trend. On the one hand, these fluctuations can be easily attributed to random ef- fects; on the other hand, these fluctuations might imply that we might need a random model to describe the temperature pattern because the output of any determi- nistic model is generally a smooth curve. Without smooth temperature trend, the temperature behaves irregularly either to increase or to decrease for some period of time, from where we could not find out a clear pattern in temperature change along the time course. The irregular ups and downs appear similar to the random walk, which firstly came into our mind. The random walk comes from the observation of tossing a single coin: although theoretically each side of coin has 0.5 chances to be up or down, the tossing of coin se- quentially results in either head up or tail up for several times continuously rather than each tossing generates alternative result. The addition of sequentially tossed results would be a random walk [6]. Computationally each tossing of coin can be done with the generation of random numbers, which can be classified as 1 or –1 if a random number is larger or smaller than its previous one. As the generation of random numbers is through the Monte-Carlo simulation with different seeds, thus the random walk is a model with its own model parameter, seed. Therefore, we can consider the random walk model as alternative model to fit the temperature because it can produce a really fluctuated curve. Following that, we applied the random walk model to fit the global tem- perature anomaly, CRUTEM3, and got a very encourag- ing result [7]. Since then, an intensive literature search indicates that Gordon noticed the similarity between global warming and random walk in 1991 [8]. Likely, the random walk could provide an alternative model to describe the temperature, however, two ques- tions raised here are whether the random walk model can be applied only to the global temperature anomaly not to local temperature and whether the random walk model can be applied only to the anomaly n o t to really reco rd ed temperature. In order to answer these questions, we need to use the random walk model to fit the real recorded temperature in different places around the world. In this study, we apply the random walk model to fit the temperature in 46 gamma world cities from 1901 to 1998. 2. MATERIALS AND METHODS 2.1. Data Forty-six gamma world cities are chosen according to  S. M. Yan et al. / Natural Science 2 (2010) 1425-1431 Copyright © 2010 SciRes. Openly accessible at http:// www.scirp.org/journal/NS/ 1426 Wikipedia [9]. However, the number of these cities and their order are changed frequently due to the characteris- tics of Wikipedia, thus the cities were dated in February, 2010. The temperatures recorded in these 46 cities from 1901 to 1998 based on 0.5˚ by 0.5˚ latitude and longi- tude grid-box basis cross globe are obtained from the website of Oak Ridge National Laboratory [10]. The latitudes an d longitudes of these 46 gamma world cities are determined using Get Lat Lon [11]. 2.2. Temperature Walk At first, we use the simplest random walk model, which starts at zero and at each step moves by ±1 with equal probability [6]. In other words, the simplest ran- dom walk can be considered as a sequential result of tossing a fair coin, by wh ich we record the head as 1 and the tail as –1, and then we add th e results along the time course. For this purpose, we need to convert the temperature into the temperature walk as shown in Table 1. When the temperature at certain year is higher than its previous one, we classify it as 1, otherwise we classify it as –1, and then we add them as the random walk does. 2.3. Generation of Random Walk We use the SigmaPlot [12] to generate random se- quence for the random walk. Technically, the generation of random walk is quite simple: we generate random number either ranged from –1 to 1 or without limit, and then we classify a generated random number as 1 if it is larger than its previous one and as –1 if it is s maller than its previous one. Thereafter we add these values as a random walk. 2.4. Searching for Seed To find a random walk that is very approximate to the temperature walk is to find a seed that can generate such a random walk. To the best of our knowledge, there is no algorithm for searching seeds by converging the differ- ence between observed curve and the curve produced by random walk. Therefore the so-called fitting, which tra- ditionally searches the optimum according to various algorithms, becomes to search all possible seeds in order to find out the seed that produces the random walk with the least squares between random walk and temperature walk. 2.5. Fitting Recorded Temperature Thereafter, we use a more complicated random walk model [13] to fit the recorded temperature, which is in decimal format. In plain words, the simplest random walk comes from tossing of double-sided coin, while this random walk can be regarded as tossing of dice, which cannot be only six-sided but as many as the deci- mal data. In such a way, we generate random numbers, and add them to construct the random temperature, and the fitting is again to search the best seed that generates the best fit. 2.6. Comparison We use the least squares between temperature walk and random walk, and between recorded temperature and random temperature to evaluate which seed is the best. 3. RESULTS AND DIS CUSSION Ta b l e 1 shows how we construct a temperature walk in Panama City. Its recorded temperature in 1901 was 18.8250 (cell 2, column 2), which corresponds to the starting point of temperature walk, 0, (cell 2, column 4). The temperature in 1902 was 19.825 0 (cell 3, co lumn 2), which was higher than the temperature in 1901, 18.8250, thus the temperature step was 1 (cell 3, column 3), and the temperature walk is 1 (0 + 1) (cell 3, column 4). In this manner, we construct the temperature walk from 1901 to 1998. Similarly, Table 1 also shows how we construct a random walk with generated random numbers. A good seed that we found is 0.48531. The f irst random number generated by this seed was 0.2629 (cell 2, column 5), which corresponds to the starting point of random walk, 0, (cell 2, column 7). The second random number gener- ated was 0.8817 (cell 3, column 5), which is larger than the first random number, 0.2629 (cell 2, column 5). Thus the random step was 1 (cell 3, column 6), and the ran- dom walk is 1 (0 + 1) (cell 3, column 7). The last column (column 8) in Table 1 is the differ- ence between temperature walk and random walk (ran- dom walk-temperature walk), whose squared sum is our standard to find the best fit among seeds. Figure 1 shows the fitted results in 12 cities repre- sented differently geographic locations around the world. As can be seen, the random walk (gray curve) mimicked the temperature walk (black curve) with very small dif- ference. Theoretically, a completely perfect fit would have an extremely s mall probab ility. In the simplest case of random walk, this probability would be (1/2)98. Meanwhile, the total number of our fittings were one million, which is a fraction of (1/2)98. Thus the fact that we can find a relatively good fit within one million fit- tings suggests that the random walk can describe the temperature pattern from 1901 to 1998 in these cities. 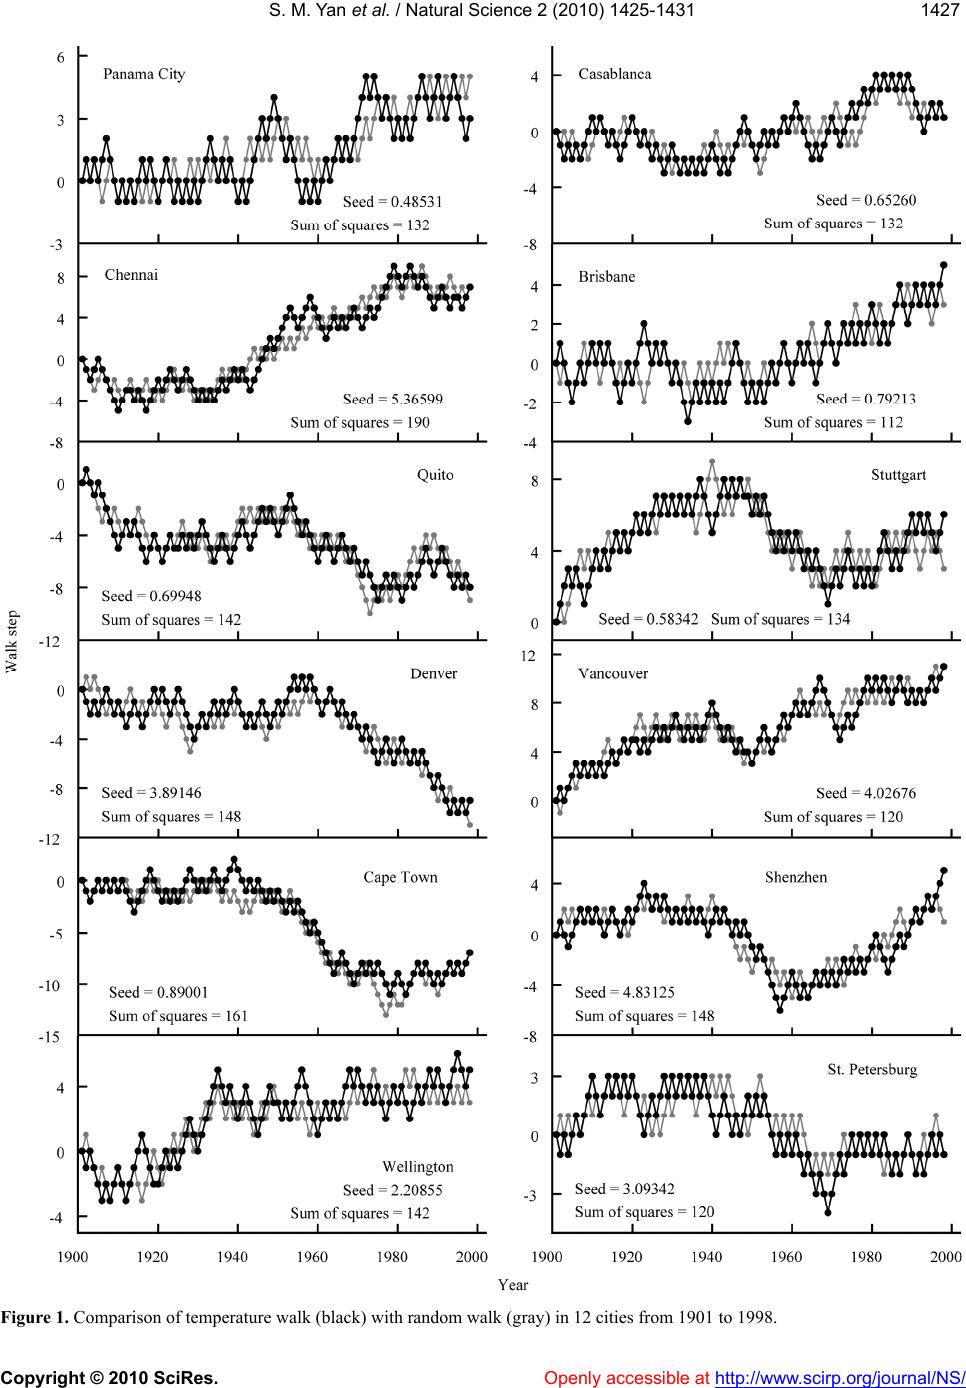 S. M. Yan et al. / Natural Science 2 (2010) 1425-1431 Copyright © 2010 SciRes. http://www.scirp.org/journal/NS/ 142 1427 Figure 1. Comparison of temperature walk (black) with random walk (gray) in 12 cities from 1901 to 1998. Openly accessible at 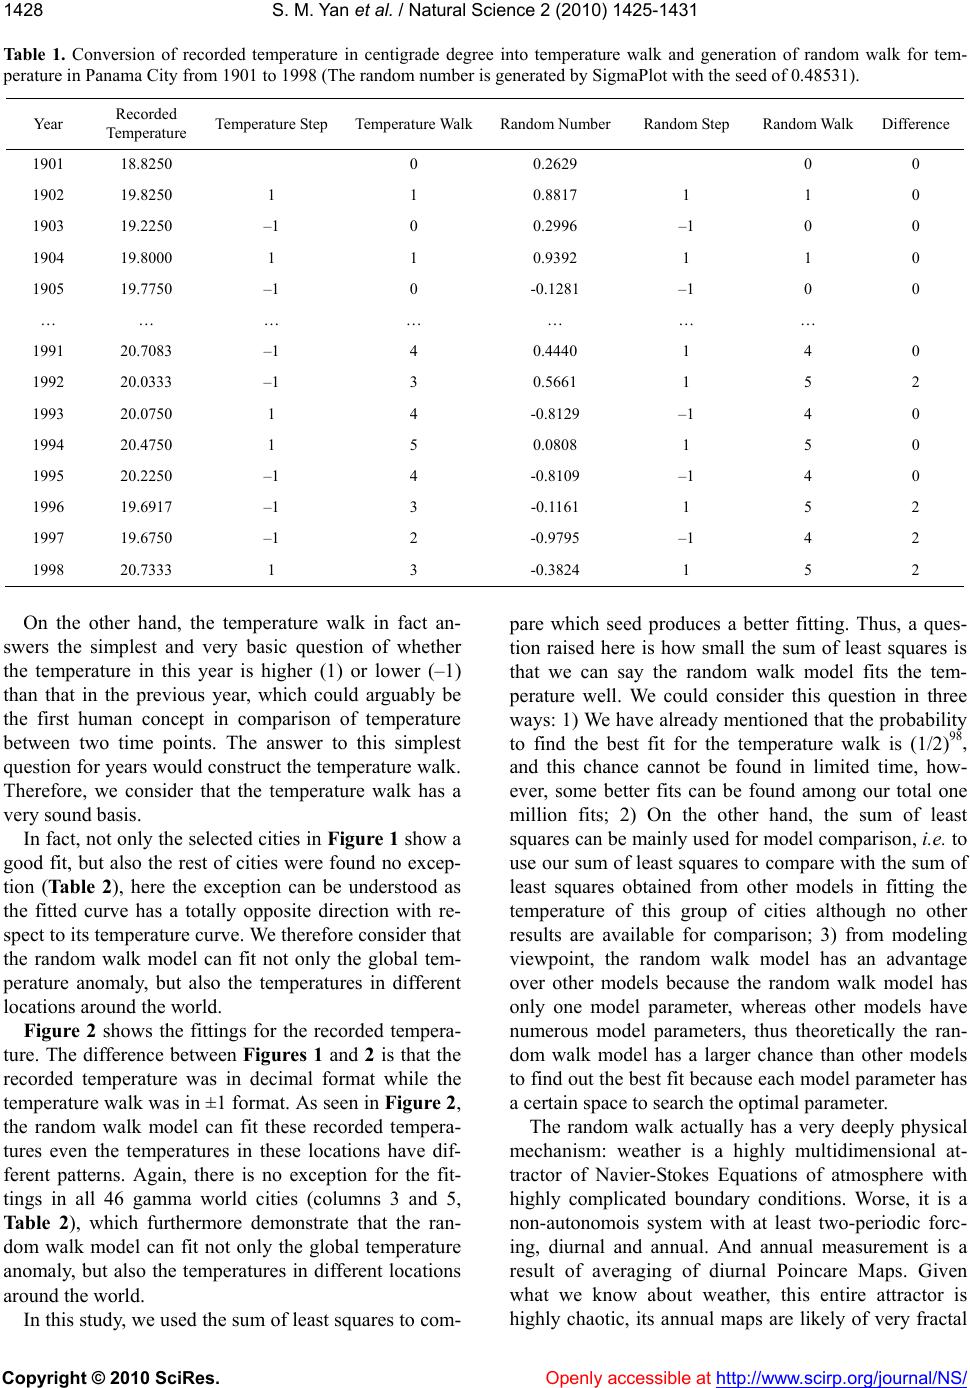 S. M. Yan et al. / Natural Science 2 (2010) 1425-1431 Copyright © 2010 SciRes. Openly accessible at http:// www.scirp.org/journal/NS/ 1428 Ta ble 1 . Conversion of recorded temperature in centigrade degree into temperature walk and generation of random walk for tem- perature in Panama City from 1901 to 1998 (The random number is generated by SigmaPlot with the seed of 0.48531). Year Recorded Temperature Temperature Step Temperature WalkRandom NumberRandom Step Random Walk Difference 1901 18.8250 0 0.2629 0 0 1902 19.8250 1 1 0.8817 1 1 0 1903 19.2250 –1 0 0.2996 –1 0 0 1904 19.8000 1 1 0.9392 1 1 0 1905 19.7750 –1 0 -0.1281 –1 0 0 … … … … … … … 1991 20.7083 –1 4 0.4440 1 4 0 1992 20.0333 –1 3 0.5661 1 5 2 1993 20.0750 1 4 -0.8129 –1 4 0 1994 20.4750 1 5 0.0808 1 5 0 1995 20.2250 –1 4 -0.8109 –1 4 0 1996 19.6917 –1 3 -0.1161 1 5 2 1997 19.6750 –1 2 -0.9795 –1 4 2 1998 20.7333 1 3 -0.3824 1 5 2 On the other hand, the temperature walk in fact an- swers the simplest and very basic question of whether the temperature in this year is higher (1) or lower (–1) than that in the previous year, which could arguably be the first human concept in comparison of temperature between two time points. The answer to this simplest question for years would construc t the temperature walk. Therefore, we consider that the temperature walk has a very sound basis. In fact, not only the selected cities in Figure 1 show a good fit, but also the rest of cities were found no excep- tion (Ta b le 2), here the exception can be understood as the fitted curve has a totally opposite direction with re- spect to its temperature curve. We therefore consider that the random walk model can fit not only the global tem- perature anomaly, but also the temperatures in different locations around th e world. Figure 2 shows the fittings for the recorded tempera- ture. The difference between Figures 1 and 2 is that the recorded temperature was in decimal format while the temperature walk was in ±1 format. As seen in Figure 2, the random walk model can fit these recorded tempera- tures even the temperatures in these locations have dif- ferent patterns. Again, there is no exception for the fit- tings in all 46 gamma world cities (columns 3 and 5, Table 2), which furthermore demonstrate that the ran- dom walk model can fit not only the global temperature anomaly, but also the temperatures in different locations around the world. In this study, we u sed the su m of least squares to com- pare which seed produces a better fitting. Thus, a ques- tion raised here is how small the sum of least squares is that we can say the random walk model fits the tem- perature well. We could consider this question in three ways: 1) We have already mentioned that the p robability to find the best fit for the temperature walk is (1/2)98, and this chance cannot be found in limited time, how- ever, some better fits can be found among our total one million fits; 2) On the other hand, the sum of least squares can be mainly used for model comparison, i.e. to use our sum of least squares to compare with the sum of least squares obtained from other models in fitting the temperature of this group of cities although no other results are available for comparison; 3) from modeling viewpoint, the random walk model has an advantage over other models because the random walk model has only one model parameter, whereas other models have numerous model parameters, thus theoretically the ran- dom walk model has a larger chance than other models to find out the best fit because each model parameter has a certain space to search the optimal parameter. The random walk actually has a very deeply physical mechanism: weather is a highly multidimensional at- tractor of Navier-Stokes Equations of atmosphere with highly complicated boundary conditions. Worse, it is a non-autonomois system with at least two-periodic forc- ing, diurnal and annual. And annual measurement is a result of averaging of diurnal Poincare Maps. Given what we know about weather, this entire attractor is highly chaotic, its annual maps are likely of very fractal 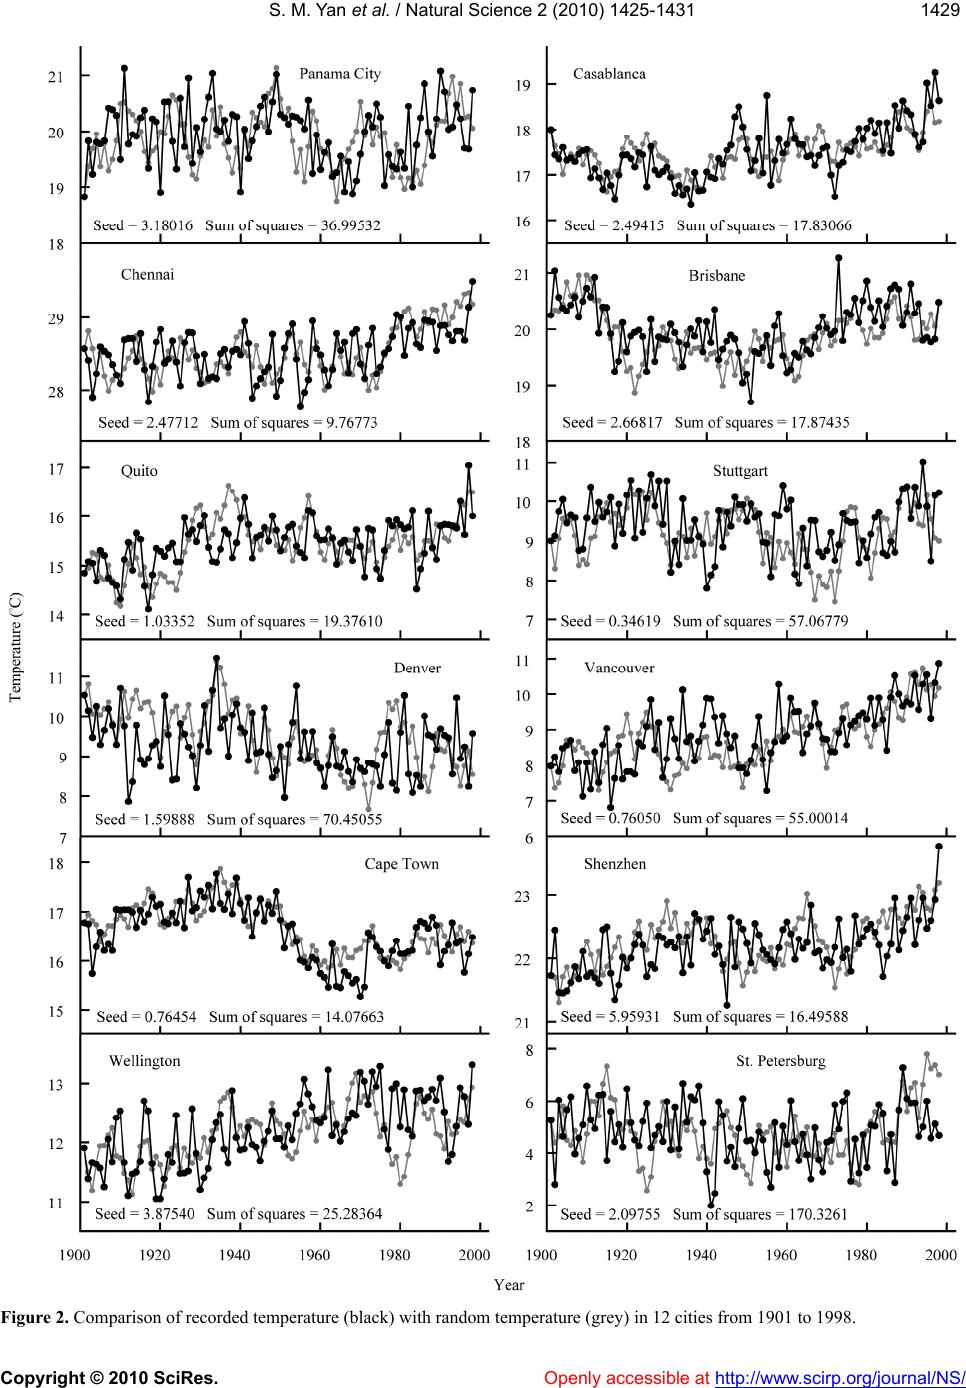 S. M. Yan et al. / Natural Science 2 (2010) 1425-1431 Copyright © 2010 SciRes. Openly accessible at http://www.scirp.org/journal/NS/ 142 1429 Figure 2. Comparison of recorded temperature (black) with random temperature (grey) in 12 cities from 1901 to 1998. 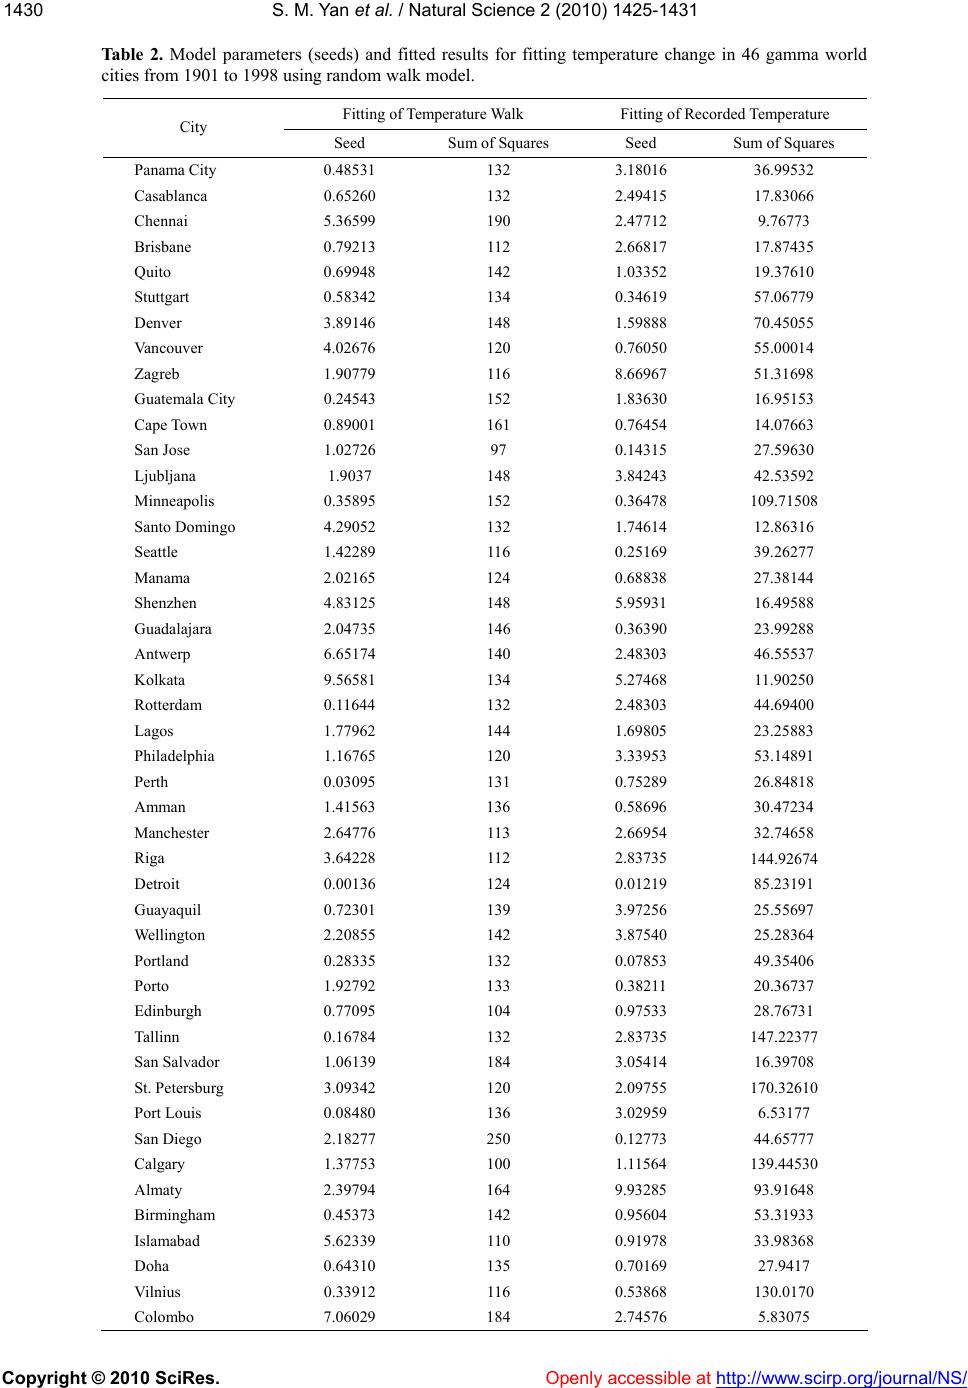 S. M. Yan et al. / Natural Science 2 (2010) 1425-1431 Copyright © 2010 SciRes. Openly accessible at http:// www.scirp.org/journal/NS/ 1430 Ta b le 2. Model parameters (seeds) and fitted results for fitting temperature change in 46 gamma world cities from 1901 to 1998 using random walk model. Fitting of Temperature Walk Fitting of Recorded Temperature City Seed Sum of Squares Seed Sum of Squares Panama City 0.48531 132 3.18016 36.99532 Casablanca 0.65260 132 2.49415 17.83066 Chennai 5.36599 190 2.47712 9.76773 Brisbane 0.79213 112 2.66817 17.87435 Quito 0.69948 142 1.03352 19.37610 Stuttgart 0.58342 134 0.34619 57.06779 Denver 3.89146 148 1.59888 70.45055 Vancouver 4.02676 120 0.76050 55.00014 Zagreb 1.90779 116 8.66967 51.31698 Guatemala City 0.24543 152 1.83630 16.95153 Cape Town 0.89001 161 0.76454 1 4. 07663 San Jose 1.02726 97 0.14315 27.59630 Ljubljana 1.9037 148 3.84243 42.53592 Minneapolis 0.35895 152 0.36478 109.71508 Santo Domingo 4.29052 132 1.74614 12.86316 Seattle 1.42289 116 0.25169 39.26277 Manama 2.02165 124 0.68838 27.38144 Shenzhen 4.83125 148 5.95931 16.49588 Guadalajara 2.04735 146 0.36390 23.99288 Antwerp 6.65174 140 2.48303 46.55537 Kolkata 9.56581 134 5.27468 11.90250 Rotterdam 0.11644 132 2.48303 44.69400 Lagos 1.77962 144 1.69805 23.25883 Philadelphia 1.16765 120 3.33953 53.14891 Perth 0.03095 131 0.75289 26.84818 Amman 1.41563 136 0.58696 30.47234 Manchester 2.64776 113 2.66954 32.74658 Riga 3.64228 112 2.83735 144.92674 Detroit 0.00136 124 0.01219 85.23191 Guayaquil 0.72301 139 3.97256 25.55697 Wellington 2.20855 142 3.87540 25.28364 Portland 0.28335 132 0.07853 49.35406 Porto 1.92792 133 0.38211 20.36737 Edinburgh 0.77095 104 0.97533 28.76731 Tallinn 0.16784 132 2.83735 147.22377 San Salvador 1.06139 184 3.05414 16.39708 St. Petersburg 3.09342 120 2.09755 170.32610 Port Louis 0.08480 136 3.02959 6.53177 San Diego 2.18277 250 0.12773 44.65777 Calgary 1.37753 100 1.11564 139.44530 Almaty 2.39794 164 9.93285 93.91648 Birmingham 0.45373 142 0.95604 53.31933 Islamabad 5.62339 110 0.91978 33.98368 Doha 0.64310 135 0.70169 27.9417 Vilnius 0.33912 116 0.53868 130.0170 Colombo 7.06029 184 2.74576 5.83075  S. M. Yan et al. / Natural Science 2 (2010) 1425-1431 Copyright © 2010 SciRes. http://www.scirp.org/journal/NS/ 143 1431 nature, and invariant measure of these maps are likely a fractal-dimensional sieves with a hyperbolic point at every location. The annual iteration of this map is like a coin tossing [14]. Openly accessible at Still, the random walk could be viewed as the Drunk- ard’s walk [15] as the climate change seems to be a complex process, and the drunkard walk is also used to describe complex processes. It should be obvious that climate change is a complex process, for the climate change involves many factors that are not reducible to exactly one thing. And the climate affects the ecosystem that is a complex process itself. On the other hand, the random mechanism in random walk model is different from other random factors in modeling, where the random factors were mainly con- sidered as a minor factor [16]. At this moment, we have no way to know whether or not the random walk model works better than other cli- mate models, simply because the results of temperature fitting in these cities using other climate models are not available for comparison. In conclusion: we use the random walk model to fit the temperature change in 46 gamma world cities from 1901 to 1998, and the r esults show that the random walk model can fit both the temperature walk and recorded temperature in different cities worldwide. This study confirms that the random walk model can be used to analyze the temperature change, which suggests that the random mechanism could be a factor driving the tem- perature change in these cities. The use of random walk to fit the temperature change is still at very early stage nevertheless more studies are needed in order to better understand the temperature change and its modeling. 4. ACKNOWLEDGEMENTS This study was partly supported by Guangxi Science Foundation (07-109-001A, 08-115-011, 09322001 and 2010GXNSFA013046). The authors wish to thank Dr Hong Zhang at Biyee SciTech Inc., MA, USA for helpful discussion. The authors also wish to thank Dr Alexei A. Predtechenski at Standard Microsystems Corporation, Austin, TX, USA for his discussion and su pport in internet discuss io n g roup. REFERENCES [1] Yan, S. and Wu, G. (2009) What these trends suggest? American Journal of Applied Sciences, 6, 1116-1121. [2] Yan, S. and Wu, G. (2009) Trends in global warming and evolution of polymerase basic protein 2 family from in- fluenza A virus. Journal of Biomedical Sciences and En- gineering, 2, 458-464. [3] Yan, S. and Wu, G. (2009) Trends in global warming and evolution of matrix protein 2 family from influenza A virus. Interdisciplinary Sciences: Computational Life Sciences, 1, 272-279. [4] Yan, S.M., Zuo, W.P., Zhu, Q.X., Huang, Y.Y., Pan, L.X. and Wu, G. (2010) Trends in global warming and evolu- tion of neuraminidases from influenza A viruses since 1918. Guangxi Sciences, 17, 80-84. [5] Yan, S. and Wu, G. (2010) Trends in global warming and evolution of nucleoproteins from influenza A viruses since 1918. Transboundary and Emerging Diseases. [6] Feller, W. (1968) An introduction to probability theory and its applications. 3rd Edition, Wiley, New York. [7] Yan, S. and Wu, G. (2010) Modeling of global tempera- ture change from 1850 to 2009 using random walk. Guangxi Sciences, 17, 148-150. [8] Gordon, A.H. (1991) Global warming as a manifestation of a random walk. Journal of Climate, 4, 589-597. [9] Wikimedia Foundation, Inc. (2010) Global city. http://en.wikipedia.org/wiki/Global_city [10] New, M., Hulme, M. and Jones, P. (2000) Representing twentieth-century space-time climate variability. Part II: Development of 1901-96 monthly grids of terrestrial surface climate. Journal of Climate, 13, 2217-2238. [11] Willison, S. (2010) Get lat lon. http://www.getlatlon.com/ [12] SPSS Inc., SigmaPlot for Windows Version 8.02. (1986- 2001). [13] Borovkov, A. and Borovkov, K. (2008) Asymptotic analysis of random walks: heavy-tailed distributions, Cambridge University Pre ss, Cambri dge. [14] Tekhasski, A. (2010) Random walk model suggests that the global warming could be mainly attributed to random mechanism. http://www.amazon.com/tag/science/forum/ ref=cm_cd_pg_pg7?_encoding=UTF8&cdForum=FxZ58 KVEERYS5E&cdPage=7&cdSort=oldest&cdThread=Tx 3TXP04WUSD4R1&displayType=tagsDetail [15] Neil, J. (2009) Simply complexity: A clear guide to com- plexity theory. Reprint edition, Oneworld Publications, Oxford. [16] Williams, P.D. (2005) Modelling climate change: the role of unresolved processes. Philosophical Transactions of the Royal Society A , 363, 2931-2946. |