

Paper Menu >>
Journal Menu >>
 Vol.2, No.12, 1407-1416 (2010) doi:10.4236/ns.2010.212172 Copyright © 2010 SciRes. Openly accessible at http:// www.scirp.org/journal/NS/ Natural Science The statistical prediction of East African rainfalls using quasi-biennial oscillation phases information Hashim K. Ng’ongolo, Sergei P. Smyshlyaev* Department of Meteorology forecast, Russian State Hydrometeorological University (RSHU), Saint-Petersburg, Russia; [email protected], *Correspon ding Author: [email protected] Received 22 September 2010; revised 25 October 2010; accepted 28 October 2010. ABSTRACT A simple correlation method and a quasi-biennial oscillation (QBO)/rainfall composite analysis were used to examine the teleconnections be- tween the seasonal rainfall anomalies of March through May (long-rains) over East Africa and the different QBO phases in the stratospheric zonal winds, and also explore the predictive potential of the long rainy season using infor- mation about the phases of the QBO for the pe- riod 1979-2003. We study the spatial correlation patterns statistically to understand the climatic associations between the equatorial strato- spheric zonal wind and regional rainfall at the interannual time scale. The aim of this analysis is to establish whether this global signal can be employed as predictor variable in the long-range forecasts. Principal component analysis (PCA) is employed in the first instance to reduce the large dimensionality of the predictant (monthly rainfall data), to retain the time series of the principal components ( P Cs ) and to delineate the rain gauge network of East Africa into homo- geneous zones. Spatial patterns of the factor loading were used to delineate East Africa into 11 homogeneous zones. Keywords: Principal Component Analysis (PCA); Climatological Rainfall Zones; QBO-Index; SOI-Index; March to May Seasonal Rainfall in East Africa 1. INTRODUCTION East Africa experiences two main rainy seasons, namely the ‘long’ rains (March to May) and the ‘short’ rains (October to December). Significant evidence of the relationships between short-rains over eastern Africa, and SST and ENSO have been observed [1-3], and rela- tively less attention has been directed at the predictive potential of the long-rains season over th e region, which is more critical than the short-rains in many parts of the region for the agricultural industry and other social eco- nomic activities. The long-rains season has been associ- ated with complex interactions between many regional and large-scale mechanisms which generally induce large heterogeneities in the spatial rainfall distribution [4,5] and virtually neglig ible co rrelations with ENSO [3]. Recent studies of interannual variability in the tropics have largely focused on the ENSO, so much so that other important long-term sources of climate variability may have been overlooked. Therefore the objective of this study is to investigate the relationships between the different quasi-biennial oscillation (QBO) phases in the stratospheric zonal wind and the long-rains season of eastern Africa, and also explore the predictive potential of the long rainy season using information about the phases of the QBO. Several investigators have reported the presence of the QBO in various atmospheric pa- rameters and at different regions of the globe [5-7]. Studies by Holton and Lindzen, Plumb, Holton and Tan [8-10] have indicated that the stratospheric equatorial QBO is forced locally by alternating downward propa- gating patterns of westerly and easterly mean zonal winds which repeat with somewhat irregular period av- eraging about 26 months. It has been pointed out that the stratospheric QBO is excited primarily by vertically propagating equatorial wave modes, and that these modes excite a quasi-biennial mean zonal wind response through the mechanism of radioactive damping which causes the waves to decay in amplitude with height and thus to transfer momentum to the mean zonal flow [8]. Lau and Sheu [11] have indicated that the fundamental period of the Southern Oscillatio n (SO) is approx imately double that of the QBO, which in turn twice that of the annual cycle. QBO has been found to be strongly phase locked with the annual cycle and it also tends to enhance major negative swings in the SO associated with the El Niño-Southern Oscillation (ENSO) events. Evidence 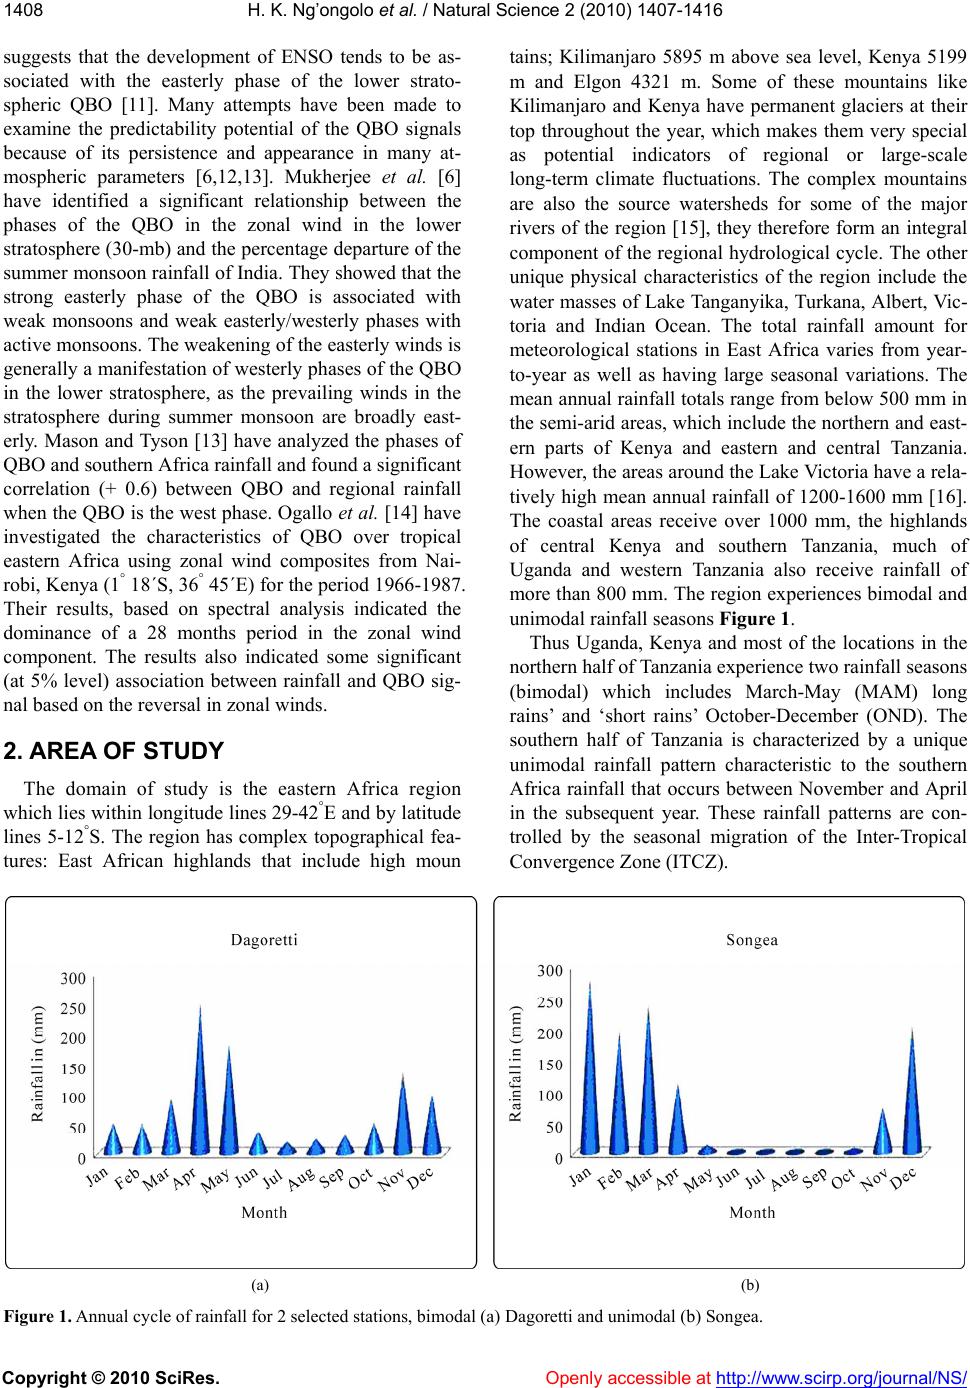 H. K. Ng’ongolo et al. / Natural Science 2 (2010) 1407-1416 Copyright © 2010 SciRes. Openly accessible at http:// www.scirp.org/journal/NS/ 1408 suggests that the development of ENSO tends to be as- sociated with the easterly phase of the lower strato- spheric QBO [11]. Many attempts have been made to examine the predictability potential of the QBO signals because of its persistence and appearance in many at- mospheric parameters [6,12,13]. Mukherjee et al. [6] have identified a significant relationship between the phases of the QBO in the zonal wind in the lower stratosphere (30-mb) and the percentage departure of the summer monsoon rainfall of India. They showed that the strong easterly phase of the QBO is associated with weak monsoons and weak easterly/westerly phases with active monsoons. The weakening of the easterly winds is generally a manifestation of westerly phases of the QBO in the lower stratosphere, as the prevailing winds in the stratosphere during summer monsoon are broadly east- erly. Mason and Tyson [13] have analyzed the phases of QBO and southern Africa rainfall and found a significant correlation (+ 0.6) between QBO and regional rainfall when the QBO is the west phase. Ogallo et al. [14] have investigated the characteristics of QBO over tropical eastern Africa using zonal wind composites from Nai- robi, Kenya (1° 18´S, 36° 45´E) for the period 1 966-19 87. Their results, based on spectral analysis indicated the dominance of a 28 months period in the zonal wind component. The results also indicated some significant (at 5% level) association between rainfall and QBO sig- nal based on the reversal in zonal winds. 2. AREA OF STUDY The domain of study is the eastern Africa region which lies within longitude lines 29-42°E and by latitud e lines 5-12°S. The region has complex topographical fea- tures: East African highlands that include high moun tains; Kilimanjaro 5895 m above sea level, Kenya 5199 m and Elgon 4321 m. Some of these mountains like Kilimanjaro and Kenya have permanent glaciers at their top throughout the year, which makes them very special as potential indicators of regional or large-scale long-term climate fluctuations. The complex mountains are also the source watersheds for some of the major rivers of the region [15], they therefore form an integral component of the regional hydrological cycle. The other unique physical characteristics of the region include the water masses of Lake Tanganyika, Turkana, Albert, Vic- toria and Indian Ocean. The total rainfall amount for meteorological stations in East Africa varies from year- to-year as well as having large seasonal variations. The mean annual rainfall totals range from below 500 mm in the semi-arid areas, which include the northern and east- ern parts of Kenya and eastern and central Tanzania. However, the areas around the Lake Victoria have a rela- tively high mean annual rainfall of 1200-1600 mm [16]. The coastal areas receive over 1000 mm, the highlands of central Kenya and southern Tanzania, much of Uganda and western Tanzania also receive rainfall of more than 800 mm. The region experiences bimodal and unimodal rainfall seasons Figure 1. Thus Uganda, Kenya and most of the locations in the northern half of Tanzania experience two rainfall seasons (bimodal) which includes March-May (MAM) long rains’ and ‘short rains’ October-December (OND). The southern half of Tanzania is characterized by a unique unimodal rainfall pattern characteristic to the southern Africa rainfall that occurs between November and April in the subsequent year. These rainfall patterns are con- trolled by the seasonal migration of the Inter-Tropical Convergence Zone (ITCZ). (a) (b) F igure 1. Annual cycle of rainfall for 2 selected stations, bimodal (a) Dagoretti and unimodal (b) Songea.  H. K. Ng’ongolo et al. / Natural Science 2 (2010) 1407-1416 Copyright © 2010 SciRes. Openly accessible at http://www.scirp.org/journal/NS/ 140 1409 3. DATA DESCRIPTION AND METHODOLOGY The data used as predictor variables in this study are Southern Oscillation Index (SOI) and globally averaged equatorial stratospheric 30-mb zonal wind index (QBO). This data set was obtained from climate analysis center (CPC/NOAA) database. The data used as the predictant variables are long-term monthly rainfall records for 71 meteorological stations scatted over the East African region Figure 2, and are supplied by the Tanzania Mete- orological Agency (TMA) and, the Ugandan and Kenyan Meteorological Departments. To ensure consistency with the SOI and QBO-indices data; we extracted rainfall records from the stations for the period from 1979 to 2003. A simple correlation method and a QBO/rainfall composite analysis were used to examine the telecon- nections between the seasonal rainfall anomalies of March through May (long-rains) over East Africa and the different QBO phases in the stratospheric zonal winds, and also explore the predictive potential of the long rainy season using information about the phases of the QBO for the period 1979-2003. We study the spatial correlation patterns statistically to understand the cli- matic associations between the equatorial stratospheric zonal wind and regional rainfall at the interannual time scale. The aim of this analysis is to establish whether this global signal can be employed as predictor variable in the long-range forecasts. Principal Component Analy- sis (PCA) is employed in the first instance to reduce the large dimensionality of the predictant, to retain the time series of the principal components (PCs) and to delineate the rain gauge network of East Africa into homogeneous zones. Spatial p atterns of the facto r loading were used to delineate East Africa into 11 homogeneous zones Figure 3. Figure 2. The location of stations used in the study.  H. K. Ng’ongolo et al. / Natural Science 2 (2010) 1407-1416 Copyright © 2010 SciRes. Openly accessible at http:// www.scirp.org/journal/NS/ 1410 Figure 3. The homogeneous climatological zones over eastern Africa derived from PCA. The stratification of the QBO indices was based on four seasons: March to May (MAM), June to August (JJA), September to November (SON), and December to February (DJF). The standardized departures of the rainfall for East Africa from 71 meteorological stations, normals were calculated for the long-rains season of MAM based on the relation: YY , where Y is MAM rainfall in a year, Y and are mean and standard deviation respectively, based on the 1979-2003 period. 3.1. Principal Component Analysis The following is PCA procedures [17]. Consider the matrix M XN , whose elements mn F f are standardized values, when m = 1, 2, 3, …M (stations) or grid points and n = 1, 2, 3, …N (time i.e. months, years, seasons etc). 1) Compute the covariance matrix M XM 1T F F N (1) 2) Determine the eigenvectors 12 ,... M ee e and eigenvalues 12 ,.... M from the characteristics equation of Z, where I is a unit matrix 0I (2) 3) Compute the principal component time series, C such that its elements M N C, are the projection of mn f on M e given by T CEF (3) Each of the PCs will be orthogonal to the other, the (PC1) will be the most dominant pattern and it explains most of the variances, then (PC2) will be second fol- lowed by PC3, etc. The Kaiser criterion was used to de- 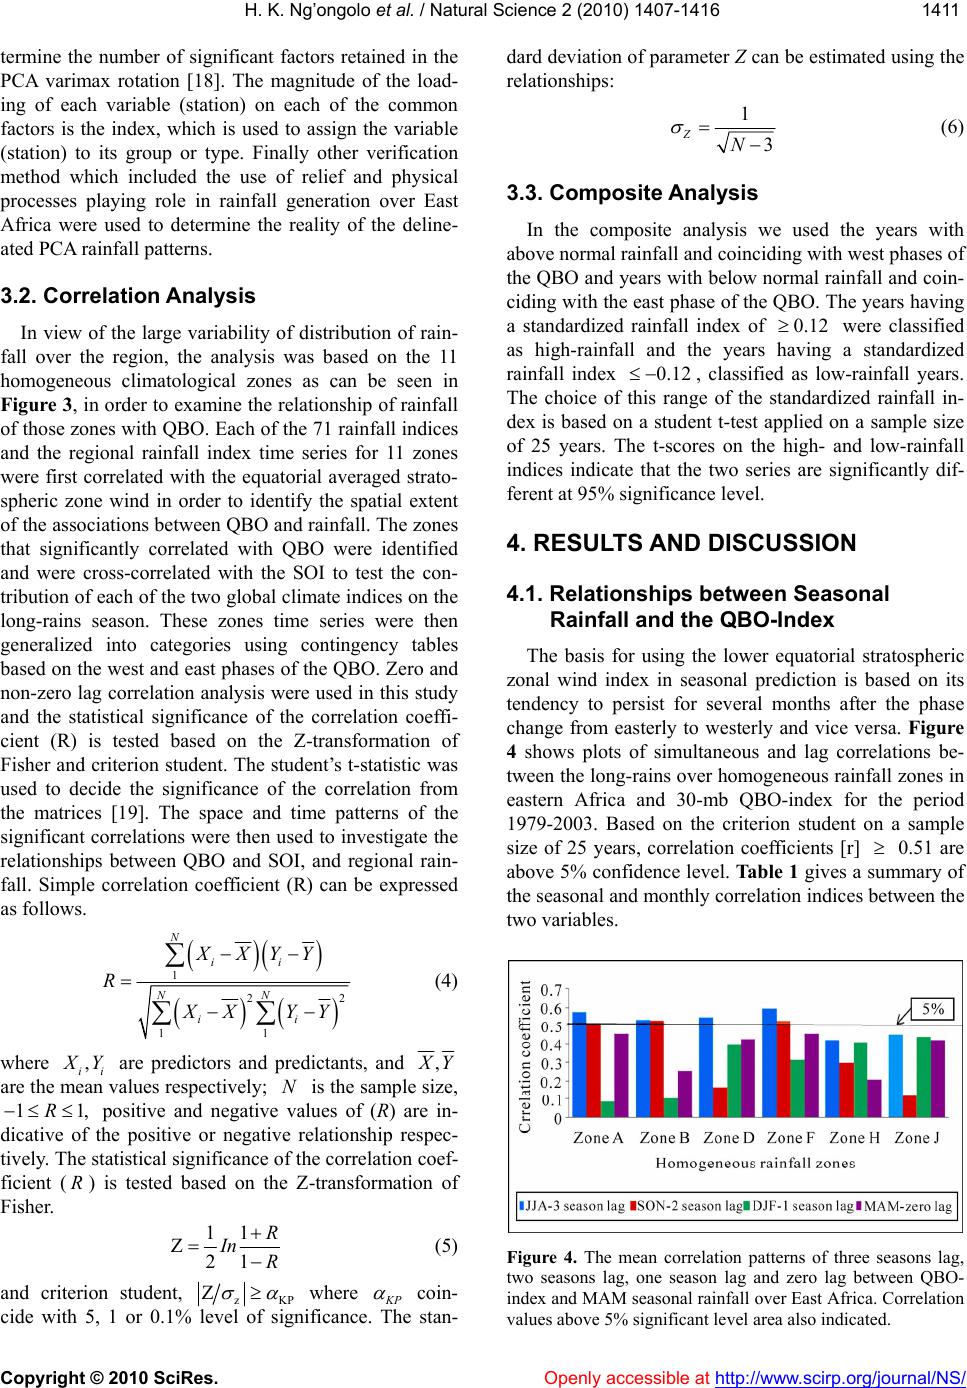 H. K. Ng’ongolo et al. / Natural Science 2 (2010) 1407-1416 Copyright © 2010 SciRes. Openly accessible at http://www.scirp.org/journal/NS/ 141 1411 termine the number of significant factors retained in the PCA varimax rotation [18]. The magnitude of the load- ing of each variable (station) on each of the common factors is the index, which is used to assign the variable (station) to its group or type. Finally other verification method which included the use of relief and physical processes playing role in rainfall generation over East Africa were used to determine the reality of the deline- ated PCA rainfall pattern s. 3.2. Correlation Analysis In view of the large variability of distribution of rain- fall over the region, the analysis was based on the 11 homogeneous climatological zones as can be seen in Figure 3, in order to examine the relation ship of rainfall of those zones with QBO. Each of the 71 rainfall indices and the regional rainfall index time series for 11 zones were first correlated with the equatorial averaged strato- spheric zone wind in order to identify the spatial extent of the associations between QBO and rainfall. The zones that significantly correlated with QBO were identified and were cross-correlated with the SOI to test the con- tribution of each of the two glob al climate indices on the long-rains season. These zones time series were then generalized into categories using contingency tables based on the west and east phases of the QBO. Zero and non-zero lag correlation analysis were used in this study and the statistical significance of the correlation coeffi- cient (R) is tested based on the Z-transformation of Fisher and criterion student. The student’s t-statistic was used to decide the significance of the correlation from the matrices [19]. The space and time patterns of the significant correlations were then used to investigate the relationships between QBO and SOI, and regional rain- fall. Simple correlation coefficient (R) can be expressed as follows. 1 22 11 N ii NN ii XXYY R X XYY (4) where , ii X Y are predictors and predictants, and , X Y are the mean values respectively; is the sample size, positive and negative values of (R) are in- dicative of the positive or negative relationship respec- tively. The statistical sign ificance of the correlation coef- ficient () is tested based on the Z-transformation of Fisher. N 1R 1, R 11 21 R In R (5) and criterion student, zKP Z where K P coin- cide with 5, 1 or 0.1% level of significance. The stan- dard deviation of parameter Z can be estimated using the relationships: 1 3 ZN (6) 3.3. Composite Analysis In the composite analysis we used the years with above normal rainfall and coinciding with west phases of the QBO and years with below normal rainfall and coin- ciding with the east phase of the QBO. The years having a standardized rainfall index of were classified as high-rainfall and the years having a standardized rainfall index 0.12 0.12 , classified as low-rainfall years. The choice of this range of the standardized rainfall in- dex is based on a student t-test applied on a sample size of 25 years. The t-scores on the high- and low-rainfall indices indicate that the two series are significantly dif- ferent at 95% significance level. 4. RESULTS AND DIS CUSSION 4.1. Relationships between Seasonal Rainfall and the QBO-Index The basis for using the lower equatorial stratospheric zonal wind index in seasonal prediction is based on its tendency to persist for several months after the phase change from easterly to westerly and vice versa. Figure 4 shows plots of simultaneous and lag correlations be- tween the long-rains over homogeneous rainfall zones in eastern Africa and 30-mb QBO-index for the period 1979-2003. Based on the criterion student on a sample size of 25 years, correlation coefficients [r] 0.51 are above 5% confidence level. Table 1 gives a summary of the seasonal and monthly correlation indices between the two variables. Figure 4. The mean correlation patterns of three seasons lag, two seasons lag, one season lag and zero lag between QBO- index and MAM seasonal rainfall over East Africa. Correlation alues above 5% significant level area also indicated. v 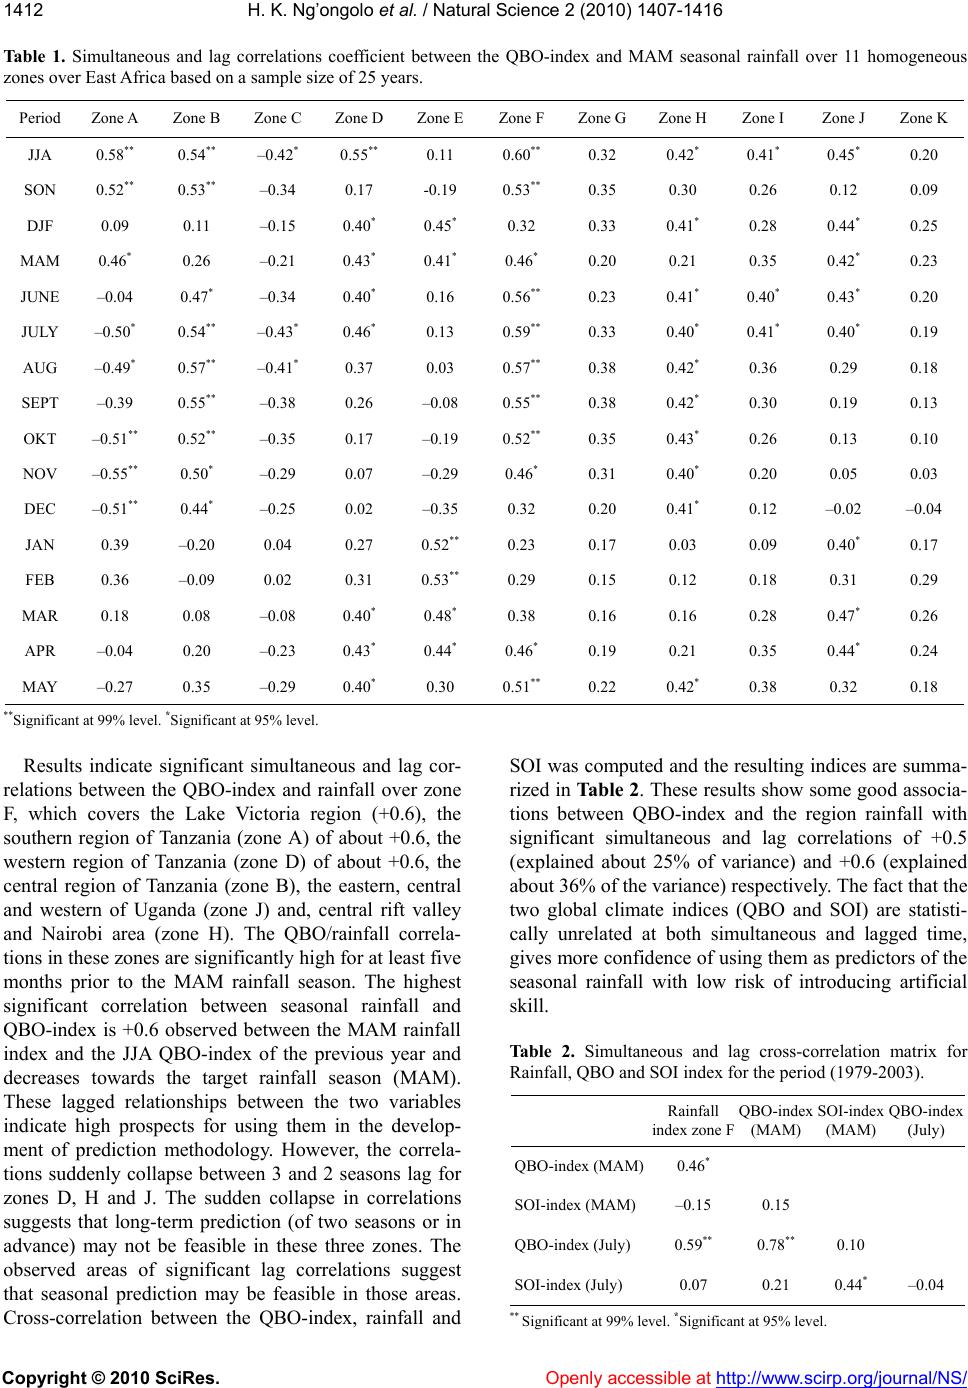 H. K. Ng’ongolo et al. / Natural Science 2 (2010) 1407-1416 Copyright © 2010 SciRes. http://www.scirp.org/journal/NS/Openly accessible at 1412 Ta bl e 1. Simultaneous and lag correlations coefficient between the QBO-index and MAM seasonal rainfall over 11 homogeneous zones over East Africa based on a sample size of 25 years. Period Zone A Zone B Zone C Zone D Zone E Zone F Zone G Zone H Zone I Zone J Zone K JJA 0.58** 0.54** –0.42* 0.55** 0.11 0.60** 0.32 0.42* 0.41* 0.45* 0.20 SON 0.52** 0.53** –0.34 0.17 -0.19 0.53** 0.35 0.30 0.26 0.12 0.09 DJF 0.09 0.11 –0.15 0.40* 0.45* 0.32 0.33 0.41* 0.28 0.44* 0.25 MAM 0.46* 0.26 –0.21 0.43* 0.41* 0.46* 0.20 0.21 0.35 0.42* 0.23 JUNE –0.04 0.47* –0.34 0.40* 0.16 0.56** 0.23 0.41* 0.40* 0.43* 0.20 JULY –0.50* 0.54** –0.43* 0.46* 0.13 0.59** 0.33 0.40* 0.41* 0.40* 0.19 AUG –0.49* 0.57** –0.41* 0.37 0.03 0.57** 0.38 0.42* 0.36 0.29 0.18 SEPT –0.39 0.55** –0.38 0.26 –0.08 0.55** 0.38 0.42* 0.30 0.19 0.13 OKT –0.51** 0.52** –0.35 0.17 –0.19 0.52** 0.35 0.43* 0.26 0.13 0.10 NOV –0.55** 0.50* –0.29 0.07 –0.29 0.46* 0.31 0.40* 0.20 0.05 0.03 DEC –0.51** 0.44* –0.25 0.02 –0.35 0.32 0.20 0.41* 0.12 –0.02 –0.04 JAN 0.39 –0.20 0.04 0.27 0.52** 0.23 0.17 0.03 0.09 0.40* 0.17 FEB 0.36 –0.09 0.02 0.31 0.53** 0.29 0.15 0.12 0.18 0.31 0.29 MAR 0.18 0.08 –0.08 0.40* 0.48* 0.38 0.16 0.16 0.28 0.47* 0.26 APR –0.04 0.20 –0.23 0.43* 0.44* 0.46* 0.19 0.21 0.35 0.44* 0.24 MAY –0.27 0.35 –0.29 0.40* 0.30 0.51** 0.22 0.42* 0.38 0.32 0.18 **Significant at 99 % level. *Significant at 95% level. Results indicate significant simultaneous and lag cor- relations between the QBO-index and rainfall over zone F, which covers the Lake Victoria region (+0.6), the southern region of Tanzania (zone A) of about +0.6, the western region of Tanzania (zone D) of about +0.6, the central region of Tanzania (zone B), the eastern, central and western of Uganda (zone J) and, central rift valley and Nairobi area (zone H). The QBO/rainfall correla- tions in these zones are significantly high for at least five months prior to the MAM rainfall season. The highest significant correlation between seasonal rainfall and QBO-index is +0.6 observed between the MAM rainfall index and the JJA QBO-index of the previous year and decreases towards the target rainfall season (MAM). These lagged relationships between the two variables indicate high prospects for using them in the develop- ment of prediction methodology. However, the correla- tions suddenly collapse between 3 and 2 seasons lag for zones D, H and J. The sudden collapse in correlations suggests that long-term prediction (of two seasons or in advance) may not be feasible in these three zones. The observed areas of significant lag correlations suggest that seasonal prediction may be feasible in those areas. Cross-correlation between the QBO-index, rainfall and SOI was computed and the resulting indices are summa- rized in Table 2. These results show some good associa- tions between QBO-index and the region rainfall with significant simultaneous and lag correlations of +0.5 (explained about 25% of variance) and +0.6 (explained about 36% of the variance) respectively. The fact that the two global climate indices (QBO and SOI) are statisti- cally unrelated at both simultaneous and lagged time, gives more confidence of using them as predictors of the seasonal rainfall with low risk of introducing artificial skill. Table 2. Simultaneous and lag cross-correlation matrix for Rainfall, QBO and SOI index for the period (1979-2003). Rainfall index zone F QBO-index (MAM) SOI-index (MAM) QBO-index (July) QBO-index (MAM)0.46* SOI-index (MAM)–0.15 0.15 QBO-index (July) 0.59** 0.78** 0.10 SOI-index (July) 0.07 0.21 0.44* –0.04 ** Significant at 99% level. *Significant at 95% level. 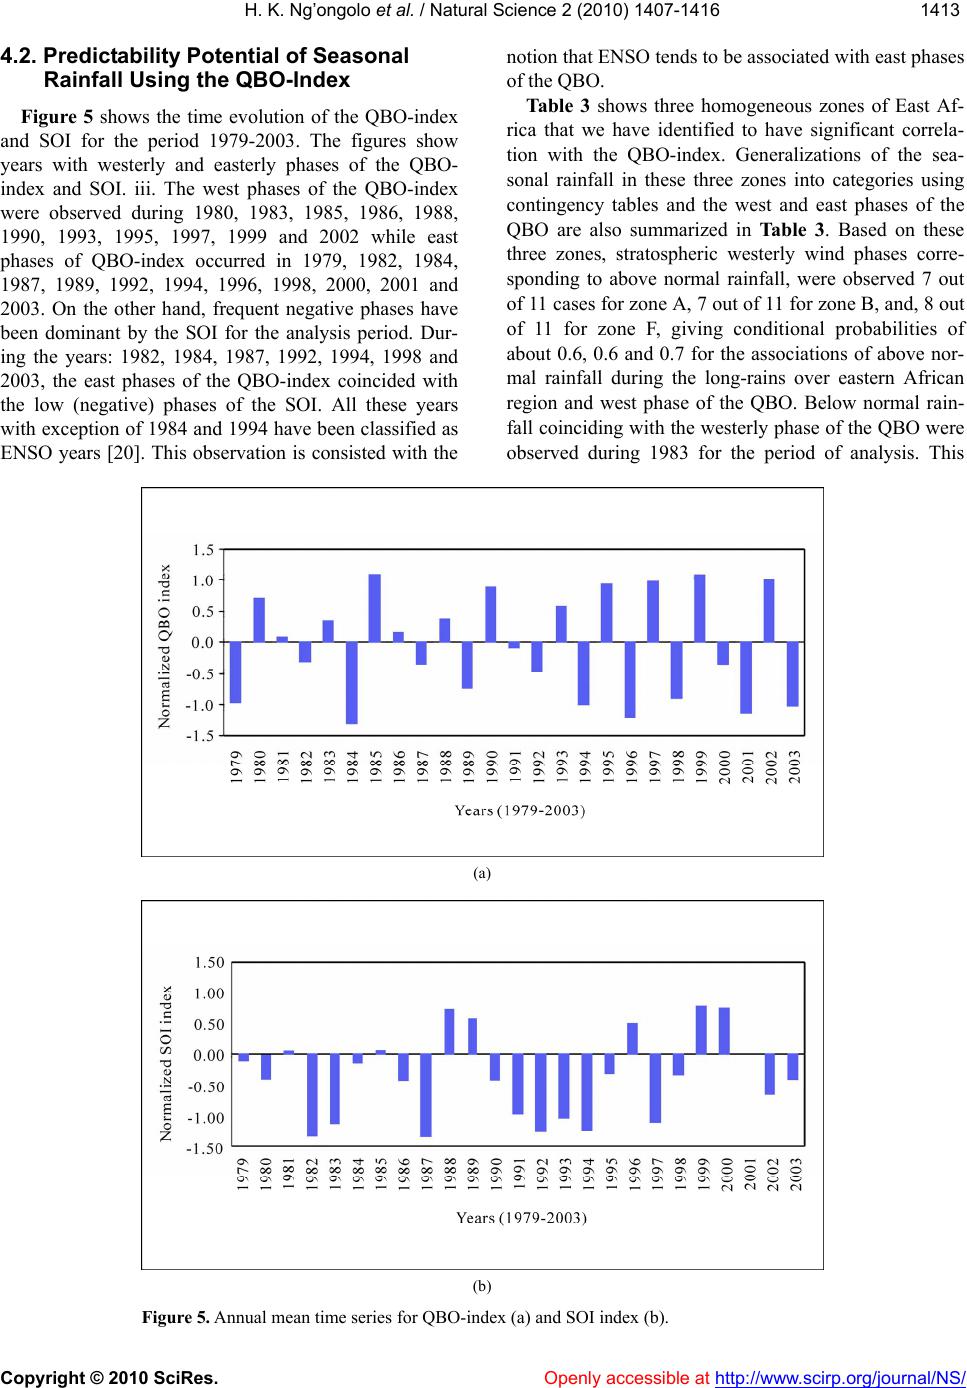 H. K. Ng’ongolo et al. / Natural Science 2 (2010) 1407-1416 Copyright © 2010 SciRes. Openly accessible at http://www.scirp.org/journal/NS/ 141 1413 4.2. Predictability Potential of Seasonal Rainfall Using the QBO-Index Figure 5 shows the time evolution of the QBO-index and SOI for the period 1979-2003. The figures show years with westerly and easterly phases of the QBO- index and SOI. iii. The west phases of the QBO-index were observed during 1980, 1983, 1985, 1986, 1988, 1990, 1993, 1995, 1997, 1999 and 2002 while east phases of QBO-index occurred in 1979, 1982, 1984, 1987, 1989, 1992, 1994, 1996, 1998, 2000, 2001 and 2003. On the other hand, frequent negative phases have been dominant by the SOI for the analysis period. Dur- ing the years: 1982, 1984, 1987, 1992, 1994, 1998 and 2003, the east phases of the QBO-index coincided with the low (negative) phases of the SOI. All these years with exceptio n of 1984 and 1994 have been classified as ENSO years [20]. This observation is consisted with the notion that ENSO tends to be associated with east phases of the QBO. Ta b le 3 shows three homogeneous zones of East Af- rica that we have identified to have significant correla- tion with the QBO-index. Generalizations of the sea- sonal rainfall in these three zones into categories using contingency tables and the west and east phases of the QBO are also summarized in Table 3. Based on these three zones, stratospheric westerly wind phases corre- sponding to above normal rainfall, were observed 7 out of 11 cases for zone A, 7 out of 11 for zone B, and, 8 out of 11 for zone F, giving conditional probabilities of about 0.6, 0.6 and 0.7 for the associations of above nor- mal rainfall during the long-rains over eastern African region and west phase of the QBO. Below normal rain- fall coinciding with the westerly phase of the QBO were observed during 1983 for the period of analysis. This (a) (b) Figure 5. Annual mean time series for QBO-index (a) and SOI index (b). 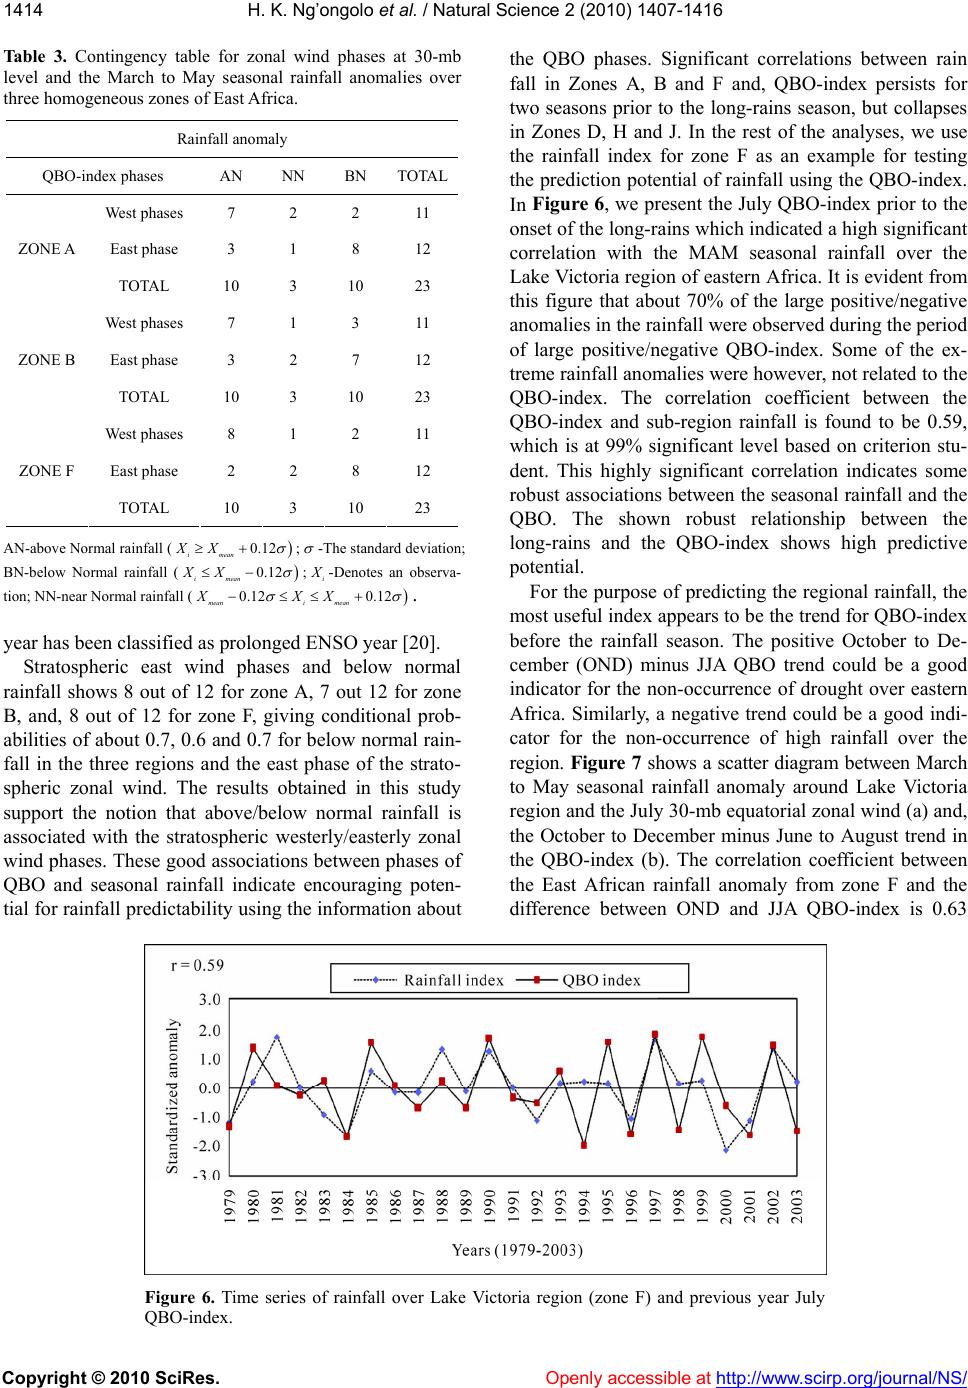 H. K. Ng’ongolo et al. / Natural Science 2 (2010) 1407-1416 Copyright © 2010 SciRes. Openly accessible at http:// www.scirp.org/journal/NS/ 1414 Table 3. Contingency table for zonal wind phases at 30-mb level and the March to May seasonal rainfall anomalies over three homogeneous zones of East Africa. Rainfall anomaly QBO-index phases AN NN BN TOTAL West phases 7 2 2 11 East phase 3 1 8 12 ZONE A TOTAL 10 3 10 23 West phases 7 1 3 11 East phase 3 2 7 12 ZONE B TOTAL 10 3 10 23 West phases 8 1 2 11 East phase 2 2 8 12 ZONE F TOTAL 10 3 10 23 AN-above Normal rainfall ( 0.12 imean XX ; -The standard deviation; BN-below Normal rainfall ( 0.12 imean XX ;i X -Denotes an observa- tion; NN-near Normal rainfall ( 0.12 mean X0.12 mean XX i . year has been classified as prolonged ENSO year [20]. Stratospheric east wind phases and below normal rainfall shows 8 out of 12 for zone A, 7 out 12 for zone B, and, 8 out of 12 for zone F, giving conditional prob- abilities of ab out 0.7, 0.6 and 0.7 fo r below normal rain- fall in the three regions and the east phase of the strato- spheric zonal wind. The results obtained in this study support the notion that above/below normal rainfall is associated with the stratospheric westerly/easterly zonal wind phases. These good associations between phases of QBO and seasonal rainfall indicate encouraging poten- tial for rainfall predictability using th e information abou t the QBO phases. Significant correlations between rain fall in Zones A, B and F and, QBO-index persists for two seasons prior to the long-rains season, but collapses in Zones D, H and J. In the rest of the analyses, we use the rainfall index for zone F as an example for testing the prediction poten tial of rainfall using the QBO-index. In Figure 6, we present the Ju ly QBO-index prior to the onset of the long-rains which indicated a high significant correlation with the MAM seasonal rainfall over the Lake Victoria region of eastern Africa. It is evident from this figure that about 70% of the large positive/negative anomalies in the rainfall were observed during the period of large positive/negative QBO-index. Some of the ex- treme rainfall anomalies were however, not related to the QBO-index. The correlation coefficient between the QBO-index and sub-region rainfall is found to be 0.59, which is at 99% significant level based on criterion stu- dent. This highly significant correlation indicates some robust associations between the seasonal rainfall and the QBO. The shown robust relationship between the long-rains and the QBO-index shows high predictive potential. For the purpose of predicting the regional rainfall, the most useful index appears to be the trend for QBO-index before the rainfall season. The positive October to De- cember (OND) minus JJA QBO trend could be a good indicator for the non-occurrence of drought over eastern Africa. Similarly, a negative trend could be a good indi- cator for the non-occurrence of high rainfall over the region. Figure 7 shows a scatter diagram between March to May seasonal rainfall anomaly around Lake Victoria region and the July 30-mb equatorial zonal wind (a) and, the October to December minus June to August trend in the QBO-index (b). The correlation coefficient between the East African rainfall anomaly from zone F and the difference between OND and JJA QBO-index is 0.63 Figure 6. Time series of rainfall over Lake Victoria region (zone F) and previous year July QBO-index. 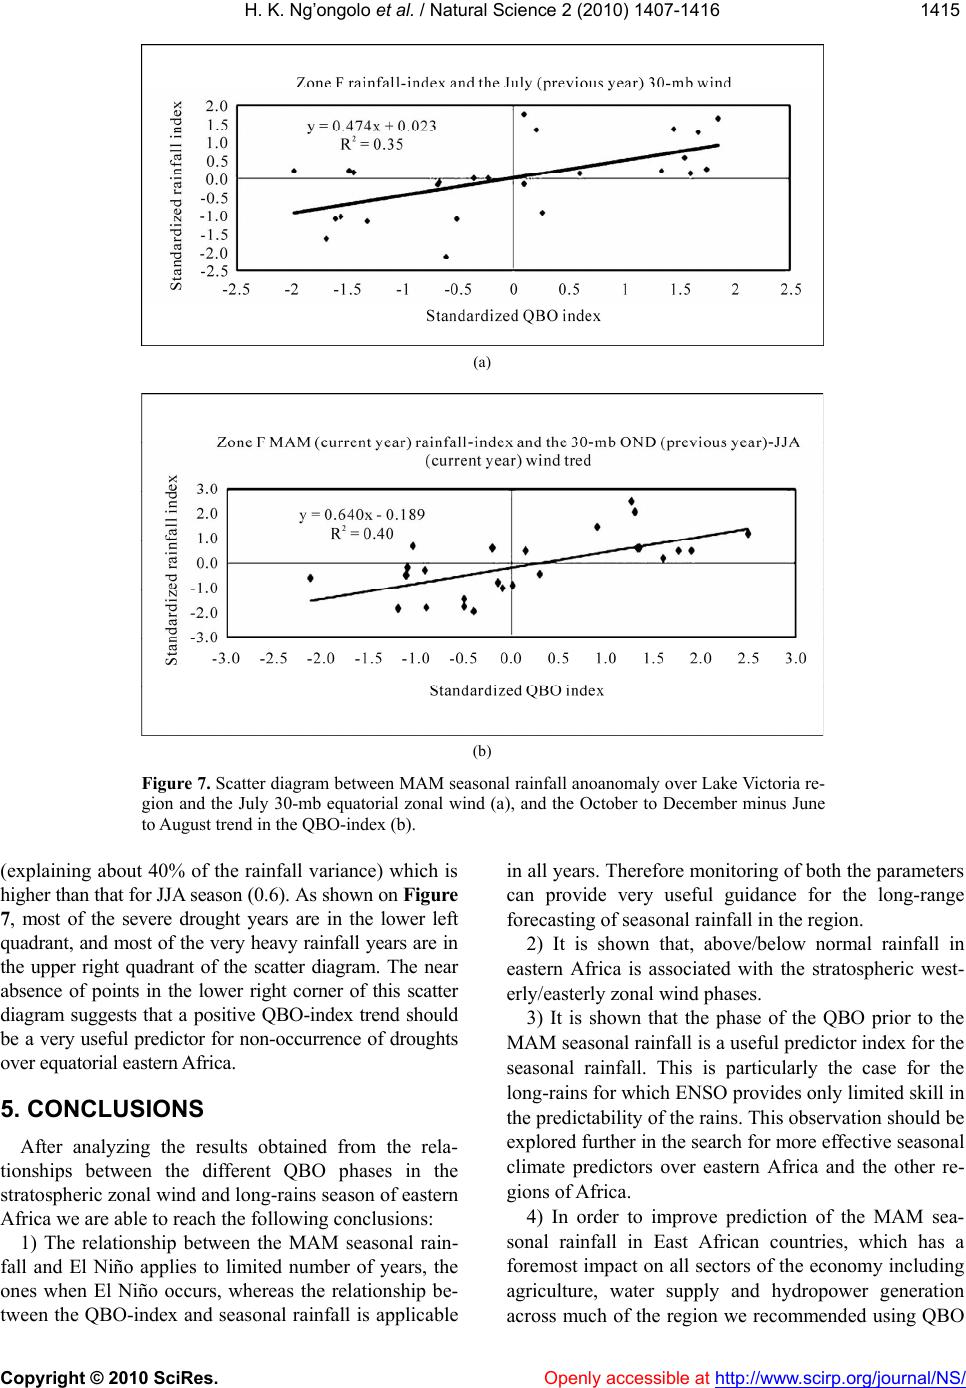 H. K. Ng’ongolo et al. / Natural Science 2 (2010) 1407-1416 Copyright © 2010 SciRes. Openly accessible at http://www.scirp.org/journal/NS/ 141 1415 (a) (b) Figure 7. Scatter diagram between MAM seasonal rainfall anoanomaly over Lake Victoria re- gion and the July 30-mb equatorial zonal wind (a), and the October to December minus June to August trend in the QBO-index (b). (explaining about 40% of the rainfall variance) which is higher than that for JJA seaso n (0.6). As shown on Figure 7, most of the severe drought years are in the lower left quadrant, and most of the very heavy rainfall years are in the upper right quadrant of the scatter diagram. The near absence of points in the lower right corner of this scatter diagram suggests that a positive QBO-index trend should be a very useful predictor for non-occurrence of droughts over equatorial eastern Africa. 5. CONCLUSIONS After analyzing the results obtained from the rela- tionships between the different QBO phases in the stratospheric zonal wind and long-rains season of eastern Africa we are able to reach the following conclusions: 1) The relationship between the MAM seasonal rain- fall and El Niño applies to limited number of years, the ones when El Niño occurs, whereas the relationship be- tween the QBO-index and seasonal rainfall is applicable in all years. Therefore monitoring of both the parameters can provide very useful guidance for the long-range forecasting of seasonal rainfall in the region. 2) It is shown that, above/below normal rainfall in eastern Africa is associated with the stratospheric west- erly/easterly zonal wind phases. 3) It is shown that the phase of the QBO prior to the MAM seasonal rainfall is a useful predictor index for the seasonal rainfall. This is particularly the case for the long-rains for which ENSO prov ides only limited skill in the predictability of th e rains. This observatio n sh ould be explored further in the search for more effective seasonal climate predictors over eastern Africa and the other re- gions of Africa. 4) In order to improve prediction of the MAM sea- sonal rainfall in East African countries, which has a foremost impact on all sectors of the economy in cluding agriculture, water supply and hydropower generation across much of the region we recommended using QBO 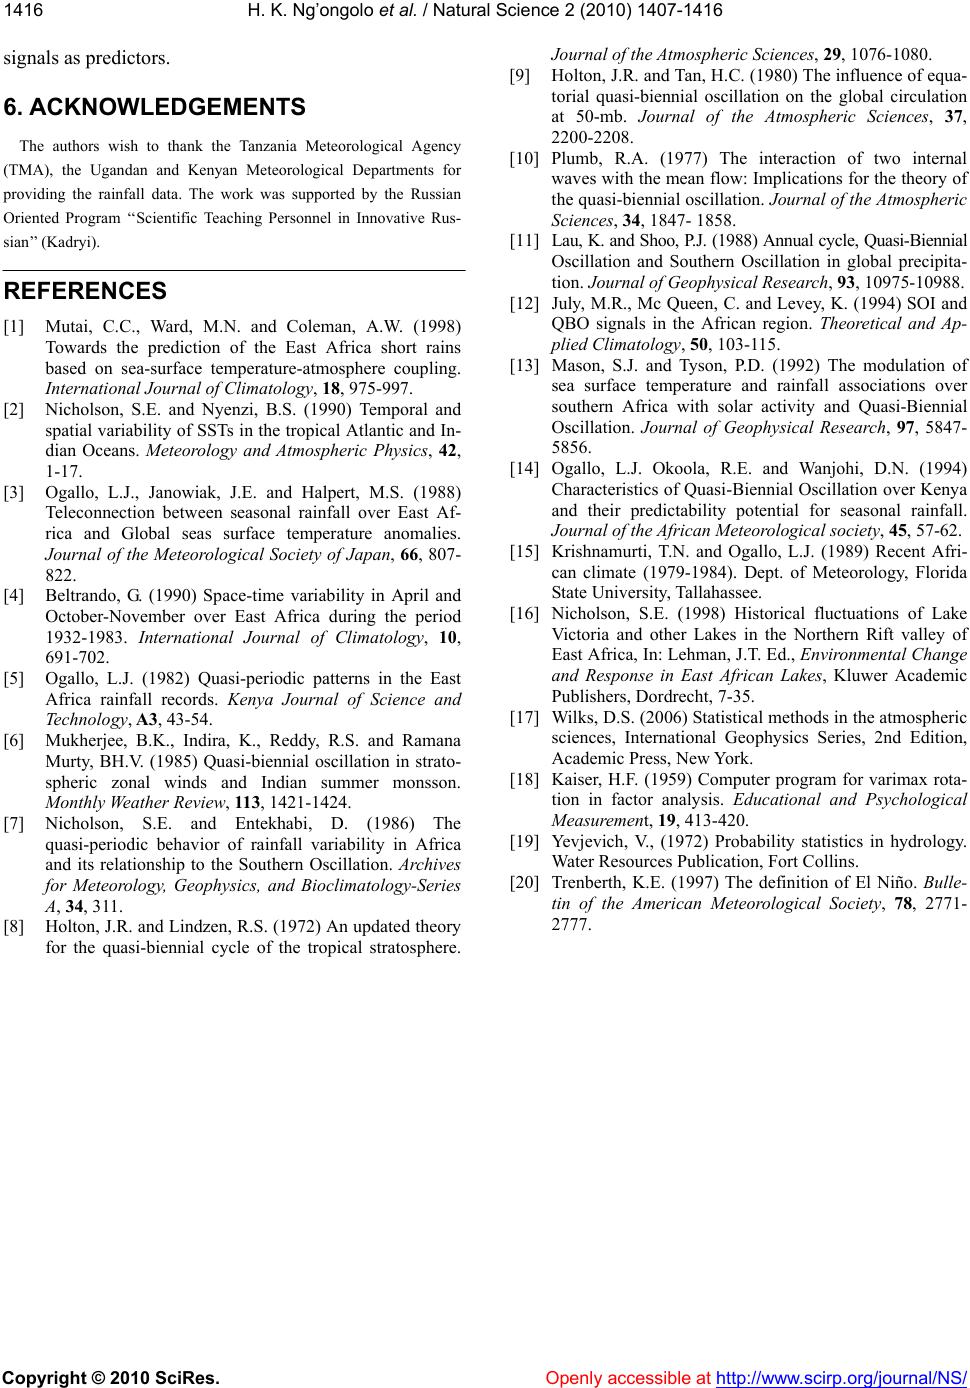 H. K. Ng’ongolo et al. / Natural Science 2 (2010) 1407-1416 Copyright © 2010 SciRes. Openly accessible at http:// www.scirp.org/journal/NS/ 1416 signals as predictors. 6. ACKNOWLEDGEMENTS The authors wish to thank the Tanzania Meteorological Agency (TMA), the Ugandan and Kenyan Meteorological Departments for providing the rainfall data. The work was supported by the Russian Oriented Program ‘‘Scientific Teaching Personnel in Innovative Rus- sian’’ (Kadryi). REFERENCES [1] Mutai, C.C., Ward, M.N. and Coleman, A.W. (1998) Towards the prediction of the East Africa short rains based on sea-surface temperature-atmosphere coupling. International Journal of Climatology, 18, 975-997. [2] Nicholson, S.E. and Nyenzi, B.S. (1990) Temporal and spatial variability of SSTs in the tropical Atlantic and In- dian Oceans. Meteorology and Atmospheric Physics, 42, 1-17. [3] Ogallo, L.J., Janowiak, J.E. and Halpert, M.S. (1988) Teleconnection between seasonal rainfall over East Af- rica and Global seas surface temperature anomalies. Journal of the Meteorological Society of Japan, 66, 807- 822. [4] Beltrando, G. (1990) Space-time variability in April and October-November over East Africa during the period 1932-1983. International Journal of Climatology, 10, 691-702. [5] Ogallo, L.J. (1982) Quasi-periodic patterns in the East Africa rainfall records. Kenya Journal of Science and Technology, A3, 43-54. [6] Mukherjee, B.K., Indira, K., Reddy, R.S. and Ramana Murty, BH.V. (1985) Quasi-biennial oscillation in strato- spheric zonal winds and Indian summer monsson. Monthly Weather Review, 113, 1421-1424. [7] Nicholson, S.E. and Entekhabi, D. (1986) The quasi-periodic behavior of rainfall variability in Africa and its relationship to the Southern Oscillation. Archives for Meteorology, Geophysics, and Bioclimatology-Series A, 34, 311. [8] Holton, J.R. and Lindzen, R.S. (1972) An updated theory for the quasi-biennial cycle of the tropical stratosphere. Journal of the Atmospheric Sciences, 29, 1076-1080. [9] Holton, J.R. and Tan, H.C. (1980) The influence of equa- torial quasi-biennial oscillation on the global circulation at 50-mb. Journal of the Atmospheric Sciences, 37, 2200-2208. [10] Plumb, R.A. (1977) The interaction of two internal waves with the mean flow: Implications for the theory of the quasi-biennial oscillation. Journal of the Atmospheric Sciences, 34, 1847- 1858. [11] Lau, K. and Shoo, P.J. (1988) Annual cycle, Quasi-Biennial Oscillation and Southern Oscillation in global precipita- tion. Journal of Geophysical Research, 93, 10975-10988. [12] July, M.R., Mc Queen, C. and Levey, K. (1994) SOI and QBO signals in the African region. Theoretical and Ap- plied Climatology, 50, 103-115. [13] Mason, S.J. and Tyson, P.D. (1992) The modulation of sea surface temperature and rainfall associations over southern Africa with solar activity and Quasi-Biennial Oscillation. Journal of Geophysical Research, 97, 5847- 5856. [14] Ogallo, L.J. Okoola, R.E. and Wanjohi, D.N. (1994) Characteristics of Quasi-Biennial Oscillation over Kenya and their predictability potential for seasonal rainfall. Journal of the African Meteorological society, 45, 57-62. [15] Krishnamurti, T.N. and Ogallo, L.J. (1989) Recent Afri- can climate (1979-1984). Dept. of Meteorology, Florida State University, Tallahassee. [16] Nicholson, S.E. (1998) Historical fluctuations of Lake Victoria and other Lakes in the Northern Rift valley of East Africa, In: Lehman, J.T. Ed., Environmental Change and Response in East African Lakes, Kluwer Academic Publishers, Dordrecht, 7-35. [17] Wilks, D.S. (2006) Statistical methods in the atmospheric sciences, International Geophysics Series, 2nd Edition, Academic Press, New York. [18] Kaiser, H.F. (1959) Computer program for varimax rota- tion in factor analysis. Educational and Psychological Measurement, 19, 413-420. [19] Yevjevich, V., (1972) Probability statistics in hydrology. Water Resources Publication, Fort Collins. [20] Trenberth, K.E. (1997) The definition of El Niño. Bulle- tin of the American Meteorological Society, 78, 2771- 2777. |