

Paper Menu >>
Journal Menu >>
 Computational Water, Energy, and Environmental Engineering, 2013, 2, 77-82 http://dx.doi.org/10.4236/cweee.2013.23009 Published Online July 2013 (http://www.scirp.org/journal/cweee) Modeling and OLAP Cubes for Database of Ground and Municipal Water Supply Taskeen Zaidi1, Annapurna Singh2, Vipin Saxena1* 1Department of Computer Science, B. B. Ambedkar University, Lucknow, India 2Department of Environmental Science, B. B. Ambedkar University, Lucknow, India Email: *[email protected] Received March 13, 2013; revised April 13, 2013; accepted April 20, 2013 Copyright © 2013 Taskeen Zaidi et al. This is an open access article distributed under the Creative Commons Attribution License, which permits unrestricted use, distribution, and reproduction in any medium, provided the original work is properly cited. ABSTRACT Modeling plays an important role for the solution of the complex research problems. When the database became large and complex then it is necessary to create a unified model for getting the desired information in the minimum time and to implement the model in a better way. The present paper deals with the modeling for searching of the desired infor- mation from a large database by storing the data inside the three dimensional data cubes. A sample case study is con- sidered as a real data related to the ground water and municipal water supply, which contains the data from the various localities of a city. For the demonstration purpose, a sample size is taken as nine but when it becomes very large for number of localities of different cities then it is necessary to store the data inside data cubes. A well known ob- ject-oriented Unified Mode ling Language (UML) is used to create Unified class and state models. For verification pur- pose, sample queries are also performed and corresponding results are depicted. Keywords: Modeling; Database; Object-Oriented; Unified Modeling Language; OLAP Data Cubes; Wat er S up ply 1. Introduction In the current scenario, modeling becomes an integral part of the solution of any kind of research problems whether it is related to life sciences, medical sciences, engineering sciences, etc. An object-oriented modeling language is most popular language because of the evolu- tion of the Graphical User Interface (GUI) applications in the computer science filed. On the basis of object-ori- ented technology, Ob ject Manage ment Group (OMG) [1] has launched the various version of one of the most powerful platform independent modeling language i.e. Unified Modeling Language (UML). It contains various kinds of symbols for drafting a design on a piece of paper. In this connection, Booch and Rambaugh [2] have de- signed various diagrams for Unified Modeling Language. By the use of UML, the present work is based on the On Line Analytical Processing (OLAP) by designing the OLAP data cubes. The research on the design of three dimensional the d ata cubes is available in [3]. By the use of the various tools, one can design the OLAP data cubes. In the data cubes information in the form of data is stored along th e th re e a x es i.e. x, y an d z ax is and it su pports the object-oriented and structured technologies. In this work, the data were taken from the observations related to the ground water and municipal water supply of different localities of a city. Let us describe some of the important references related to the status of supp ly of water. In the current scenar io, surface water has polluted due to the various reasons overall known as the weather pollution. The different reasons and challenges in the water technology are described by Barua [4]. Drinking water standards are available in BIS [5], but in the dif- ferent localities of different cities, the drinking water is going to be polluted daily. This is because of unbalanced chloride and nitrate concentration. The sample database was analyzed on the basis of physiochemical parameters based on standard methods for analysis of water de- scribed by Clesceri et al. [6]. World Health Organization [7] has released the various guidelines for the drinking water. The present work deals with the storage of database related to ground and municipal water supply of drinking water. A concept of UML modeling is us ed for ex tracting the information called as Knowledge Discovery in Data- base (KDD) and it is useful when size of data becomes complex. A three dimensional representation of database in the form of data cubes is designed for storing the large *Corresponding author. C opyright © 2013 SciRes. CWEEE  T. ZAIDI ET AL. 78 database of ground water and municipal water supply. For demonstration purpose, a sample size of nine is con- sidered for storing this database in data cubes and sample queries were performed for the verification purpose. 2. Background 2.1. Unified Modeling Language UML is one of the powerful modeling languages and it is a platform independent. One can develop the code very easily by using the object-oriented programming lan- guage. It has two views of the problem called as the static and dynamic views. Both contains different types of the diagrams namely class, object diagrams represent the static view of the problem while activity, sequence and state diagrams show the dynamic view of the prob- lem. This modeling language has been developed by Ob- ject Management Group. 2.2. Online Analytical Processing (OLAP) Cube It is a multidimensional database which is used by soft- ware professionals for optimization of dataware houses. From the dataware houses, data cubes are designed and from the literature it is observed that three dimensional axes are used to design the data cubes and each cell represents the data which may be in the form of text, string or numerals forms. Multidimensional Expression (MDX) Language is used for representing the multidi- mensional database. The idea of OLAP cube is that it can work faster on the Local Area Network (LAN) or the distributed Wide Area Network (WAN) on which het- erogeneous collection of devices can work together. One can get the desired information within fraction of sec- onds. Really this is a great achievement in the field of the large database and anyone can perform any query and can get result quickly. 2.3. A Sample Database Database is a collection of the information and a real database is taken for ground and municipal water supply of the different localities of a city. For demonstration purpose, a sample size of nine is considered for the data- base related to ground and municipal water supply and observations [8] are based on the physical chemical cha- racteristics of ground and municipal water quality of va- rious localities of a city. The data is based upon the vi- cinity of the temperature 20˚C. PH was estimated using a potentiometer and it was calibrated using a buffer solution of PH 9.2, PH4 and PH7. Later about 100 ml of sample was taken in a 250 ml beaker and the electrode was dipped to get the PH value of the sample. For computation of total hardness as per following formula, about 25 ml sample was taken in a 100 ml flask and a pinch of Erichrome black-T was added to get a vine red colour. The sample was titrated with 0.01 M ethylene diamine tatra aceti Acid to a blue colour. Total hardness mglT1000xDV; (1) where; T = ml of EDTA used. D = mg of CaCo3 equivalent to 1 ml EDTA titrant (1 mg for 0.01 m EDTA used hear) therefore D = 1. V = Volume of water sample. For computation of alkalinity, 50 ml of sample was taken and 2 drops of phenolphthalein indicator was added. An absence of colour showed the presence total alkalinity but absence of phenolphthalein alkalinity. The sample was further titrated with 0.025% H2SO4 using mixed indicator. The colour of the solution became pinkat at end poin t. 3 Total al k alinity asmglCaCO TN501000 volume; (2) where; T = Volume of titrant used in ml. N = Normality of H2SO4. For computation of chloride, 10 ml of sample was taken in a 100 ml flask and 3 drops of k2CrO4 solution was added to give a yellow colou r. The sample was them titrated with (0.025 N) AgNO3 to get a brick red colour at end point. Chloride mglTN35.451000V (3) where; T = Volume of titrant used. N = Normality of titrant (AgNO3). V = Volume of Sample in ml. For estimation of Nitrate, 0.2 ml of clear sample was added with 0.5 ml 5% salicylic acid and 19 ml of 20% NaOH. A greenish yellow colour indicates the presence of nitrate which is estimated using a spectrophotometer at 410 nm wavelength. On all these aspects the practical results are computed and given in Tables 1 and 2, respectively for the ground and municipal water supply. 3. UML Modeling for KDD 3.1. UML Class Diagram In the object-oriented technology, UML class diagram shows the static behavior of the system. It can be drawn on a piece of paper and errors can be uncovered during the early stage of software development. Generally, software designer designs such type of diagram for im- plementation in the object-oriented programming style. A class is defined as group of attributes i.e. variables and Copyright © 2013 SciRes. CWEEE  T. ZAIDI ET AL. Copyright © 2013 SciRes. CWEEE 79 Table 1. Database of ground wat e r supply (table name: tblgws.ldf). Temperature (Kelvin) PH Total hardness (mg/lit) Total suspended solidsChloride (mg/lit)Total alkalinity (mg/lit) Nitrate (mg/lit) 293.15 7.77 180 0.035 42.5 190 33.4 294.15 7.76 180 0.032 28.4 200 16.4 294.65 7.7 200 0.035 85.1 214 18.1 294.95 7 180 0.03 28.4 192 53.2 295.15 7.05 220 0.035 70.9 234 37.9 295.15 7.3 140 0.28 121 198 26.6 294.15 7.6 180 0.36 21.3 228 12.7 294.15 7.5 160 0.34 35.5 180 31.1 294.44 7.46 180 0.1434 54.2 205 28.7 Table 2. Database of municipal water supply (table name : tblmws.ldf). Temperature (Kelvin) PH Total hardness (mg/lit) Total suspended solidsChloride (mg/lit)Total alkalinity (mg/lit) Nitrate (mg/lit) 294.15 8.25 60 0.02 14.18 110 20.36 295.15 8.1 216 0.043 14.18 196 25.17 295.55 7.98 200 0.036 21.27 192 25.17 295.55 7.53 200 0.032 21.27 180 24.6 296.55 7.1 180 0.03 70.94 212 23.19 296.15 7.3 180 0.3 121.4 210 27.9 295.15 7.99 200 0.39 21.27 196 14.9 295.15 8.09 160 0.32 21.27 204 17.81 294.44 7.792 174.5 0.1464 38.22 184.5 22.39 the methods applied on the attributes. The accessing of the attributes and methods may be private, public or pro- tected. AUML class diagram for accessing of the desired information is shown in the Figure 1. There are six classes namely User, Storage, Handheld devices, KDD, Data cubes and Search pattern. KDD class stands for the Knowledge Discovery Database. By the use of User class, user may login on the handheld device which may be laptop, I-pad, mobile, etc. The user desires to search knowledge database from a large database which is con- trolled by the class KDD. Search pattern class is respon- sible for the optimized search technique from the de- signed data cubes. The searching of the database is faster in comparison of the direct access from the database which is controlled by the Storage class as shown in the Figure 1. 3.2. UML State Diagram The dynamic behavior of the system is represent by the state diagram and in the object-oriented technology, UML state diagram represents the functioning of the clock of handheld device in which the events are hap- pening as per the forward clock of the device. Figure 2 shows the state diagram for the display of the desired information by the use of data cubes. Initially u ser enters its id and password on the hand-held device. A large da- tabase is converted into the Knowledge Discovery Data- base (KDD) and thereafter data cubes are designed and user can found the display of the desired database on the device. 4. Design of OLAP Cube The physiochemical characteristics of ground water and municipal water supply are stored in a three dimensional cubes. The three axis x, y, z are represented as hardness, chloride and nitrate, respectively. The database is re- corded in each cell of the cube represented along x, y and z axes. The cells can be increased for the finite values of hardness, chloride and nitrate. The above database is represented in the following data cubes for the ground 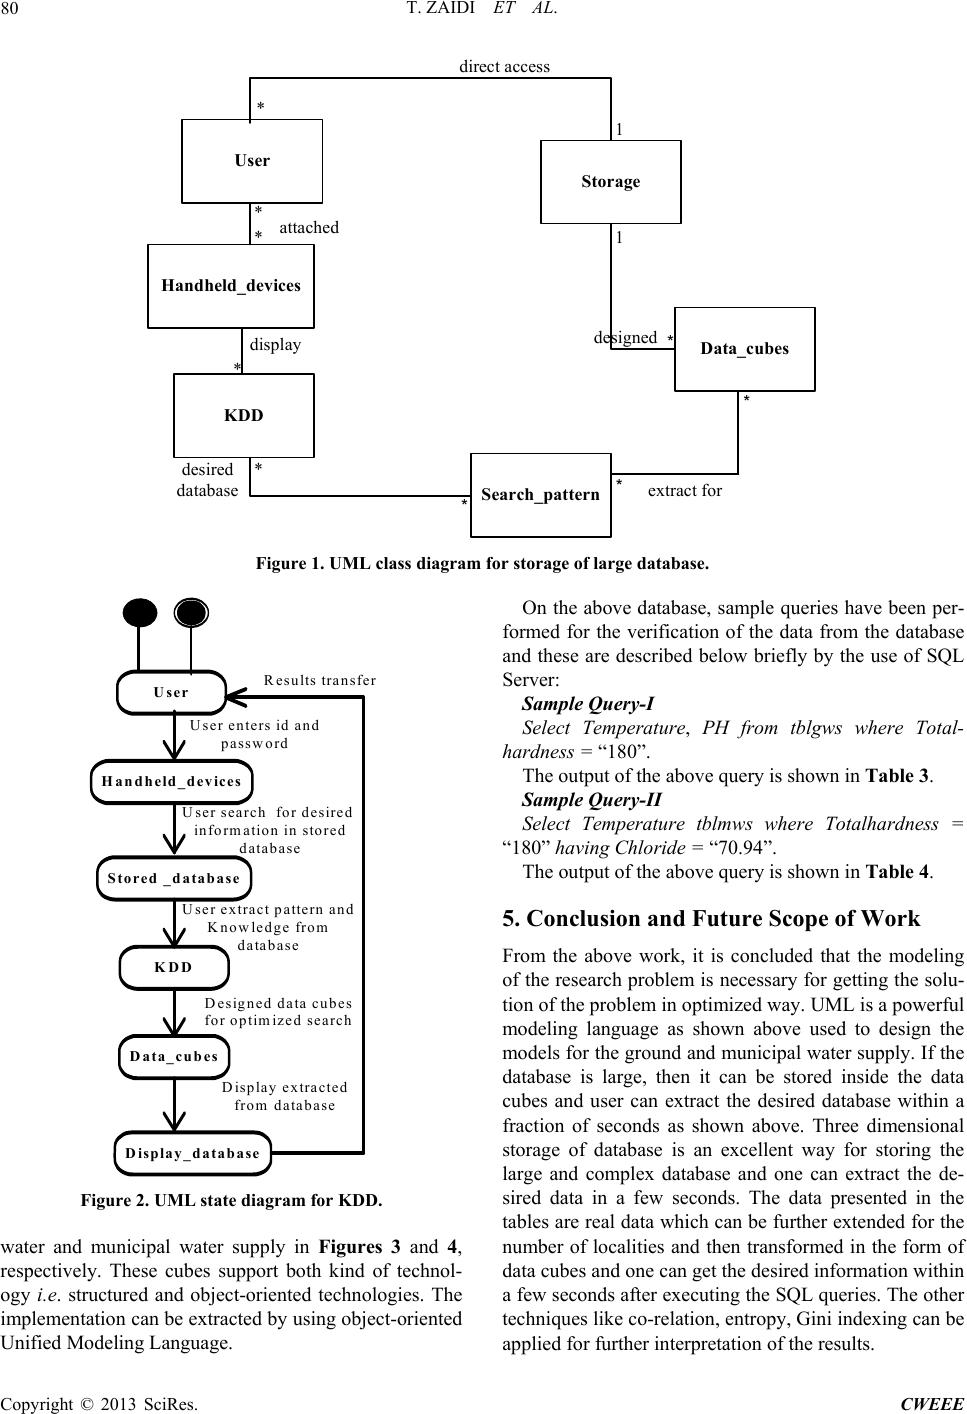 T. ZAIDI ET AL. 80 User Storage Data_cubes Search_pattern KDD Handheld_devices * direct ac c ess 1 1 designed * * *extract fo r * * desired database * display * *attached Figure 1. UML class diagram for storage of large database. User Handheld_devices U ser enters id and password Stored _database U ser search for desired information in stored database KDD U ser extract pattern and K now ledge from database Data_cubes D esigned da ta cubes for optimized search Display_database Display e x tra c te d from database R esults transfer Figure 2. UML state diagram for KDD. water and municipal water supply in Figures 3 and 4, respectively. These cubes support both kind of technol- ogy i.e. structured and object-oriented technologies. The implementation can be extracted by using object-oriented Unified Modeling Language. On the above database, sample queries have been per- formed for the verification of the data from the database and these are described below briefly by the use of SQL Server: Sample Query-I Select Temperature, PH from tblgws where Total- hardness = “180”. The output of the above query is shown in Table 3. Sample Query-II Select Temperature tblmws where Totalhardness = “180” having Chloride = “70.94”. The output of the above query is shown in Table 4. 5. Conclusion and Future Scope of Work From the above work, it is concluded that the modeling of the research problem is necessary for getting the solu- tion of the problem in optimized way. UML is a powerful modeling language as shown above used to design the models for the ground and municipal water supply. If the database is large, then it can be stored inside the data cubes and user can extract the desired database within a fraction of seconds as shown above. Three dimensional storage of database is an excellent way for storing the large and complex database and one can extract the de- sired data in a few seconds. The data presented in the tables are real data which can be further extended for the number of localities and then transformed in the form of data cubes and one can get the desired information within a few seconds after executing the SQL queries. The other techniques like co- relation , entropy, Gin i indexing can be applied for further interpretation of the results. Copyright © 2013 SciRes. CWEEE  T. ZAIDI ET AL. 81 Nitrate Chloride Hardness 33.4 16.4 18.153.2 37.9 42.5 28.4 85.1 28.4 180 180 180 200 Figure 3. Data cube for ground w a ter supply. Nitrate Chloride Hardness 14.18 14.18 21.27 21.27 20.36 25.1725.1724.1623.9 60 216 200 200 Figure 4. Data cube for municipal water supply. Table 3. Result of sample query-I. Temperature (Kelvin) PH Total hardness (mg/lit) Total suspended solidsChloride (mg/lit)Total alkalinity (mg/lit) Nitrate (mg/lit) 293.15 7.77 180 0.035 42.5 190 33.4 294.15 7.76 180 0.032 28.4 200 16.4 294.95 7 180 0.03 28.4 192 53.2 294.15 7.6 180 0.36 21.3 228 12.7 294.44 7.46 180 0.1434 54.2 205 28.7 Table 4. Result of sample query-II. Temperature (Kelvin) PH Total hardness (mg/lit) Total suspended solidsChloride (mg/lit)Total alkalinity (mg/lit) Nitrate (mg/lit) 296.55 7.1 180 0.03 70.94 212 23.19 Copyright © 2013 SciRes. CWEEE  T. ZAIDI ET AL. 82 6. Acknowledgements Thanks are due to University Grants Commission, New Delhi, India for providing financial assistance to carry out the above work. REFERENCES [1] Object Management Group, “Unified Modeling Language Specification,” 2012. http://www.omg.org [2] G. Booch and J. Rambaugh, “The Unified Modeling Lan- guage,” User Guide Addison Wesley, Reading, 1999. [3] Wikipedia, “OLAP Cube,” 2013. http://en.wikipedia.org/wiki/OLAP_cube [4] A K. Barua, “Water Technology Management Challenges and Choices in Sustainability of Water Use,” Dominant Publishers and Distributors, New Delhi, 2001, pp. 2-3. [5] Bureau of Indian Standards, “Indian Standard Specifica- tions of Drinking Water,” B.S. 2001. [6] J. A. Camargo and A. Alonso, “Ecological and Toxico- logical Effects of Inorganic Nitrogen Pollution in Aquatic Ecosystems: A Global Assessment,” Environment Inter- national, Vol. 32, No. 6, 2006, pp. 831-849. doi:10.1016/j.envint.2006.05.002 [7] L. S. Clesceri, et al., “Standard Methods for the Examina- tion of Water a nd Waste Water,” American Public Health Association, Washington DC, 1998, p. 19. [8] A. Singh, et al., “Status of Ground Water and Municipal Water Supply of Lucknow Region U.P.,” International Journal of Plant, Animal and Environmental Sciences, Vol. 2, No. 4, 2012, 4 Pages. Key Points Modeling is necessary to uncover the errors before implementing the so lution. UML is an object-oriented technique which can be applied in the biological systems also. UML shows the static and dynamic behavior of the system. OLAP data cubes are used to store the large amount of database as it supports LxMxN data storage for fi- nite values of L, M and N. Copyright © 2013 SciRes. CWEEE |