

Paper Menu >>
Journal Menu >>
 Circuits and Systems, 2013, 4, 245-251 http://dx.doi.org/10.4236/cs.2013.43033 Published Online July 2013 (http://www.scirp.org/journal/cs) A Home Appliance Recognition System Using the Approach of Measuring Power Consumption and Power Factor on the Electrical Panel, Based on Energy Meter ICs* Jefferson Z. Moro, Luís F. C. Duarte, Elnatan C. Ferreira, José A. Siqueira Dias Department of Electronic and Microelectronic, State University of Campinas, Campinas, Brazil Email: [email protected], [email protected], Received February 16, 2013; revised March 17, 2013; accepted March 25, 2013 Copyright © 2013 Jefferson Z. Moro et al. This is an open access article distributed under the Creative Commons Attribution License, which permits unrestricted use, distribution, and reproduction in any medium, provided the original work is properly cited. ABSTRACT Currently a large effort is being done with the intention to educate people about how much energy each electrical ap- pliance uses in their houses, since this knowledge is the fundamental basis of energy efficiency programs that can be managed by the household owners. This paper presents a simple yet functional non-intrusive method for electric power measurement that can be applied in energy efficiency programs, in order to provide a better knowledge of the energy consumption of the appliances in a home. Keywords: Energy Consumption; Energy Efficiency; Energy Metering; Power Measurement 1. Introduction An accurate knowledge of the electric loads and appli- ance recognition is the foundation to promote energy efficiency, since it generates benefits both to the custom- ers, who can manage the use of their appliances and ob- tain reduced costs in their electrical bills, and also for the utilities, which can optimize the operation and planning of the system [1]. Many techniques and methods have been used to meas- ure the appliances power consumption and monitor their states. One approach to acquire the appliances power consumption and their states is to make use of a wireless sensor network. In this case, every appliance in a house must be connected to a smart sensor that performs the power measurement. The information of all the smart meters is then concatenated and is sent to system that generates a report [2,3]. Another approach is to make use of a single intelligent power meter installed in the electric panel. This intelli- gent device monitors the power consumption of all ap- pliances and then processes the monitored signal to iden- tify the appliances based on load signatures. It minimizes the number of sensors needed to monitor all appliances and also reduces the complexity of the installation. Load Signature is an electrical expression that an ap- pliance distinctly possesses regarding its electrical be- haviour. It can be acquired from power consumption lev- els or from waveforms of electrical quantities such as voltage and current. Almost every electrical measure- ment can be treated as a load signature. It can be repre- sented in the time domain [4], in the frequency domain [5] and can also be represented mathematically in terms of wavelets, eigenvalues, or components of the Singular Value Decomposition (SVD) [6]. In [7] the authors proposed a methodology of using load signatures and Genetic Algorithms (GA) to identify electrical appliances from a composite load signal. They introduced a classification method to group the appli- ances and how to disaggregate the composite load signals by a GA identification process which is generated from a random combination of load signatures from the distinct groups of appliances. Recently a proposal for appliance recognition by measuring the power consumption of each circuit at the electrical panel distribution board has been presented [8]. The technique uses a sophisticated meter and based on the instantaneous measurements results of the energy meter and on expected behaviour of the residents of the house provides good results for the appliance recognition process. *This work was partially supported by CAPES. In this paper we propose the use of a similar approach C opyright © 2013 SciRes. CS 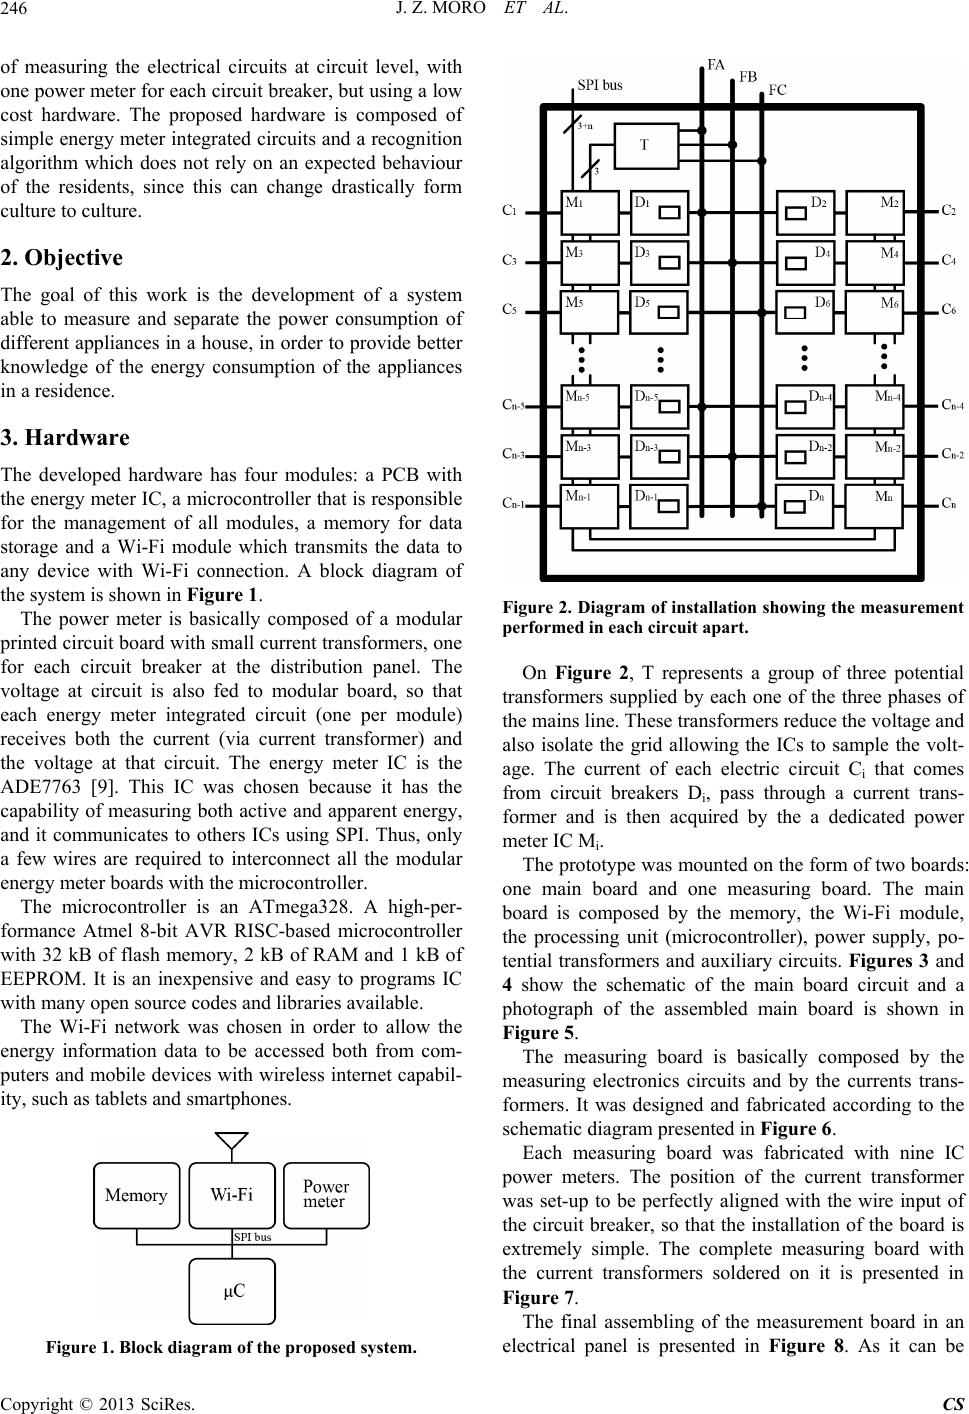 J. Z. MORO ET AL. 246 of measuring the electrical circuits at circuit level, with one power meter for each circuit breaker, but using a low cost hardware. The proposed hardware is composed of simple energy meter integrated circuits and a recognition algorithm which does not rely on an expected behaviour of the residents, since this can change drastically form culture to culture. 2. Objective The goal of this work is the development of a system able to measure and separate the power consumption of different appliances in a house, in order to provide better knowledge of the energy consumption of the appliances in a residence. 3. Hardware The developed hardware has four modules: a PCB with the energy meter IC, a microcontroller that is responsible for the management of all modules, a memory for data storage and a Wi-Fi module which transmits the data to any device with Wi-Fi connection. A block diagram of the system is shown in Figure 1. The power meter is basically composed of a modular printed circuit board with small current transformers, one for each circuit breaker at the distribution panel. The voltage at circuit is also fed to modular board, so that each energy meter integrated circuit (one per module) receives both the current (via current transformer) and the voltage at that circuit. The energy meter IC is the ADE7763 [9]. This IC was chosen because it has the capability of measuring both active and apparent energy, and it communicates to others ICs using SPI. Thus, only a few wires are required to interconnect all the modular energy meter boards with the microcontroller. The microcontroller is an ATmega328. A high-per- formance Atmel 8-bit AVR RISC-based microcontroller with 32 kB of flash memory, 2 kB of RAM and 1 kB of EEPROM. It is an inexpensive and easy to programs IC with many open source codes and libraries available. The Wi-Fi network was chosen in order to allow the energy information data to be accessed both from com- puters and mobile devices with wireless internet capabil- ity, such as tablets and smartphones. Figure 1. Block diagram of the proposed system. Figure 2. Diagram of installation showing the measurement performed in each circuit apart. On Figure 2, T represents a group of three potential transformers supplied by each one of the three phases of the mains line. These transformers reduce the voltage and also isolate the grid allowing the ICs to sample the volt- age. The current of each electric circuit Ci that comes from circuit breakers Di, pass through a current trans- former and is then acquired by the a dedicated power meter IC Mi. The prototype was mounted on the form of two boards: one main board and one measuring board. The main board is composed by the memory, the Wi-Fi module, the processing unit (microcontroller), power supply, po- tential transformers and auxiliary circuits. Figures 3 and 4 show the schematic of the main board circuit and a photograph of the assembled main board is shown in Figure 5. The measuring board is basically composed by the measuring electronics circuits and by the currents trans- formers. It was designed and fabricated according to the schematic diagram presented in Figure 6. Each measuring board was fabricated with nine IC power meters. The position of the current transformer was set-up to be perfectly aligned with the wire input of the circuit breaker, so that the installation of the board is extremely simple. The complete measuring board with the current transformers soldered on it is presented in Figure 7. The final assembling of the measurement board in an electrical panel is presented in Figure 8. As it can be Copyright © 2013 SciRes. CS 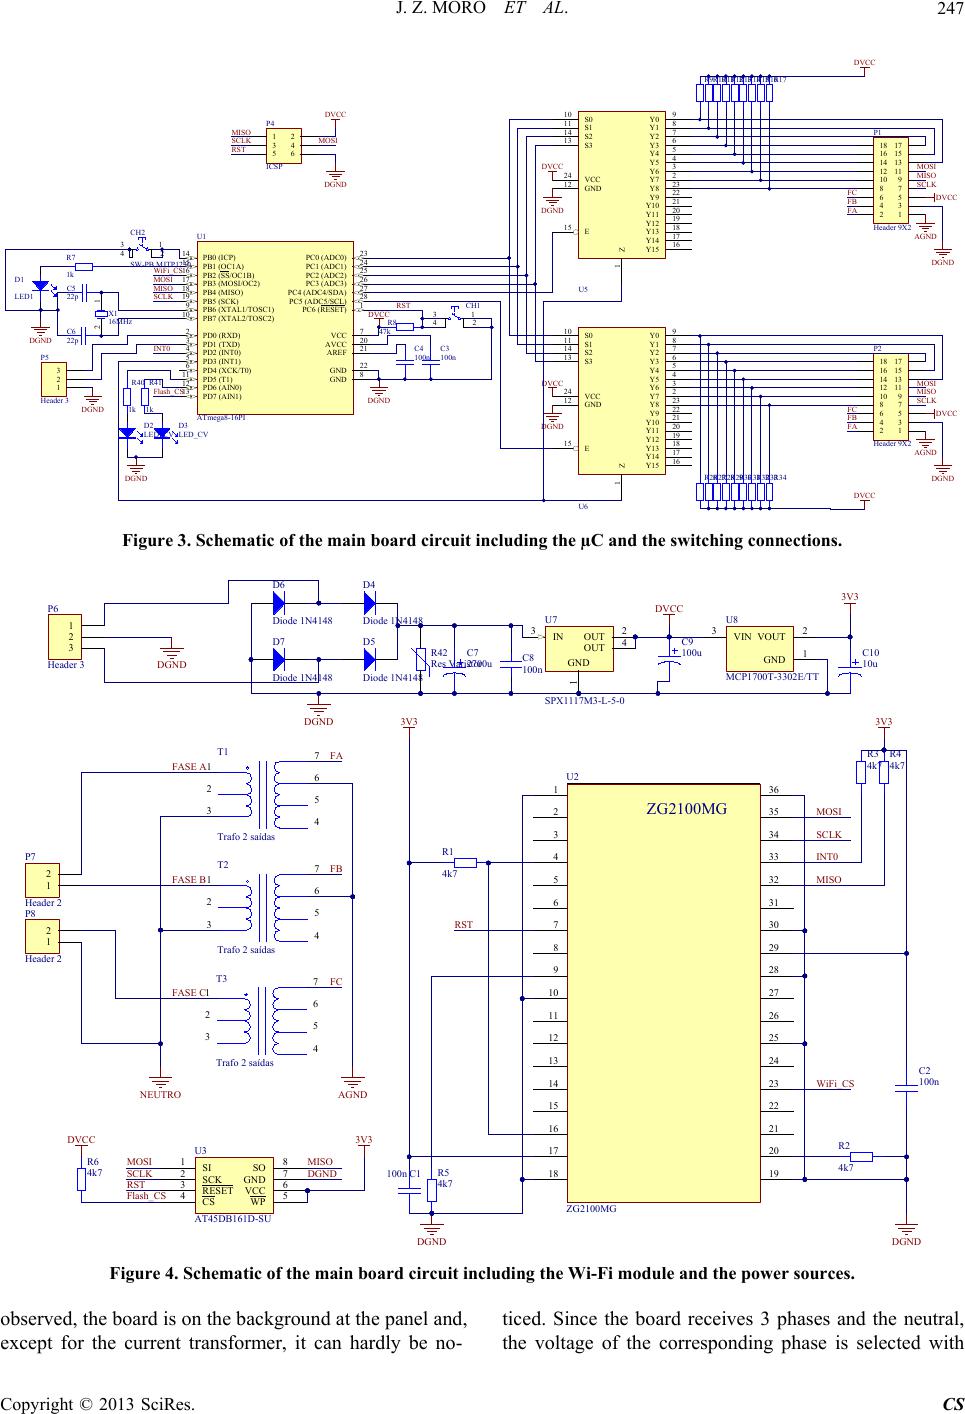 J. Z. MORO ET AL. Copyright © 2013 SciRes. CS 247 1k R7 Z 1 Y7 2 Y6 3 Y5 4 Y4 5 Y3 6 Y2 7 Y1 8 Y0 9 S0 10 S1 11 GND 12 S3 13 S2 14 E 15 Y15 16 Y14 17 Y13 18 Y12 19 Y11 20 Y10 21 Y9 22 Y8 23 VCC 24 U6 PC6 (RESET)1 PD0 (RXD) 2 PD1 (TXD) 3 PD2 (INT0) 4 PD3 (INT1) 5 PD4 (XCK/T0) 6 VCC 7 GND 8 PB6 (XTAL1/TOSC1) 9 PB7 (XTAL2/TOSC2) 10 PD5 (T1) 11 PD6 (AIN0) 12 PD7 (AIN1) 13 PB0 (ICP) 14 PB1 (OC1A) 15 PB2 (SS/OC1B) 16 PB3 (MOSI/OC2) 17 PB4 (MISO) 18 PB5 (SCK) 19 AVCC 20 AREF 21 GND 22 PC0 (ADC0)23 PC1 (ADC1)24 PC2 (ADC2)25 PC3 (ADC3)26 PC4 (ADC4/SDA)27 PC5 (ADC5/SCL)28 U1 ATmega8-16PI 12 34 56 78 910 1112 1314 1516 1718 P2 Header 9X2 DVCC DGND 12 34 56 78 910 1112 1314 1516 1718 P1 Header 9X2 Z 1 Y7 2 Y6 3 Y5 4 Y4 5 Y3 6 Y2 7 Y1 8 Y0 9 S0 10 S1 11 GND 12 S3 13 S2 14 E 15 Y15 16 Y14 17 Y13 18 Y12 19 Y11 20 Y10 21 Y9 22 Y8 23 VCC 24 U5 1 2 3 4 CH1 DVCC DGND 100n C3 100n C4 47k R8 22p C5 22p C6 12 X1 16MHz DGND DGND DVCC D1 LED1 AGND DGND DVCC WiFi_CS MOSI MISO SCLK MOSI MISO SCLK FC FB FA DVCC AGND FC FB FA MOSI MISO SCLK 1 2 3 4 5 6 P4 ICSP DVCC DGND MOSI MISO SCLK RST RST R11R12R13R14R15R16R17R9R10 R26R27R28R29R30R31R32R33R34 DGND DVCC DVCC 1 2 3 P5 Header 3 DGND INT0 Flash_CS 1 2 3 4 CH2 SW-PB MJTP1230 DGND D2 LED_CV D3 LED_CV 1k R40 1k R41 Figure 3. Schematic of the main board circuit including the µC and the switching connections. D4 Diode 1N4148 D5 Diode 1N4148 DVCC 3V3 DGND 1 2 3 4 5 6 7 T1 Trafo 2 saídas AGNDNEUTRO FASE A FASE B FASE C 2700u C7 100u C9 C8 100n 10u C10 1 2 3 4 5 6 7 T2 Trafo 2 saídas 1 2 3 4 5 6 7 T3 Trafo 2 saídas FA FB FC OUT 4 IN 3 1 GND OUT 2 U7 SPX1117M3-L-5-0 GND 1 VOUT 2 VIN 3 U8 MCP1700T-33 02E/TT D6 Diode 1N4148 D7 Diode 1N4148 1 2 3 P6 Header 3DGND 1 2 P7 Header 2 1 2 P8 Header 2 R42 Res Varistor GND 1 VDD_1.8 2 JTAG_TDO 3 JTAG_TCK 4 JTAG_TMS 5 JTAG_TDI 6 RST_N 7 DNC 8 JTAG_RST_N 9 GND 10 VDD_1.8 11 DNC 12 DNC 13 DNC 14 DNC 15 RES 16 VDD_3.3 17 GND 18 GND 19 CE_N 20 JTAG_EN 21 DNC 22 SCS_N 23 VDD_1.8 24 GND 25 UART_RX 26 UART_TX 27 GND 28 VDD_3.3 29 GND 30 VDD_1.8 31 SDO 32 INT_NX 33 SCK 34 SDI 35 GND 36 ZG2100MG U2 ZG2100MG SI 1 SCK 2 RESET 3 CS 4WP 5 VCC 6 GND 7 SO 8 U3 AT45DB161D-S U DGND DGND 3V33V3 100n C1 100n C2 4k7 R1 4k7 R2 4k7 R3 4k7 R4 4k7 R5 4k7 R6 MOSI SCLK INT0 MISO WiFi_ CS RST DVCC MOSI SCLK RST Flash_CS MISO DGND 3V3 Figure 4. Schematic of the main board circuit including the Wi-Fi module and the power sources. observed, the board is on the background at the panel and, except for the current transformer, it can hardly be no- ticed. Since the board receives 3 phases and the neutral, he voltage of the corresponding phase is selected with t 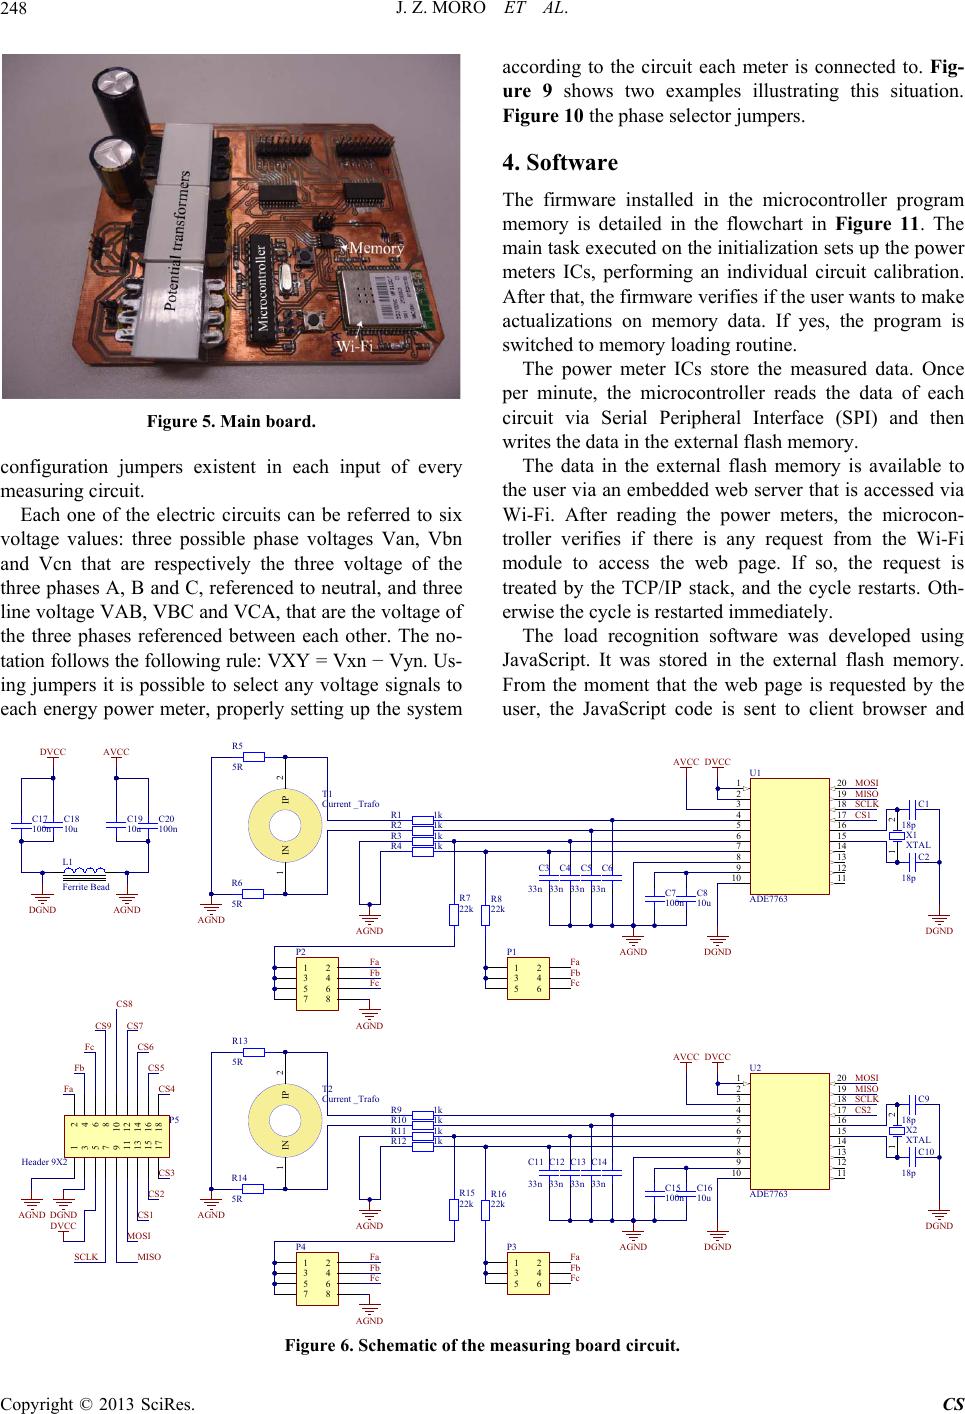 J. Z. MORO ET AL. 248 Copyright © 2013 SciRes. CS Figure 5. Main board. configuration jumpers existent in each input of every measuring circuit. Each one of the electric circuits can be referred to six voltage values: three possible phase voltages Van, Vbn and Vcn that are respectively the three voltage of the three phases A, B and C, referenced to neutral, and three line voltage VAB, VBC and VCA, that are the voltage of the three phases referenced between each other. The no- tation follows the following rule: VXY = Vxn − Vyn. Us- ing jumpers it is possible to select any voltage signals to each energy power meter, properly setting up the system according to the circuit each meter is connected to. Fig- ure 9 shows two examples illustrating this situation. Figure 10 the phase selector jumpers. 4. Software The firmware installed in the microcontroller program memory is detailed in the flowchart in Figure 11. The main task executed on the initialization sets up the power meters ICs, performing an individual circuit calibration. After that, the firmware verifies if the user wants to make actualizations on memory data. If yes, the program is switched to memory loading routine. The power meter ICs store the measured data. Once per minute, the microcontroller reads the data of each circuit via Serial Peripheral Interface (SPI) and then writes the data in the external flash memory. The data in the external flash memory is available to the user via an embedded web server that is accessed via Wi-Fi. After reading the power meters, the microcon- troller verifies if there is any request from the Wi-Fi module to access the web page. If so, the request is treated by the TCP/IP stack, and the cycle restarts. Oth- erwise the cycle is restarted immediately. The load recognition software was developed using JavaScript. It was stored in the external flash memory. From the moment that the web page is requested by the user, the JavaScript code is sent to client browser and RESET 1 DVDD 2 AVDD 3 V1P 4 V1N 5 V2N 6 V2P 7 AGND 8 REF 9 DGND 10 CF 11 ZX 12 SAG 13 IRQ 14 CLKIN 15 CLKOUT 16 CS 17 SCLK 18 MISO 19 MOSI 20 U1 ADE7763 DGND DVCCAVCC AGND AGND 1 2 X1 XTAL DGND AVCCDVCC AGNDDGND C2 18p C1 18p C17 100n C20 100n C8 10u C19 10u C18 10u C7 100n L1 Ferrite Bead Fa Fb Fc AGND MOSI MISO SCLK CS1 AGND AGND DGND DVCC Fa Fb Fc CS3 CS2 CS1 CS4 1 2 3 4 5 6 P1 1 2 3 4 5 6 7 8 P2 RESET 1 DVDD 2 AVDD 3 V1P 4 V1N 5 V2N 6 V2P 7 AGND 8 REF 9 DGND 10 CF 11 ZX 12 SAG 13 IRQ 14 CLKIN 15 CLKOUT 16 CS 17 SCLK 18 MISO 19 MOSI 20 U2 ADE7763 DGND DVCCAVCC AGND AGND 1 2 X2 XTAL DGND C10 18p C9 18p C16 10u C15 100n Fa Fb Fc AGND MOSI MISO SCLK CS2 AGND 1 2 3 4 5 6 P3 1 2 3 4 5 6 7 8 P4 IN 1IP 2 T1 Current _Trafo IN 1IP 2 T2 Current _Trafo CS6 CS5 CS7CS9 MISO CS8 MOSI SCLK 1 2 3 4 5 6 7 8 910 11 12 13 14 15 16 17 18 P5 Header 9X2 Fa Fb Fc Fa Fb Fc 1kR1 1kR2 1kR3 1kR4 5R R5 5R R6 22k R7 22k R8 1k R9 1k R10 1kR11 1kR12 5R R13 5R R14 22k R15 22k R16 C3 33n C4 33n C5 33n C6 33n C11 33n C12 33n C13 33n C14 33n Figure 6. Schematic of the measuring board circuit. 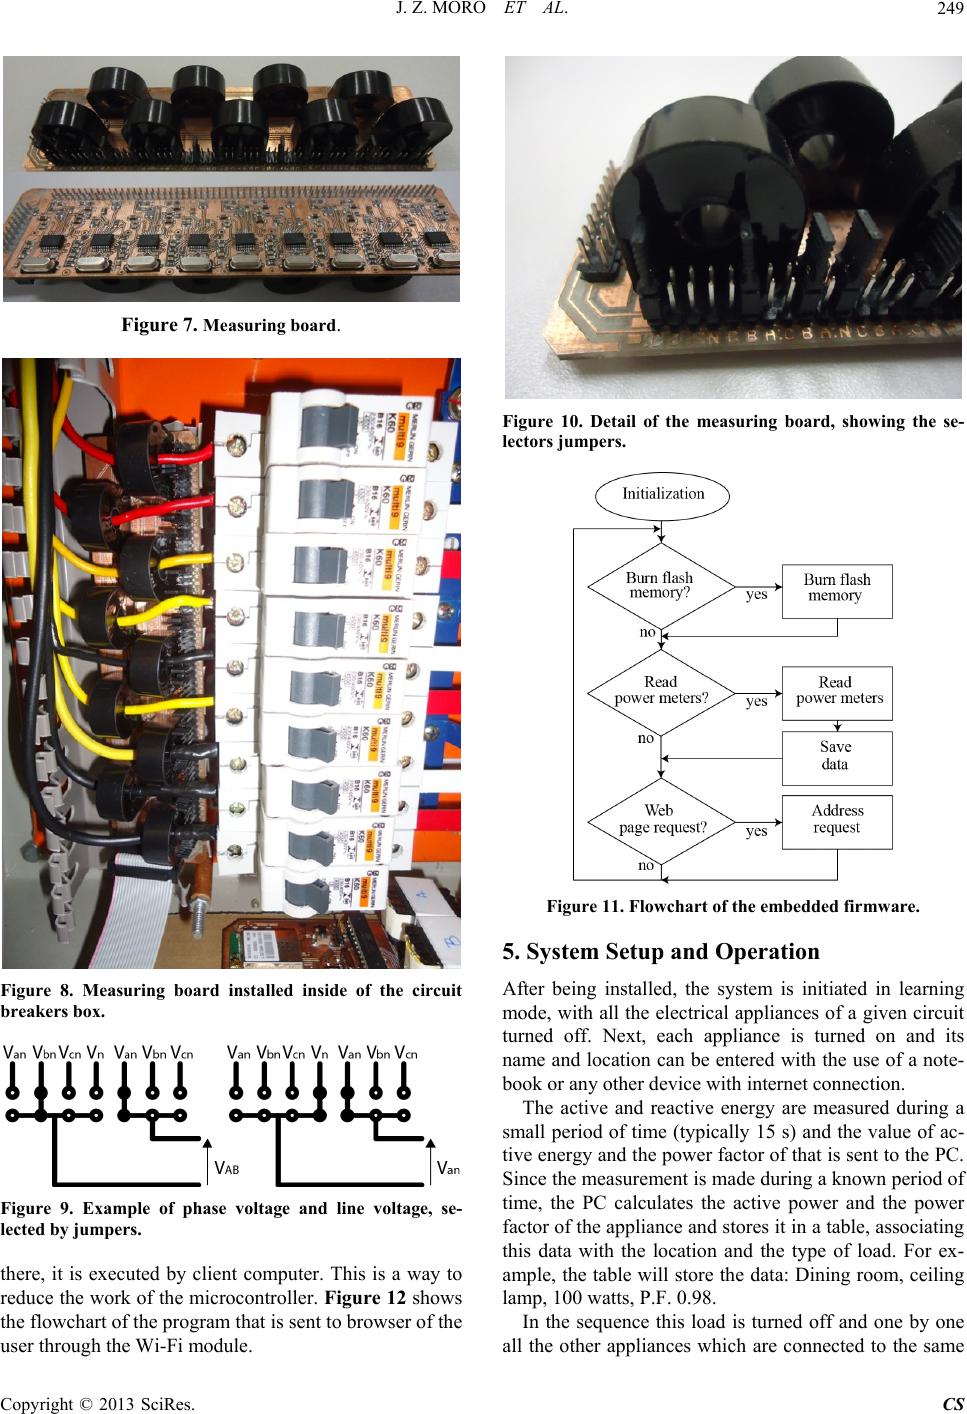 J. Z. MORO ET AL. 249 Figure 7. Measuring board. Figure 8. Measuring board installed inside of the circuit breakers box. Figure 9. Example of phase voltage and line voltage, se- lected by jumpers. there, it is executed by client computer. This is a way to reduce the work of the microcontroller. Figure 12 shows the flowchart of the program that is sent to browser of the user through the Wi-Fi module. Figure 10. Detail of the measuring board, showing the se- lectors jumpers. Figure 11. Flowchart of the embedded firmware. 5. System Setup and Operation After being installed, the system is initiated in learning mode, with all the electrical appliances of a given circuit turned off. Next, each appliance is turned on and its name and location can be entered with the use of a note- book or any other device with internet connection. The active and reactive energy are measured during a small period of time (typically 15 s) and the value of ac- tive energy and the power factor of that is sent to the PC. Since the measurement is made during a known period of time, the PC calculates the active power and the power factor of the appliance and stores it in a table, associating this data with the location and the type of load. For ex- ample, the table will store the data: Dining room, ceiling lamp, 100 watts, P.F. 0.98. In the sequence this load is turned off and one by one all the other appliances which are connected to the same Copyright © 2013 SciRes. CS 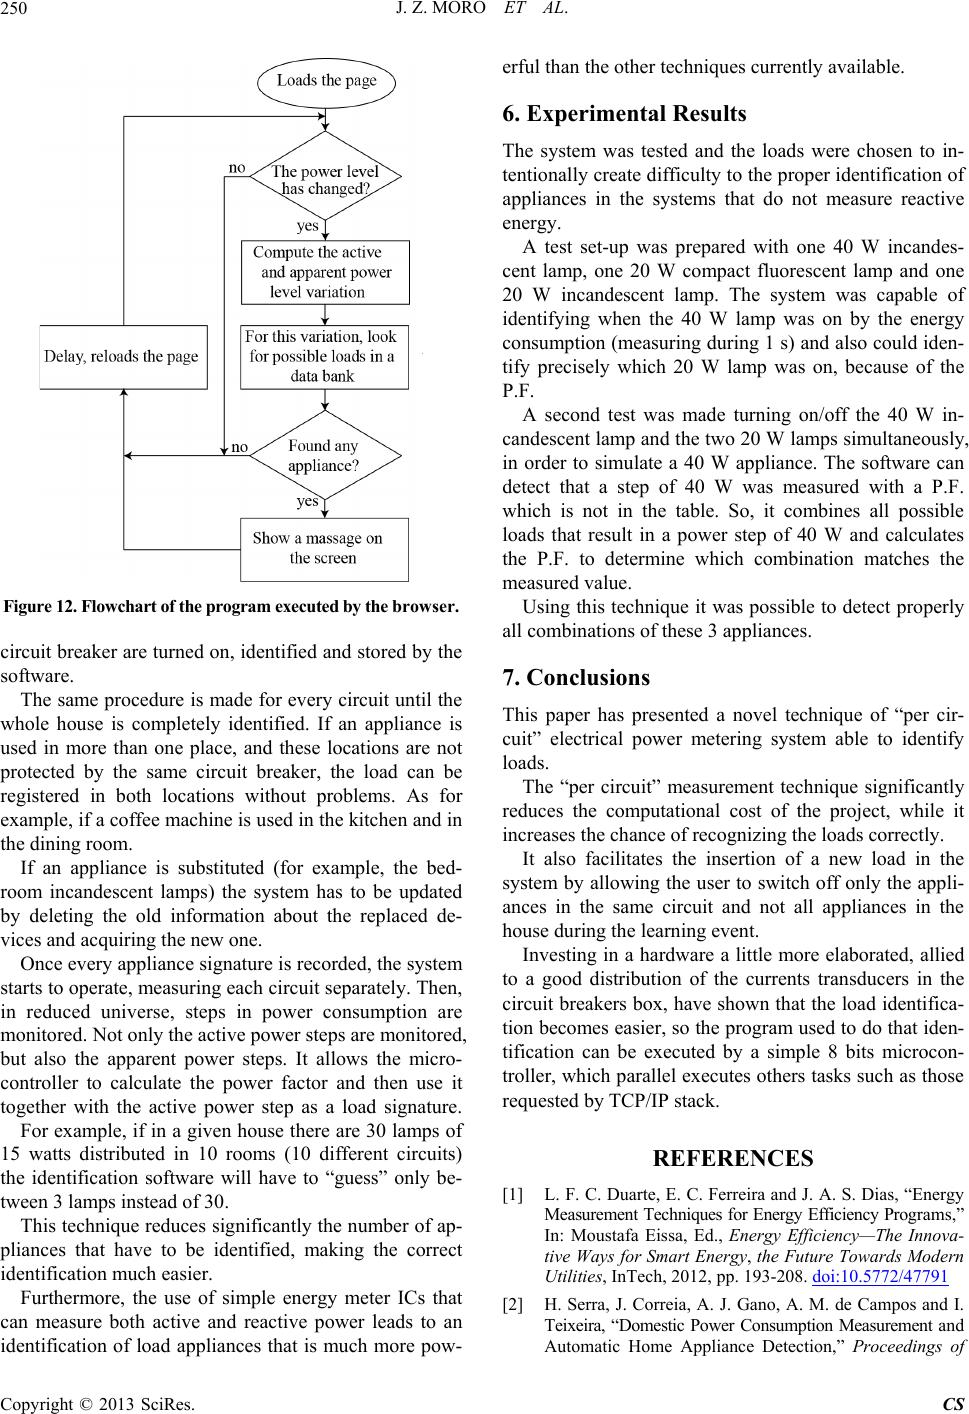 J. Z. MORO ET AL. 250 Figure 12. Flowchart of the program executed by the browser. circuit breaker are turned on, identified and stored by the software. The same procedure is made for every circuit until the whole house is completely identified. If an appliance is used in more than one place, and these locations are not protected by the same circuit breaker, the load can be registered in both locations without problems. As for example, if a coffee machine is used in the kitchen and in the dining room. If an appliance is substituted (for example, the bed- room incandescent lamps) the system has to be updated by deleting the old information about the replaced de- vices and acquiring the new one. Once every appliance signature is recorded, the system starts to operate, measuring each circuit separately. Then, in reduced universe, steps in power consumption are monitored. Not only the active power steps are monitored, but also the apparent power steps. It allows the micro- controller to calculate the power factor and then use it together with the active power step as a load signature. For example, if in a given house there are 30 lamps of 15 watts distributed in 10 rooms (10 different circuits) the identification software will have to “guess” only be- tween 3 lamps instead of 30. This technique reduces significantly the number of ap- pliances that have to be identified, making the correct identification much easier. Furthermore, the use of simple energy meter ICs that can measure both active and reactive power leads to an identification of load appliances that is much more pow- erful than the other techniques currently available. 6. Experimental Results The system was tested and the loads were chosen to in- tentionally create difficulty to the proper identification of appliances in the systems that do not measure reactive energy. A test set-up was prepared with one 40 W incandes- cent lamp, one 20 W compact fluorescent lamp and one 20 W incandescent lamp. The system was capable of identifying when the 40 W lamp was on by the energy consumption (measuring during 1 s) and also could iden- tify precisely which 20 W lamp was on, because of the P.F. A second test was made turning on/off the 40 W in- candescent lamp and the two 20 W lamps simultaneously, in order to simulate a 40 W appliance. The software can detect that a step of 40 W was measured with a P.F. which is not in the table. So, it combines all possible loads that result in a power step of 40 W and calculates the P.F. to determine which combination matches the measured value. Using this technique it was possible to detect properly all combinations of these 3 appliances. 7. Conclusions This paper has presented a novel technique of “per cir- cuit” electrical power metering system able to identify loads. The “per circuit” measurement technique significantly reduces the computational cost of the project, while it increases the chance of recognizing the loads correctly. It also facilitates the insertion of a new load in the system by allowing the user to switch off only the appli- ances in the same circuit and not all appliances in the house during the learning event. Investing in a hardware a little more elaborated, allied to a good distribution of the currents transducers in the circuit breakers box, have shown that the load identifica- tion becomes easier, so the program used to do that iden- tification can be executed by a simple 8 bits microcon- troller, which parallel executes others tasks such as those requested by TCP/IP stack. REFERENCES [1] L. F. C. Duarte, E. C. Ferreira and J. A. S. Dias, “Energy Measurement Techniques for Energy Efficiency Programs,” In: Moustafa Eissa, Ed., Energy Efficiency—The Innova- tive Ways for Smart Energy, the Future Towards Modern Utilities, InTech, 2012, pp. 193-208. doi:10.5772/47791 [2] H. Serra, J. Correia, A. J. Gano, A. M. de Campos and I. Teixeira, “Domestic Power Consumption Measurement and Automatic Home Appliance Detection,” Proceedings of Copyright © 2013 SciRes. CS  J. Z. MORO ET AL. Copyright © 2013 SciRes. CS 251 2005 IEEE International Workshop Intelligent Signal Pro c- essing, 1-3 September 2005, pp. 128-132. [3] L. F. C. Duarte, J. D. Zambianco, D. Airoldi, E. C. Ferreira and J. A. S. Dias, “Characterization and Break- down of the Electricity Bill Using Custom Smart Meters: A Tool for Energy-Efficiency Programs,” International Journal of Circuits, Systems and Signal Processing, Vol. 5, No. 2, 2011, pp. 116-123. [4] C. Laughman, K. Lee, R. Cox, S. Shaw, S. Leeb, L. Nor- ford and P. Armstrong, “Power Signature Analysis,” IEEE Power and Energy Magazine, Vol. 1, No. 2, 2003, pp. 56- 63. doi:10.1109/MPAE.2003.1192027 [5] J. Duan, D. Czarkowski and Z. Zabar, “Neural Network Approach for Estimation of Load Composition,” IEEE International Symposium on Circuit and Systems (ISCAS), New York, 23-26 May 2004, pp. 988-991. [6] W. K. Lee, G. S. K. Fung, H. Y. Lam and F. H. Y. Chan, “Exploration on Load Signatures,” Proceedings of Inter- national Conference on Electrical Engineering (ICEE), 2004. http://lucente.us/db/pubs/ICEE2004Signature-reprint.pdf [7] J. S. K. Leung, K. S. H. Ng and J. W. M. Cheng, “Identi- fying Appliances Using Load Signatures and Genetic Algorithms,” Proceedings of International Conference on Electrical Engineering (ICEE), 2007. http://www.icee-con.org/papers/2007/Oral_Poster%20Pa pers/01/ICEE-031.pdf [8] G. Lin, S. Lee, J. Y. Hsu and W. Jih, “Applying Power Meters for Appliance Recognition on the Electric Panel,” Proceedings of the 5th IEEE Conference on Industrial Electronics and Applications (ICIEA), Taichung, 15-17 June 2010, pp. 2254-2259. [9] Analog Devices, “ADE7763 Data Sheet,” Single-Phase Active and Apparent Energy Metering IC, 2009. |