

Paper Menu >>
Journal Menu >>
 Advances in Applied Sociology 2013. Vol.3, No.2, 157-163 Published Online June 2013 in SciRes (http://www.scirp.org/journal/aasoci) http://dx.doi.org/10.4236/aasoci.2013.32021 Copyright © 2013 SciRe s . 157 Trends and Determinants of Unmet Need for Family Planning in Bihar (India): Evidence from National Family Health Surveys Amit Kumar1, Aditya Singh2 1International Institute for Population Sciences, Mumbai, India 2School of Health Sciences and Social Work, University of Portsmouth, Portsm outh, UK Email: [email protected] Received January 22nd, 2013; revised Februa ry 24th, 2013; accepted March 2nd, 2013 Copyright © 2013 Amit Kumar, Aditya Singh. This is an open access article distributed under the Creative Commons Attribution License, which permits unrestricted use, distribution, and reproduction in any medium, provided the original work is properly cited. Using data from all three rounds of the National Family Health Survey, this study examines the trends and determinants of unmet need for family planning in the state of Bihar. Bivariate analysis was carried out to examine the level and trends of unmet need for family. Binary logistic regression was used to examine the factor affecting unmet need for family planning. About 25% of the currently married women, aged 15 - 49 years, in Bihar at present have an unmet need for family planning services, 11% for spacing and 12% for limiting. Only 18% of total demand for spacing methods is met compared to about 72% of total demand for limiting methods. The unmet need for family planning among Muslim (32%), rural (24%) and adoles- cent (36%) and poor women (26%) is relatively higher than other groups. “Religious prohibition” and “husband opposed” were the main reasons for not using contraception. A considerable proportion of older women (45 - 49 years) and those living in urban areas cited method-related reasons. About 86% of Mus- lim women cited opposition to use as the main reason for not using family planning. The same is also sub- stantiated by logistic regression analysis where the odds of unmet need were significantly higher among Muslim women (OR = 1.88; p < 0.05). Women from Other Backward Castes (OR = 0.74; p = 0.05) and rich households (OR = 0.55; p = 0.00) had lower odds of unmet need for family planning. The results highlight the need of an effective implementation of information, education and communication activities in the communities and improvement in the quality of advice and care services related to family planning. Family planning policies and programs in Bihar should focus on reaching out to the women from disad- vantaged groups such as adolescent, Muslim, poor and Scheduled Caste. Keywords: Family Planning; Unmet Need; Fertility; Bihar; National Family Health Survey Introduction The world fertility has been declining steadily since 1950s with major contributions from the declines that took place in China and India (Wilson, 2001). India, being the second largest country in the world in terms of population, was worried about it population growth in the wake of mortality decline and sub- sequent rise in life expectancy in the post-independence period (Visaria & Chari, 1998). This led to the implantation of the first-ever official family planning program in the world by the Government of India in 1952. The result was obvious in the form of the beginning of fertility decline in India in the first half of 1960s. However, some northern and central Indian states such as Uttar Pradesh, Bihar, Rajasthan and Madhya Pradesh could not be the part of the process until 1980. In fact, their current total fertility rates are still relatively very high (Guil- moto & Rajan, 2004; Balabdaoui et al., 2001). High fertility levels not only have several adverse implications for societies but also for individuals. Since these states constitute a great chunk of India’s population, they are the major players that would determine future socioeconomic and demographic situa- tion of the country. Hence, quick and substantial reduction in fertility in low resource settings, such as these states, is a highly desirable goal. What works best for achieving maximum reduction in fertil- ity is still a much-debated issue. However, previous studies conducted in different settings around the world have estab- lished the fact that contraception is one of the most important proximate determinants of fertility (Sibanda et al., 2003; Karki & Krishna, 2008; Bongaarts et al., 1984). Similarly, several studies in India too have examined the fertility decline and the factors catalysing such decline in India and its states (Visaria, 1999; Bhattacharya et al., 1995; Pathak et al., 1998; Aroki- asamy, 2009; Jain A. K. & Jain A., 2010). It is well established now that increased contraceptive use explains much, but not all, of the recent fertility decline in India and its states as well. Family planning being a viable solution to control such fast growing populations, not only helps in spacing and limiting the number of children, but also improves maternal and child health, empowers women and boosts economic development. However, a large proportion of women from reproductive ages who want to stop or space childbearing are unable to use family planning methods. Demographers and health specialists refer to these women as having an “unmet need” for family planning. Limited access to family planning results in high rates of unintended pregnancies, millions of unsafe abortions and thousands of  A. KUMAR, A. SINGH maternal deaths (Bradley et al., 2012). The unmet need for fam- ily planning is defined as the proportion of married women of reproductive age who are not using any method but would like to postpone the next pregnancy i.e. unmet need for spacing or who do not want any more children i.e. unmet need for limiting (Westoff, 1988). Thus, unmet need for family planning is a discrepancy between expressed fertility goals and contraceptive practice. Many studies in the past in India and elsewhere have found that women with unmet need for family planning constitute a significant fraction of all married women of reproductive age (Bradley et al., 2012; Ojakaa, 2008; Pasha et al., 2001). Ac- cording to an estimate, more than 100 million sexually active women in developing countries would like to adopt family planning but they are not able to. Asia, owing to its huge popu- lation, is by far the region with the greatest number of women with unmet need of contraception. Kishore (2007) estimated that India has about 31 million of women with unmet need for family planning (Kishore, 2007), despite the existence of the National Policy on Family Planning since the year 1983. Bihar is the focus of this study for several reasons. It is the third most populated state of India with approximately 9% (about 10 billion as of 2011) of the total population. It is the poorest state of the country, with the exception of Orissa, and ranked among the slowest growing regions of the country until recently. High maternal and child mortality, low life expectancy, high fertility, high unmet need for contraception, low literacy rate, low coverage of child immunization and high child mal- nutrition (ORGI, 2012; IIPS & ORC Macro, 2007). Among four high fertility states mentioned above, Bihar is the one that has shown a near stall in fertility decline in the post-1997 pe- riod. The low rate of contraceptive use and high level of fertil- ity in Bihar are of considerable concern to the Indian Govern- ment, which has launched innovations in family planning ser- vices project intended to increase contraceptive use in the state. According to NFHS-III (2005-2006), about 24% of currently married women in Bihar have unmet need for family planning, which is comparatively much higher than that of India as a whole (IIPS & ORC Macro, 2007). Unfortunately, a very little research has focused on systematic documentation of unmet need for family planning in the state. A comprehensive study of unmet need in the state is highly desirable in order to develop a locally relevant and suitable strategy to overcome the problems of unmet need on priority basis. Hence, this study aims to ex- amine the trends and determinants of unmet need for family planning in the state of Bihar. Data and Methods Data We use data from all three rounds of the National Family Health Survey (NFHS), a nationally representative survey, car- ried out during 1992-1993, 1998-1999 and 2005-2006. The main purpose of the survey is to provide reliable estimate of fertility, infant and childhood mortality, nutritional status of children, utilization of maternal and child health care services, at national level, state level and separately for urban and rural area. All three rounds of the survey adopted multi-stage sam- pling design—two stage sampling design in rural areas and three-stage in urban areas. The sampling design remained simi- lar in all the three rounds of the surveys, which allow a com- parison with the estimates of the consecutive rounds. The de- tails of sampling design and sample size estimation are pro- vided in the reports of the various rounds of the NFHS (IIPS & ORC Macro, 1995, 2000, 2007). The NFHS collected data using different interview schedules —household schedule and eligible women/individual schedule. The content of the interview schedules remained similar in all the three rounds of the survey. In Bihar, the survey collected information from 4659 women in first round (NFHS-I con- ducted in 1992-1993), 5410 women in second round (NFHS-II 1998-1999) and 3818 women in third round (NFHS-III con- ducted in 2005-2006). The household response rate was 99% in the first round, 98 % and 99% each in the second and third rounds of the survey. Similarly, the individual response rate was 95.5% and 94.7 % each in the first and second rounds, while it was 97% in the third round of the survey. Outcome Vari able Our outcome variable is unmet need for family planning. We have adopted our definition for this study from the NFHS-III national report. The definition used in this study remains same across the three rounds of NFHS survey. According to the re- port, unmet need can be of two types—unmet need for spacing and unmet need for limiting. The sum of the unmet need for limiting and the unmet need for spacing is the total unmet need for family planning. The total demand for family planning is the sum of unmet need and met need (IIPS & ORC Macro, 2007). Unmet need for spacing includes pregnant women whose pregnancy was mistimed; amenorrhoeic women who are not using family planning and whose last birth was mistimed, or whose last births was unwanted but now say they want more children; and fecund women who are neither pregnant nor amenorrhoeic, who are not using any method of family plan- ning, and say they want to wait two or more years for their next birth. Also included in unmet need for spacing are fecund women who are not using any method of family planning and say they are unsure whether they want another child or who want another child but are unsure when to have the birth (IIPS & ORC Macro, 2007). Unmet need for limiting refers to pregnant women whose pregnancy was unwanted; amenorrhoeic women who are not using family planning, whose last child was unwanted and who did not want any more children; and fecund women who are neither pregnant nor amenorrhoeic, who are not using any method of family planning, and who want no more children. Excluded from the unmet need categories are pregnant and amenorrhoea women who became pregnant while using a method (these women are in need of a better method of contra- ception) (IIPS & ORC Macro, 2007). Predictor Variables We use a range of socio-demographic variables in the analy- sis that have been found to be significantly associated with unmet need for family planning in India and elsewhere. These variables are—respondent’s age (five years of age-interval), place of residence (urban; rural), religion (Hindu; Muslim; Other), caste (Scheduled Caste—SC; Other Backward Castes— OBC; Others), mother’s exposure to media (yes; no), current working status of mother (yes; no), age at marriage in years Copyright © 2013 SciRe s . 158 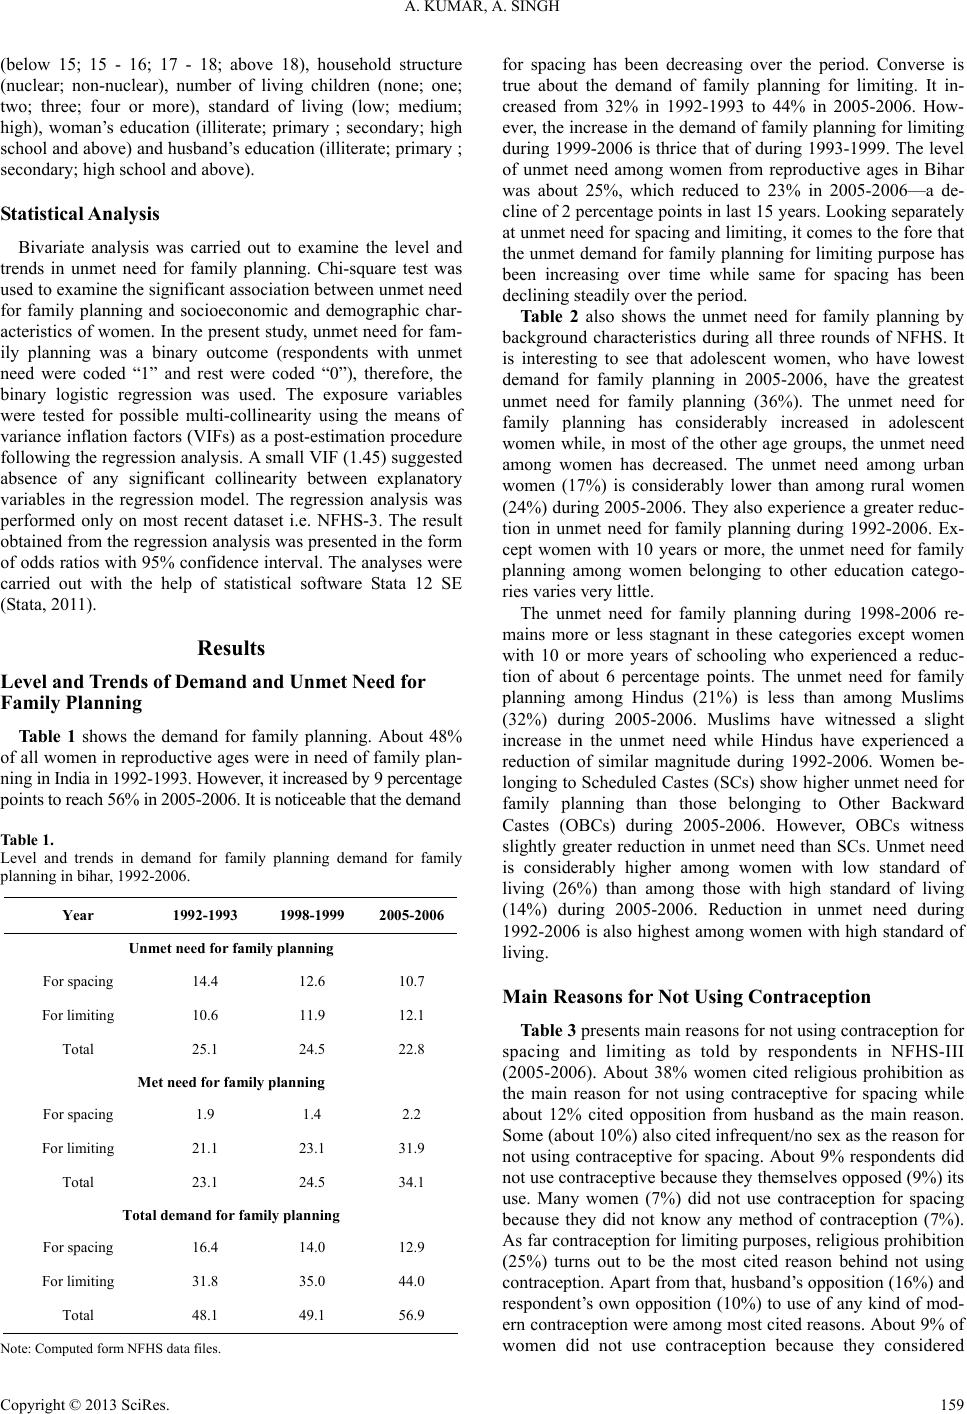 A. KUMAR, A. SINGH (below 15; 15 - 16; 17 - 18; above 18), household structure (nuclear; non-nuclear), number of living children (none; one; two; three; four or more), standard of living (low; medium; high), woman’s education (illiterate; primary ; secondary; high school and above) and husband’s education (illiterate; primary ; secondary; high school and above). S tatistical Analysis Bivariate analysis was carried out to examine the level and trends in unmet need for family planning. Chi-square test was used to examine the significant association between unmet need for family planning and socioeconomic and demographic char- acteristics of women. In the present study, unmet need for fam- ily planning was a binary outcome (respondents with unmet need were coded “1” and rest were coded “0”), therefore, the binary logistic regression was used. The exposure variables were tested for possible multi-collinearity using the means of variance inflation factors (VIFs) as a post-estimation procedure following the regression analysis. A small VIF (1.45) suggested absence of any significant collinearity between explanatory variables in the regression model. The regression analysis was performed only on most recent dataset i.e. NFHS-3. The result obtained from the regression analysis was presented in the form of odds ratios with 95% confidence interval. The analyses were carried out with the help of statistical software Stata 12 SE (Stata, 2011). Results Level and Trends of Dem and and Unmet Need fo r Family Planning Ta b l e 1 shows the demand for family planning. About 48% of all women in reproductive ages were in need of family plan- ning in India in 1992-1993. However, it increased by 9 percent a ge points to reach 56% in 2005 -2006. I t is noticeab le that the d emand Table 1. Level and trends in demand for family planning demand for family planning in bihar, 1992-2006. Year 1992-1993 1998-1999 2005-2006 Unmet need for family pl anning For spacing 14.4 12.6 10.7 For limiting 10.6 11.9 12.1 Total 25.1 24.5 22.8 Met need for f amily planning For spacing 1.9 1.4 2.2 For limiting 21.1 23.1 31.9 Total 23.1 24.5 34.1 Total demand for family p lanning For spacing 16.4 14.0 12.9 For limiting 31.8 35.0 44.0 Total 48.1 49.1 56.9 Note: Computed for m NFHS data files. for spacing has been decreasing over the period. Converse is true about the demand of family planning for limiting. It in- creased from 32% in 1992-1993 to 44% in 2005-2006. How- ever, the increase in the demand of family planning for limiting during 1999-2006 is thrice that of during 1993-1999. The level of unmet need among women from reproductive ages in Bihar was about 25%, which reduced to 23% in 2005-2006—a de- cline of 2 percentage points in last 15 years. Looking separately at unmet need for spacing and limiting, it comes to the fore that the unmet demand for family planning for limiting purpose has been increasing over time while same for spacing has been declining steadily over the period. Tabl e 2 also shows the unmet need for family planning by background characteristics during all three rounds of NFHS. It is interesting to see that adolescent women, who have lowest demand for family planning in 2005-2006, have the greatest unmet need for family planning (36%). The unmet need for family planning has considerably increased in adolescent women while, in most of the other age groups, the unmet need among women has decreased. The unmet need among urban women (17%) is considerably lower than among rural women (24%) during 2005-2006. They also experience a greater reduc- tion in unmet need for family planning during 1992-2006. Ex- cept women with 10 years or more, the unmet need for family planning among women belonging to other education catego- ries varies very little. The unmet need for family planning during 1998-2006 re- mains more or less stagnant in these categories except women with 10 or more years of schooling who experienced a reduc- tion of about 6 percentage points. The unmet need for family planning among Hindus (21%) is less than among Muslims (32%) during 2005-2006. Muslims have witnessed a slight increase in the unmet need while Hindus have experienced a reduction of similar magnitude during 1992-2006. Women be- longing to Scheduled Castes (SCs) show higher unmet need for family planning than those belonging to Other Backward Castes (OBCs) during 2005-2006. However, OBCs witness slightly greater reduction in unmet need than SCs. Unmet need is considerably higher among women with low standard of living (26%) than among those with high standard of living (14%) during 2005-2006. Reduction in unmet need during 1992-2006 is also highest among women with high standard of living. Main Reasons for Not Using Contraception Table 3 presents main reasons for not using contraception for spacing and limiting as told by respondents in NFHS-III (2005-2006). About 38% women cited religious prohibition as the main reason for not using contraceptive for spacing while about 12% cited opposition from husband as the main reason. Some (about 10%) also cited infrequent/no sex as the reason for not using contraceptive for spacing. About 9% respondents did not use contraceptive because they themselves opposed (9%) its use. Many women (7%) did not use contraception for spacing because they did not know any method of contraception (7%). As far contraception for limiting purposes, religious prohibition (25%) turns out to be the most cited reason behind not using contraception. Apart from that, husband’s opposition (16%) and respondent’s own opposition (10%) to use of any kind of mod- ern contraception were among most cited reasons. About 9% of women did not use contraception because they considered Copyright © 2013 SciRe s . 159 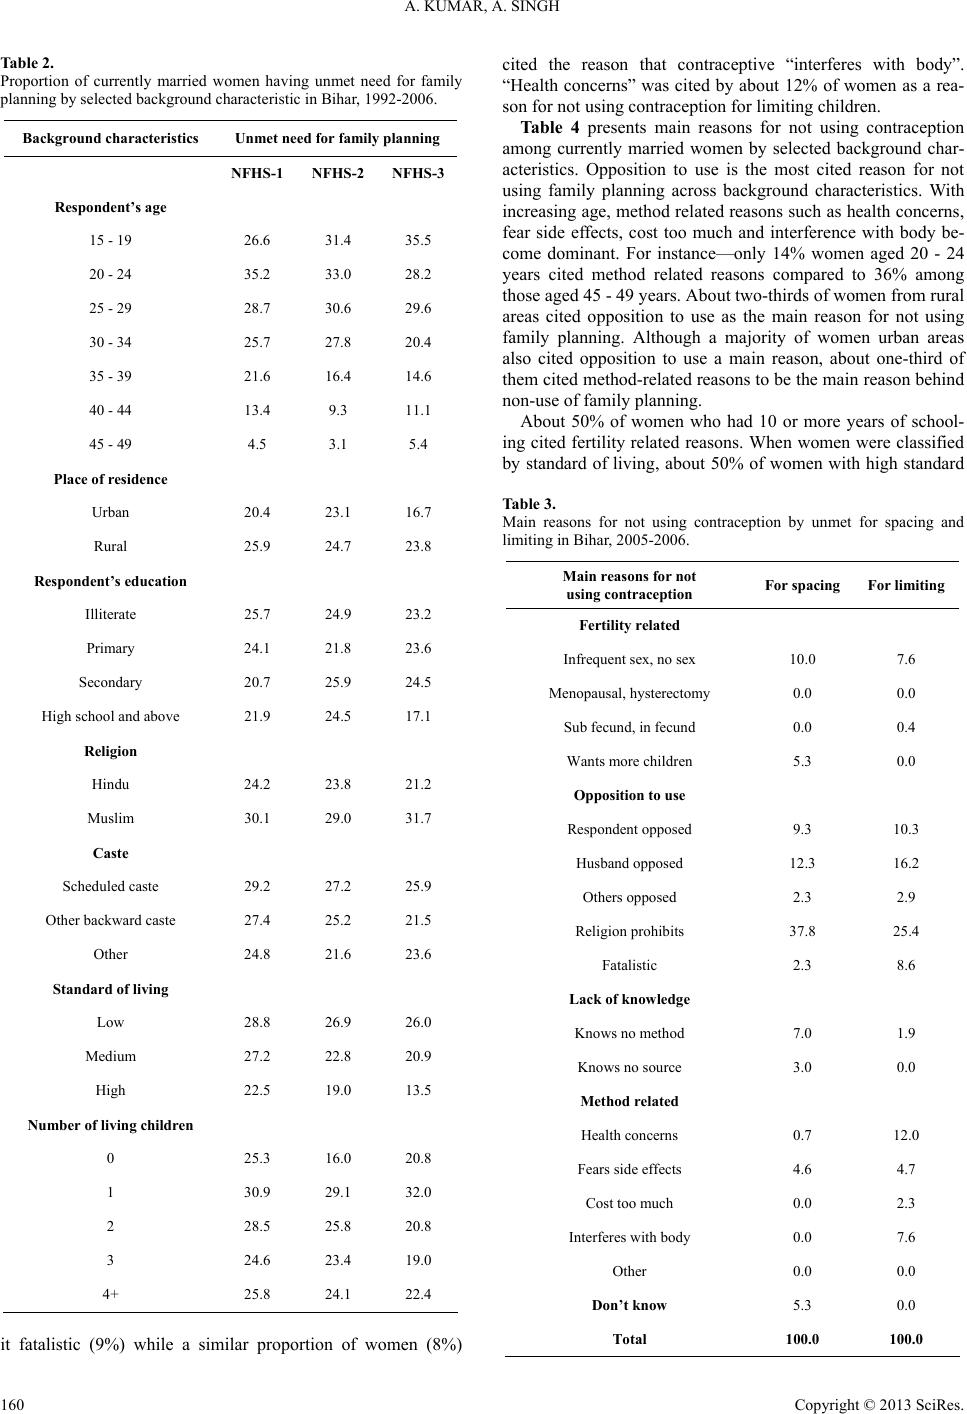 A. KUMAR, A. SINGH Table 2. Proportion of currently married women having unmet need for family planning by selected background characteristic in Bihar, 1992-2006. Backgroun d characteristics Unmet need for family pl anning NFHS-1 NFHS-2 NFHS-3 Respondent ’s age 15 - 19 26.6 31.4 35.5 20 - 24 35.2 33.0 28.2 25 - 29 28.7 30.6 29.6 30 - 34 25.7 27.8 20.4 35 - 39 21.6 16.4 14.6 40 - 44 13.4 9.3 11.1 45 - 49 4.5 3.1 5.4 Place of residence Urban 20.4 23.1 16.7 Rural 25.9 24.7 23.8 Respondent ’s education Illiterate 25.7 24.9 23.2 Primary 24.1 21.8 23.6 Secondary 20.7 25.9 24.5 High school a nd above 21.9 24.5 17.1 Religion Hindu 24.2 23.8 21.2 Muslim 30.1 29.0 31.7 Caste Scheduled c aste 29.2 27.2 25.9 Other bac k ward caste 27.4 25.2 21.5 Other 24.8 21.6 23.6 Standard of living Low 28.8 26.9 26.0 Medium 27.2 22.8 20.9 High 22.5 19.0 13.5 Number of living children 0 25.3 16.0 20.8 1 30.9 29.1 32.0 2 28.5 25.8 20.8 3 24.6 23.4 19.0 4+ 25.8 24.1 22.4 it fatalistic (9%) while a similar proportion of women (8%) cited the reason that contraceptive “interferes with body”. “Health concerns” was cited by about 12% of women as a rea- son for not using contraception for limiting children. Table 4 presents main reasons for not using contraception among currently married women by selected background char- acteristics. Opposition to use is the most cited reason for not using family planning across background characteristics. With increasing age, method related reasons such as health concerns, fear side effects, cost too much and interference with body be- come dominant. For instance—only 14% women aged 20 - 24 years cited method related reasons compared to 36% among those aged 45 - 49 years. About two-thirds of women from rural areas cited opposition to use as the main reason for not using family planning. Although a majority of women urban areas also cited opposition to use a main reason, about one-third of them cited method-related reasons to be the main reason behind non-use of family planning. About 50% of women who had 10 or more years of school- ing cited fertility related reasons. When women were classified by standard of living, about 50% of women with high standard Table 3. Main reasons for not using contraception by unmet for spacing and limiting in Bihar, 2005-2006. Main reasons for not using contraception For spacing For limiting Fertility re l a ted Infrequent sex, no sex 10.0 7.6 Menopausal, hysterectomy 0.0 0.0 Sub fecund, in fec und 0.0 0. 4 Wants more c hildren 5.3 0.0 Opposition to use Responde nt opposed 9.3 10.3 Husband opposed 12.3 16.2 Others opposed 2.3 2.9 Religion prohi bit s 37.8 25.4 Fatalistic 2.3 8.6 Lack of knowledge Knows no method 7.0 1.9 Knows no source 3.0 0.0 Method related Health con cerns 0.7 12.0 Fears side effects 4.6 4.7 Cost too m uch 0.0 2.3 Interferes w i th body 0.0 7.6 Other 0.0 0.0 Don’t know 5.3 0.0 Total 100.0 100.0 Copyright © 2013 SciRe s . 160 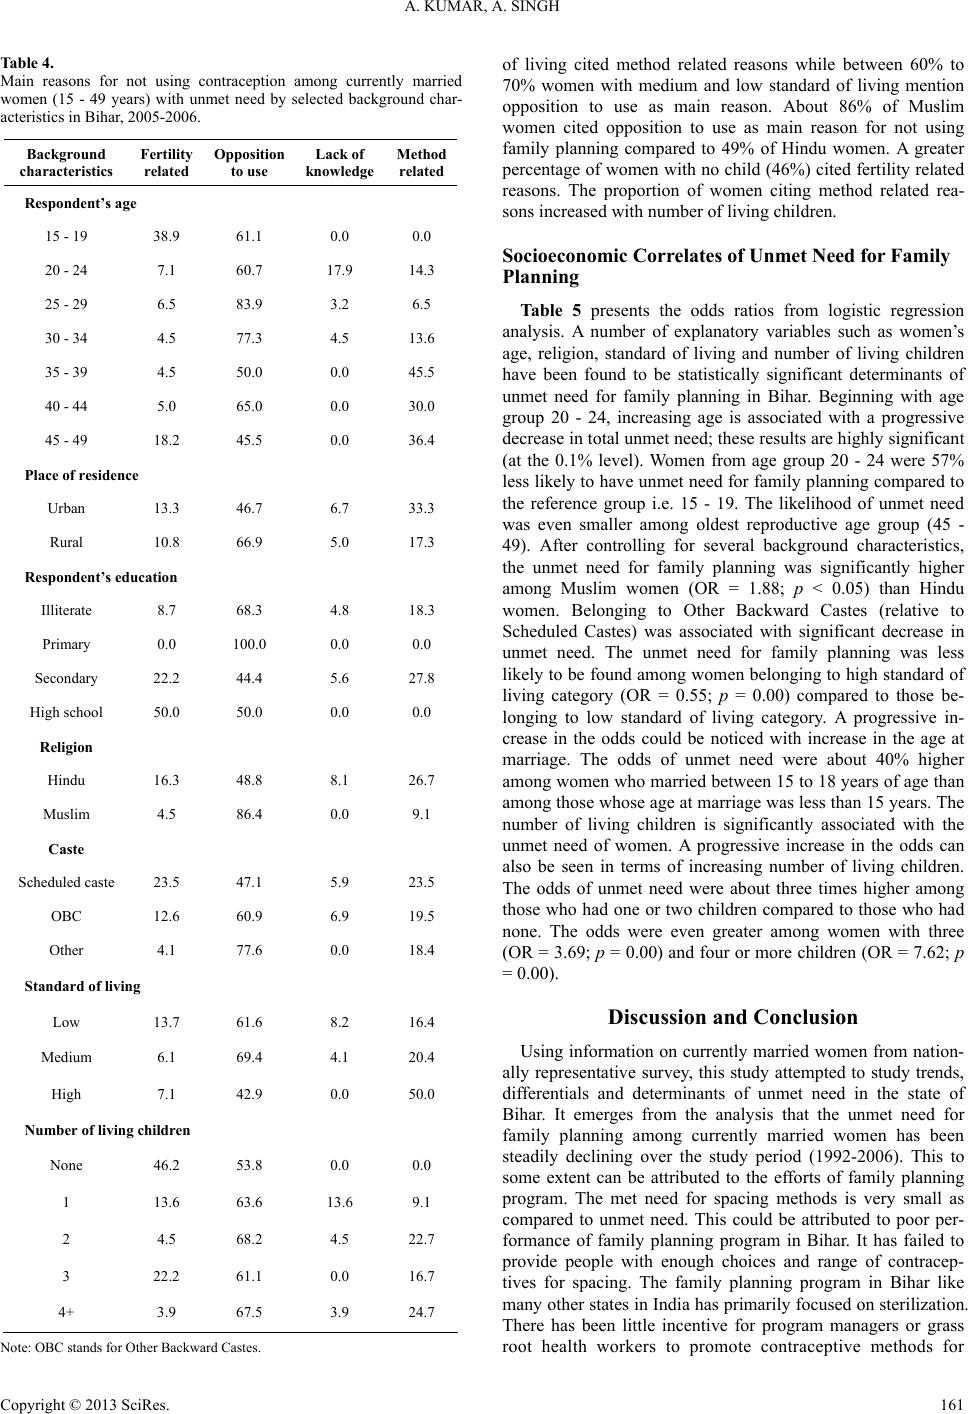 A. KUMAR, A. SINGH Table 4. Main reasons for not using contraception among currently married women (15 - 49 years) with unmet need by selected background char- acteristics in Bihar, 2005-2006. Background characteris tics Fertility related Opposition to use Lack of knowledge Method related Respondent ’s age 15 - 19 38.9 61.1 0.0 0.0 20 - 24 7.1 60.7 17.9 14.3 25 - 29 6.5 83.9 3.2 6.5 30 - 34 4.5 77.3 4.5 13.6 35 - 39 4.5 50.0 0.0 45.5 40 - 44 5.0 65.0 0.0 30.0 45 - 49 18.2 45.5 0.0 36.4 Place of residence Urban 13.3 46.7 6.7 33.3 Rural 10.8 66.9 5.0 17.3 Respondent ’s education Illiterate 8.7 68.3 4.8 18.3 Primary 0.0 100.0 0.0 0.0 Secondary 22.2 44.4 5.6 27.8 High school 50.0 50.0 0.0 0.0 Religion Hindu 16.3 48.8 8.1 26.7 Muslim 4.5 86.4 0.0 9.1 Caste Scheduled c aste 23.5 47.1 5.9 23.5 OBC 12.6 60.9 6.9 19.5 Other 4.1 77.6 0.0 18.4 Standard of living Low 13.7 61.6 8.2 16.4 Medium 6.1 69.4 4.1 20.4 High 7.1 42.9 0.0 50.0 Number of living children None 46.2 53.8 0.0 0.0 1 13.6 63.6 13.6 9.1 2 4.5 68.2 4.5 22.7 3 22.2 61.1 0.0 16.7 4+ 3.9 67.5 3.9 24.7 Note: OBC stands for Other Backward Castes. of living cited method related reasons while between 60% to 70% women with medium and low standard of living mention opposition to use as main reason. About 86% of Muslim women cited opposition to use as main reason for not using family planning compared to 49% of Hindu women. A greater percentage of women with no child (46%) cited fertility related reasons. The proportion of women citing method related rea- sons increased with number of living children. Socioeconomic Correlates of Unmet Need for Family Planning Table 5 presents the odds ratios from logistic regression analysis. A number of explanatory variables such as women’s age, religion, standard of living and number of living children have been found to be statistically significant determinants of unmet need for family planning in Bihar. Beginning with age group 20 - 24, increasing age is associated with a progressive decrease in total unmet need; these results are highly significant (at the 0.1% level). Women from age group 20 - 24 were 57% less likely to have unmet need for family planning compared to the reference group i.e. 15 - 19. The likelihood of unmet need was even smaller among oldest reproductive age group (45 - 49). After controlling for several background characteristics, the unmet need for family planning was significantly higher among Muslim women (OR = 1.88; p < 0.05) than Hindu women. Belonging to Other Backward Castes (relative to Scheduled Castes) was associated with significant decrease in unmet need. The unmet need for family planning was less likely to be found among women belonging to high standard of living category (OR = 0.55; p = 0.00) compared to those be- longing to low standard of living category. A progressive in- crease in the odds could be noticed with increase in the age at marriage. The odds of unmet need were about 40% higher among women who married between 15 to 18 years of age than among those whose age at marriage was less than 15 years. The number of living children is significantly associated with the unmet need of women. A progressive increase in the odds can also be seen in terms of increasing number of living children. The odds of unmet need were about three times higher among those who had one or two children compared to those who had none. The odds were even greater among women with three (OR = 3.69; p = 0.00) and four or more children (OR = 7.62; p = 0.00). Discussion and Conclusion Using information on currently married women from nation- ally representative survey, this study attempted to study trends, differentials and determinants of unmet need in the state of Bihar. It emerges from the analysis that the unmet need for family planning among currently married women has been steadily declining over the study period (1992-2006). This to some extent can be attributed to the efforts of family planning program. The met need for spacing methods is very small as compared to unmet need. This could be attributed to poor per- formance of family planning program in Bihar. It has failed to provide people with enough choices and range of contracep- tives for spacing. The family planning program in Bihar like many o ther st ates in I ndia has prima rily focuse d on ste riliz atio n. There has been little incentive for program managers or grass root health workers to promote contraceptive methods for Copyright © 2013 SciRe s . 161 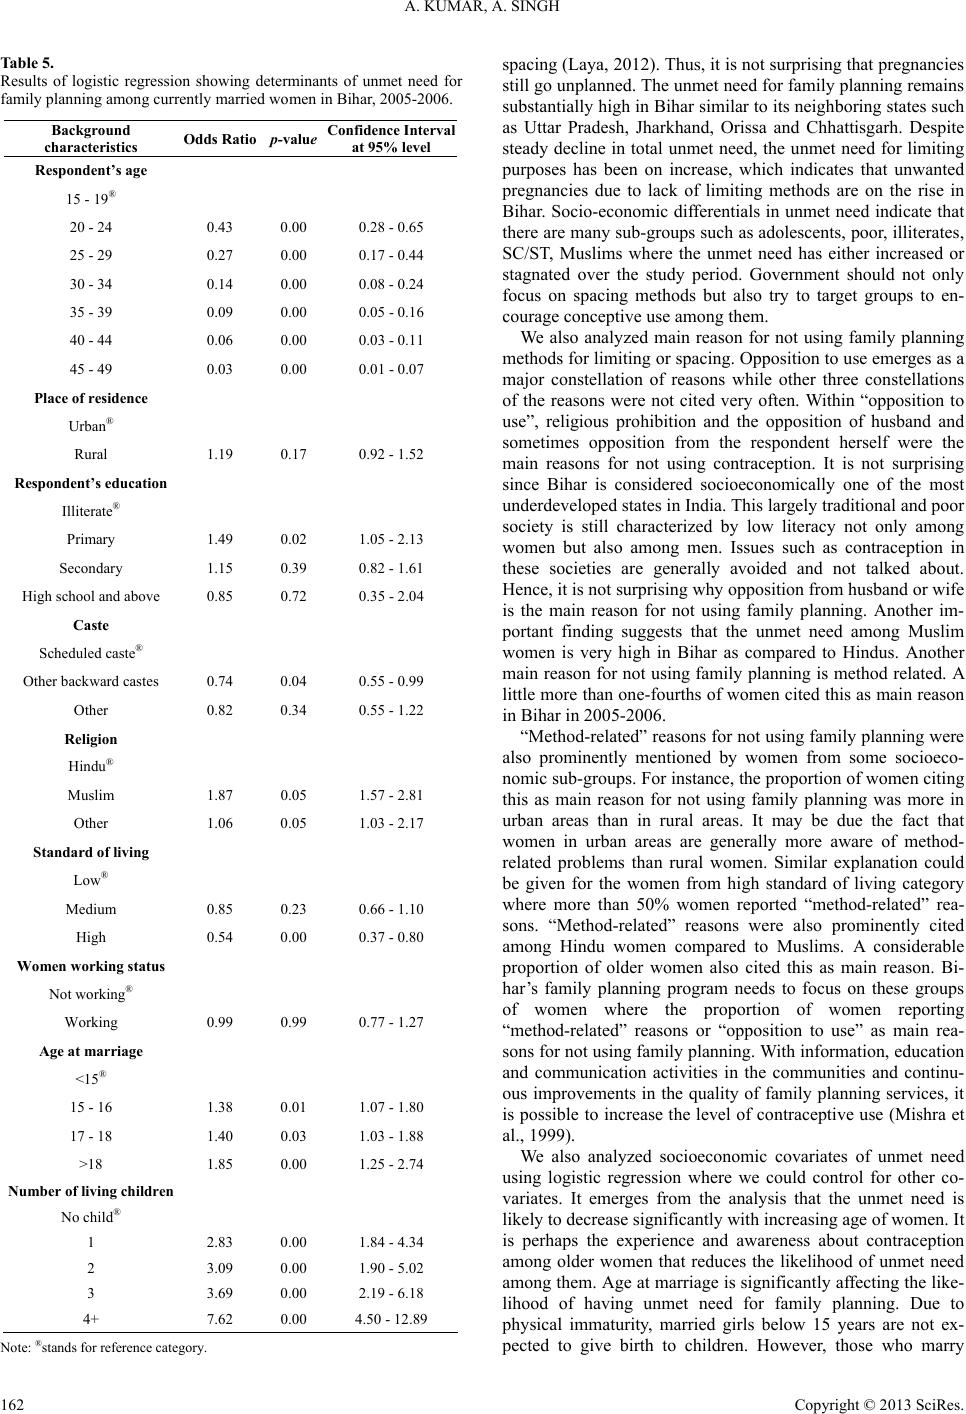 A. KUMAR, A. SINGH Table 5. Results of logistic regression showing determinants of unmet need for family planning among currentl y married women in Bihar, 2005-2006. Background characteris tics Odds Ratio p-value Confidence Interval at 95% leve l Respondent ’s age 15 - 19® 20 - 24 0.43 0.00 0.28 - 0.65 25 - 29 0.27 0.00 0.17 - 0.44 30 - 34 0.14 0.00 0.08 - 0.24 35 - 39 0.09 0.00 0.05 - 0.16 40 - 44 0.06 0.00 0.03 - 0.11 45 - 49 0.03 0.00 0.01 - 0.07 Place of residence Urban® Rural 1.19 0.17 0.92 - 1.52 Respondent ’s education Illiterate® Primary 1.49 0.02 1.05 - 2.13 Secondary 1.15 0.39 0.82 - 1.61 High school a nd above 0.85 0.72 0.35 - 2.04 Caste Scheduled ca ste® Other backward castes 0.74 0.04 0.55 - 0.99 Other 0.82 0.34 0.55 - 1.22 Religion Hindu® Muslim 1.87 0.05 1.57 - 2.81 Other 1.06 0.05 1.03 - 2.17 Standard of living Low® Medium 0.85 0.23 0.66 - 1.10 High 0.54 0.00 0.37 - 0.80 Women working status Not working® Working 0.99 0.99 0.77 - 1.27 Age at marriage <15® 15 - 16 1.38 0.01 1.07 - 1.80 17 - 18 1.40 0.03 1.03 - 1.88 >18 1.85 0.00 1.25 - 2.74 Number of living children No child® 1 2.83 0.00 1.84 - 4.34 2 3.09 0.00 1.90 - 5.02 3 3.69 0.00 2.19 - 6.18 4+ 7.62 0.00 4.50 - 12.89 Note: ®stands for reference category. spacing (Laya, 2012). Thus, it is not surprising that pregnancies still go unplanned. The unmet need for family planning remains substantially high in Bihar similar to its neighboring states such as Uttar Pradesh, Jharkhand, Orissa and Chhattisgarh. Despite steady decline in total unmet need, the unmet need for limiting purposes has been on increase, which indicates that unwanted pregnancies due to lack of limiting methods are on the rise in Bihar. Socio-economic differentials in unmet need indicate that there are many sub-groups such as adolescents, poor, illiterates, SC/ST, Muslims where the unmet need has either increased or stagnated over the study period. Government should not only focus on spacing methods but also try to target groups to en- courage conceptive use among them. We also analyzed main reason for not using family planning methods for limiting or spacing. Opposition to use emerges as a major constellation of reasons while other three constellations of the reasons were not cited very often. Within “opposition to use”, religious prohibition and the opposition of husband and sometimes opposition from the respondent herself were the main reasons for not using contraception. It is not surprising since Bihar is considered socioeconomically one of the most underdeveloped states in India. This largely traditional and poor society is still characterized by low literacy not only among women but also among men. Issues such as contraception in these societies are generally avoided and not talked about. Hence, it is not surprising why opposition from husband or wife is the main reason for not using family planning. Another im- portant finding suggests that the unmet need among Muslim women is very high in Bihar as compared to Hindus. Another main reason for not using family planning is method related. A little more than one-fourths of women cited this as main reason in Bihar in 2005-2006. “Method-related” reasons for not using family planning were also prominently mentioned by women from some socioeco- nomic sub-groups. For instance, the proportion of women citing this as main reason for not using family planning was more in urban areas than in rural areas. It may be due the fact that women in urban areas are generally more aware of method- related problems than rural women. Similar explanation could be given for the women from high standard of living category where more than 50% women reported “method-related” rea- sons. “Method-related” reasons were also prominently cited among Hindu women compared to Muslims. A considerable proportion of older women also cited this as main reason. Bi- har’s family planning program needs to focus on these groups of women where the proportion of women reporting “method-related” reasons or “opposition to use” as main rea- sons for not using family planning. With information, education and communication activities in the communities and continu- ous improvements in the quality of family planning services, it is possible to increase the level of contraceptive use (Mishra et al., 1999). We also analyzed socioeconomic covariates of unmet need using logistic regression where we could control for other co- variates. It emerges from the analysis that the unmet need is likely to decrease significantly with increasing age of women. It is perhaps the experience and awareness about contraception among older women that reduces the likelihood of unmet need among them. Age at marriage is significantly affecting the like- lihood of having unmet need for family planning. Due to physical immaturity, married girls below 15 years are not ex- pected to give birth to children. However, those who marry Copyright © 2013 SciRe s . 162 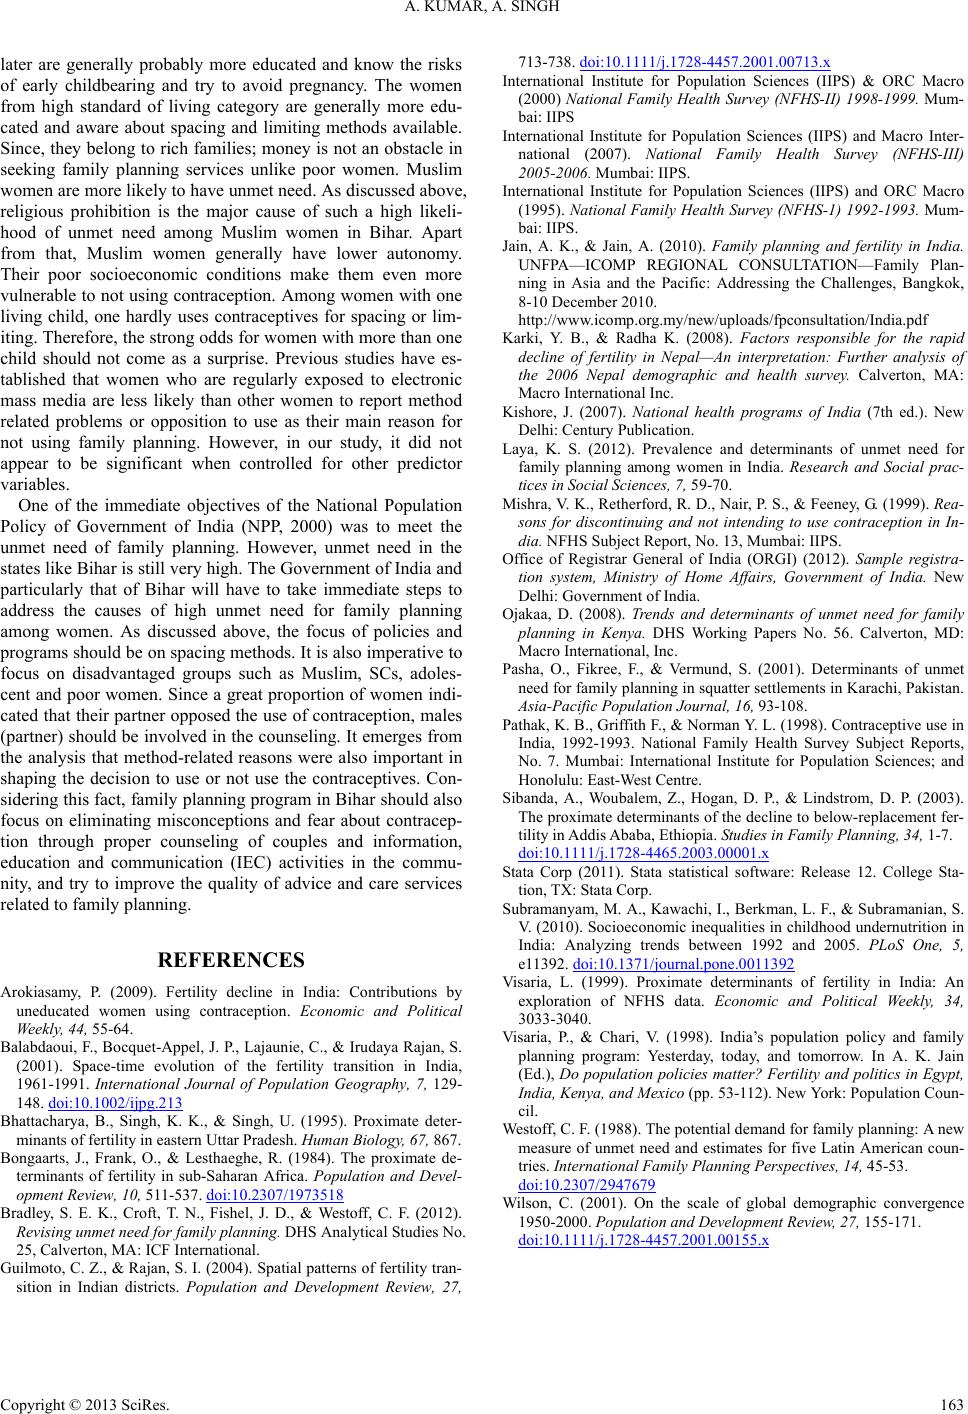 A. KUMAR, A. SINGH Copyright © 2013 SciRe s . 163 later are generally probably more educated and know the risks of early childbearing and try to avoid pregnancy. The women from high standard of living category are generally more edu- cated and aware about spacing and limiting methods available. Since, they belong to rich families; money is not an obstacle in seeking family planning services unlike poor women. Muslim women are more likely to have unmet need. As discussed above, religious prohibition is the major cause of such a high likeli- hood of unmet need among Muslim women in Bihar. Apart from that, Muslim women generally have lower autonomy. Their poor socioeconomic conditions make them even more vulnerable to not using contraception. Among women with one living child, one hardly uses contraceptives for spacing or lim- iting. Therefore, the strong odds for women with more than one child should not come as a surprise. Previous studies have es- tablished that women who are regularly exposed to electronic mass media are less likely than other women to report method related problems or opposition to use as their main reason for not using family planning. However, in our study, it did not appear to be significant when controlled for other predictor variables. One of the immediate objectives of the National Population Policy of Government of India (NPP, 2000) was to meet the unmet need of family planning. However, unmet need in the states like Bihar is still very high. The Government of India and particularly that of Bihar will have to take immediate steps to address the causes of high unmet need for family planning among women. As discussed above, the focus of policies and programs should be on spacing methods. It is also imperative to focus on disadvantaged groups such as Muslim, SCs, adoles- cent and poor women. Since a great proportion of women indi- cated that their partner opposed the use of contraception, males (partner) should be involved in the counseling. It emerges from the analysis that method-related reasons were also important in shaping the decision to use or not use the contraceptives. Con- sidering this fact, family planning program in Bihar should also focus on eliminating misconceptions and fear about contracep- tion through proper counseling of couples and information, education and communication (IEC) activities in the commu- nity, and try to improve the quality of advice and care services related to family planning. REFERENCES Arokiasamy, P. (2009). Fertility decline in India: Contributions by uneducated women using contraception. Economic and Political Weekly, 44, 55-64. Balabdaoui, F., Bocquet-Appel, J. P., Lajaunie, C., & Irudaya Rajan, S. (2001). Space-time evolution of the fertility transition in India, 1961-1991. International Journal of Population Geography, 7, 129- 148. doi:10.1002/ijpg.213 Bhattacharya, B., Singh, K. K., & Singh, U. (1995). Proximate deter- minants of fertility in eastern Uttar Pradesh. Human B iology, 67, 867. Bongaarts, J., Frank, O., & Lesthaeghe, R. (1984). The proximate de- terminants of fertility in sub-Saharan Africa. Population and Devel- opment Review, 10, 511-537. doi:10.2307/1973518 Bradley, S. E. K., Croft, T. N., Fishel, J. D., & Westoff, C. F. (2012). Revising unmet need for family planning. DHS Analytical Studies No. 25, Calverton, MA: ICF International. Guilmoto, C. Z., & Rajan, S. I. (2004). Spatial patterns of fertility tran- sition in Indian districts. Population and Development Review, 27, 713-738. doi:10.1111/j.1728-4457.2001.00713.x International Institute for Population Sciences (IIPS) & ORC Macro (2000) National Family Health Survey (NFHS-II) 1998-1999. Mum- bai: IIPS International Institute for Population Sciences (IIPS) and Macro Inter- national (2007). National Family Health Survey (NFHS-III) 2005-2006. Mumbai: IIPS. International Institute for Population Sciences (IIPS) and ORC Macro (1995). National Family Health Survey (NFHS-1) 1992-1993. Mum- bai: IIPS. Jain, A. K., & Jain, A. (2010). Family planning and fertility in India. UNFPA—ICOMP REGIONAL CONSULTATION—Family Plan- ning in Asia and the Pacific: Addressing the Challenges, Bangkok, 8-10 December 2010. http://www.icomp.org.my/new/uploads/fpconsultation/India.pdf Karki, Y. B., & Radha K. (2008). Factors responsible for the rapid decline of fertility in Nepal—An interpretation: Further analysis of the 2006 Nepal demographic and health survey. Calverton, MA: Macro International Inc. Kishore, J. (2007). National health programs of India (7th ed.). New Delhi: Century Publication. Laya, K. S. (2012). Prevalence and determinants of unmet need for family planning among women in India. Research and Social prac- tices in Social Sciences, 7, 59-70. Mishra, V. K., Retherford, R. D., Nair, P. S., & Feeney, G. (1999). Rea- sons for discontinuing and not intending to use contraception in In- dia. NFHS Subject Report, No. 13, Mumbai: IIPS. Office of Registrar General of India (ORGI) (2012). Sample registra- tion system, Ministry of Home Affairs, Government of India. New Delhi: Government of India. Ojakaa, D. (2008). Trends and determinants of unmet need for family planning in Kenya. DHS Working Papers No. 56. Calverton, MD: Macro International, Inc. Pasha, O., Fikree, F., & Vermund, S. (2001). Determinants of unmet need for family planning in squatter settlements in Karachi, Pakistan. Asia-Pacific Population Journal, 16, 93-108. Pathak, K. B., Griffith F., & Norman Y. L. (1998). Contraceptive use in India, 1992-1993. National Family Health Survey Subject Reports, No. 7. Mumbai: International Institute for Population Sciences; and Honolulu: East-West Centre. Sibanda, A., Woubalem, Z., Hogan, D. P., & Lindstrom, D. P. (2003). The proximate determinants of the decline to below-replacement fer- tility in Addis Ababa, Ethiopia. Studies in Family Planning, 34, 1-7. doi:10.1111/j.1728-4465.2003.00001.x Stata Corp (2011). Stata statistical software: Release 12. College Sta- tion, TX: Stata Corp. Subramanyam, M. A., Kawachi, I., Berkman, L. F., & Subramanian, S. V. (2010). Socioeconomic inequalities in childhood undernutrition in India: Analyzing trends between 1992 and 2005. PLoS One, 5, e11392. doi:10.1371/journal.pone.0011392 Visaria, L. (1999). Proximate determinants of fertility in India: An exploration of NFHS data. Economic and Political Weekly, 34, 3033-3040. Visaria, P., & Chari, V. (1998). India’s population policy and family planning program: Yesterday, today, and tomorrow. In A. K. Jain (Ed.), Do population policies matter? Fertility and politics in Egypt, India, Kenya, and Mexico (pp. 53-112). New York: Population Coun- cil. Westoff, C. F. (1988). The potential demand for family planning: A new measure of unmet need and estimates for five Latin American coun- tries. International Family Plann i n g Perspectives, 14, 45-53. doi:10.2307/2947679 Wilson, C. (2001). On the scale of global demographic convergence 1950-2000. Population and Development Review, 27, 155-171. doi:10.1111/j.1728-4457.2001.00155.x |