

Paper Menu >>
Journal Menu >>
 Computational Water, Energy, and Environmental Engineering, 2013, 2, 61-68 doi:10.4236/cweee.2013.22B011 Published Online April 2013 (http://www.scirp.org/journal/cweee) Copyright © 2013 SciRes. CWEEE Atmospheric Dispersion and Deposition of Radionuclides (137Cs and 131I) Released from the Fukushima Dai-ichi Nuclear Power Plant Soon-Ung Park, Anna Choe, Moon-Soo Park Center for Atmospheric and Environmental Modeling, Seoul, Korea Email: [email protected]r Received 2013 ABSTRACT The Lagrangian Particle Dispersion Model (LPDM) in the 594 km × 594 km model domain with the horizontal grid scale of 3 km × 3 km centered at a po wer plant and the Eulerian Transport Model (ETM) modified from the Asian Dust Aerosol Model 2 (ADAM2) in the domain of 70° LAT × 140° LON with the horizontal grid scale of 27 km × 27 km have been developed. These models have been implemented to simulate the concentration and deposition of radionuc- lides (137Cs and 131I) released from the accide nt of the Fukushi ma Dai-ic hi nuclear p ower plant. I t is found that both models are able to simulate quite reasonably the observed concentrations of 137Cs and 131I near the power plant. However, the LPDM model is more useful for the estimation of concentration near the power plant site in details whe- reas the ETM model is good for the long-range transport processes of the radionuclide plume. T he estimated maximum mean surface concentration, column integrated mean concentration and the total deposition (wet+dry) by LPDM for the period from 12 March to 30 April 2011 are, respectively found to be 2.975 × 10² Bq m-3, 3.7 × 10⁷ Bq m-2, and 1.78 × 10¹⁴ Bq m-2 for 137Cs and 1.96 × 10⁴ Bq m-3, 2.24 × 10⁹ Bq m-2 and 5.96 × 10¹⁴ Bq m-2 for 131I. The radionuclide plumes released from the accident power plant are found to spread wide regions not only the whole model domain of downwind regions but the upwind regions of Russia, Mongolia, Korea, eastern China, Philippines and Vietnam within the analysis period. Keywords: Eulerian Transport Model; Fukushima Nuclear Power Plant; Lagrangian Particle Dispersion Model; Radionuclides of 137Cs a nd 131I 1. Introduction On 11 March 2011, an extraordinary magnitude 9.0 earthquake occurred off the Sanriku about 180 km off the Pacific coast of Japan’s main island Honshu, at 38.3 °N, 142.4 °E and followed by a large tsunami [1]. These events caused a station blackout at the Fukushima Dai-ichi nuclear power plant. As a consequence, four of the six Fukushima Dai-ichi nuclear power plants units heavily damaged, and causing a massive discharge of radionuclides into the air and into the ocean. Fukushima Dai-ichi nuclear power plant consisted of six boiling water reactors lined up directly along the shore. The earthquake triggered the automatic shutdown of the chain reaction in the units 1 to 3 at 05:46 UTC (14:46 JST) on 11 March 2011. Outside power supply was lost and the emergency diesel generators started up. However, the tsunami arrived 50 minutes later and inun- dated the reactor sites and their auxiliary buildings and caused the total loss of AC power. Cooling of the reactor cores was lost, water levels in the reactor pressure ves- sels could not be maintained and the cores in all three units that had been under operation, were degraded and partially (or even completely) melted. The hydrogen produced in this process caused major explosions that massively damaged the upper parts of the reactor build- ings of units 1 and 3. Damage to the upper parts of the reactor building could be prevented in unit 2, however, a hydrogen explosion were presumably damaged the sup- pression chamber [2]. During the Fukushima accident period, massive ra- dioactive materials were released to the environment. Several studies have been devoted to estimate released radioactive materials from this accident. Stohl et al. (2012) have made a first guess of released rates based on fuel inventories and then subsequently improved by in- verse modeling using the atmospheric transport model and measurement data. The release duration and radioac- tivity ratios of 131I/137Cs for the period between 05:00 JST on March 12 to 00:00 JST May 1 in 2011 have been reported [1,3-5]. However, the estimated radionuclides 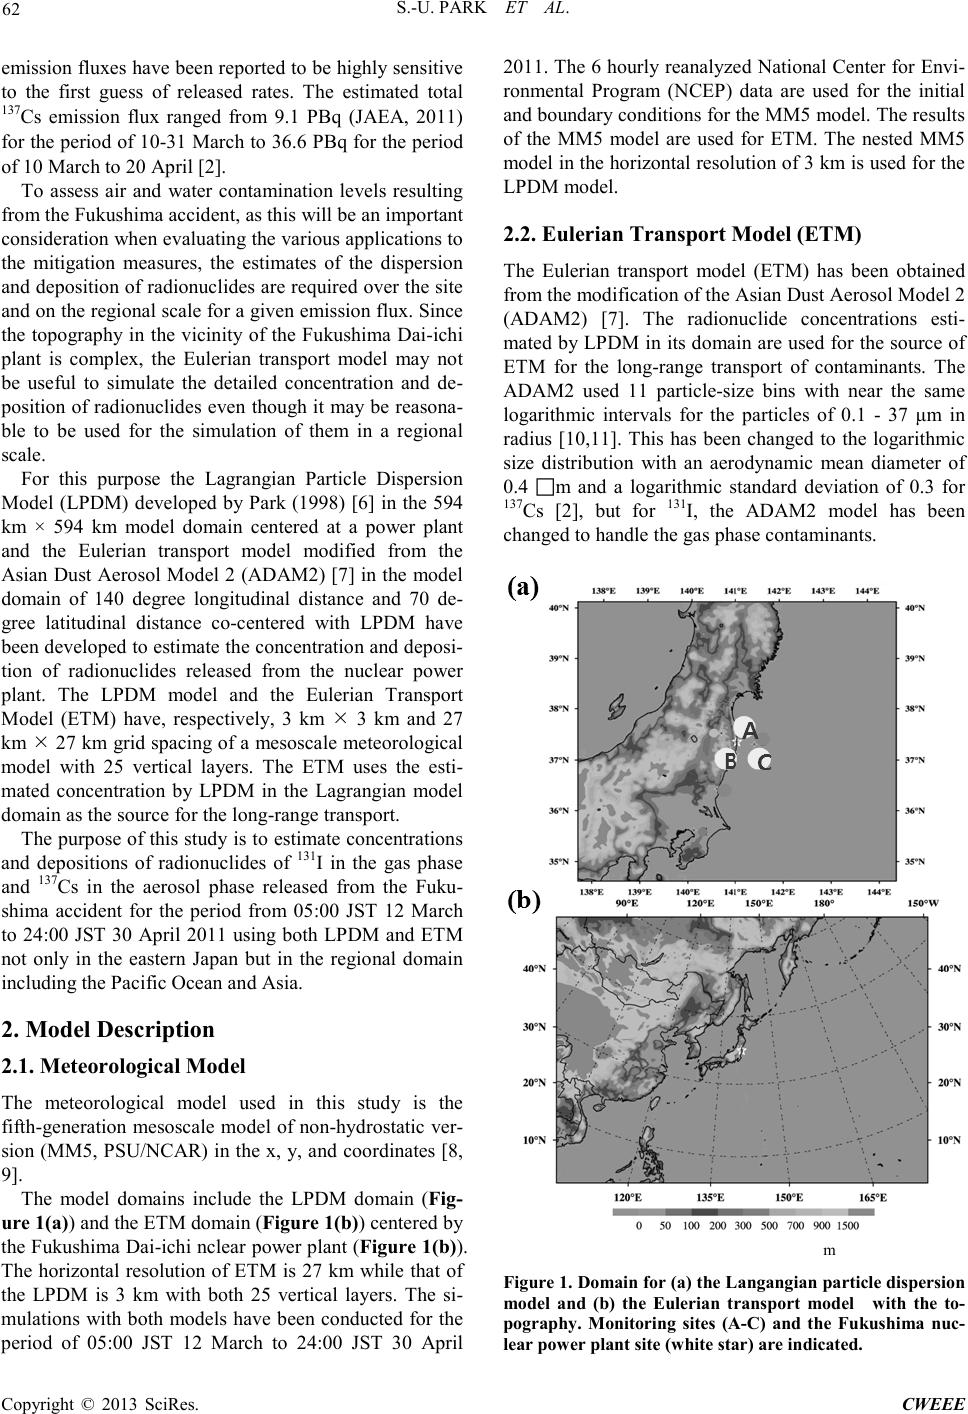 S.-U. PARK ET AL. Copyright © 2013 SciRes. CWEEE 62 emis sion flu xes have b ee n rep or ted t o b e highl y sens iti ve to the first guess of released rates. The estimated total 137Cs emission flux ranged from 9.1 PBq (JAEA, 2011) for the period of 10-31 March to 36.6 PBq for the period of 10 March to 20 April [2]. To assess air and water contamination levels resulting from the Fukushima accident, as th is will be an important consideratio n whe n e valuatin g the variou s app licatio ns to the mitigation measures, the estimates of the dispersion and deposition of radionuclides are required over the site and o n the r egio nal sca le fo r a give n e missio n flu x. Si nce the topography in the vicinity of the Fukushima Dai-ichi plant is complex, the Eulerian transport model may not be useful to simulate the detailed concentration and de- position of radionuclides even though it may be reasona- ble to be used for the simulation of them in a regional scale. For this purpose the Lagrangian Particle Dispersion Model (LPDM) developed by Park (1998) [6] in the 594 km × 594 km model domain centered at a power plant and the Eulerian transport model modified from the Asian D ust Aerosol Model 2 (ADAM2) [7] in the model domain of 140 degree longitudinal distance and 70 de- gree latitudinal distance co-centered with LPDM have been developed to estimate the concentration and deposi- tion of radionuclides released from the nuclear power plant. The LPDM model and the Eulerian Transport Model (ETM) have, respectively, 3 km 3 km and 27 km 27 km grid spacing of a mesoscale meteorological model with 25 vertical layers. The ETM uses the esti- mated concentration by LPDM in the Lagrangian model domain as the source for the long-range transport. The purp ose of this study is to estimate co ncentrations and depositions of radionuclides of 131I in the gas phase and 137Cs in the aerosol phase released from the Fuku- shima accident for the period from 05:00 JST 12 March to 24:00 JST 30 April 2011 using both LPDM and ETM not only in the eastern Japan but in the regional domain including the Pacific Ocean and Asia. 2. Model Descri ption 2.1. Meteorological Model The meteorological model used in this study is the fift h-generation mesoscale model of non-hydrostatic ver- sion ( MM5, P SU/NCAR ) in the x, y, a nd coordinates [8, 9]. The model domains include the LPDM domain (Fig- ure 1(a)) and t he ETM domain (Figure 1(b)) centered by the F ukushi ma Dai -ichi nclear po wer plant (Figure 1(b)). The horizontal resolution of ETM is 27 km while that of the LPDM is 3 km with both 25 vertical layers. The si- mulations with both models have been conducted for the period of 05:00 JST 12 March to 24:00 JST 30 April 2011. The 6 hourly reanalyzed National Center for Envi- ronmental Program (NCEP) data are used for the initial and boundary conditions for the MM5 model. The results of the MM5 model are used for ETM. The nested MM5 model in the horizontal resolution of 3 km is used for the LPDM model. 2.2. Eulerian Transport Model (ETM) The Eulerian transport model (ETM) has been obtained from the modification of the Asian Dust Aerosol Model 2 (ADAM2) [7]. The radionuclide concentrations esti- mated by LPDM in its domain are used for the source of ETM for the long-range transport of contaminants. The ADAM2 used 11 particle-size bins with near the same logarithmic intervals for the particles of 0.1 - 37 μm in radius [10,11]. This has been changed to the logarithmic size distribution with an aerodynamic mean diameter of 0.4 m and a logarithmic standard deviation of 0.3 for 137Cs [2], but for 131I, the ADAM2 model has been chan ged to handle the gas p hase contami nants. m Figure 1. Domain for (a) the Langangian particle dispersion model and (b) the Eulerian transport model with the to- pography. Monitoring sites (A-C) and the Fukushima nuc- lear power plant site (whit e star) are in dicated. 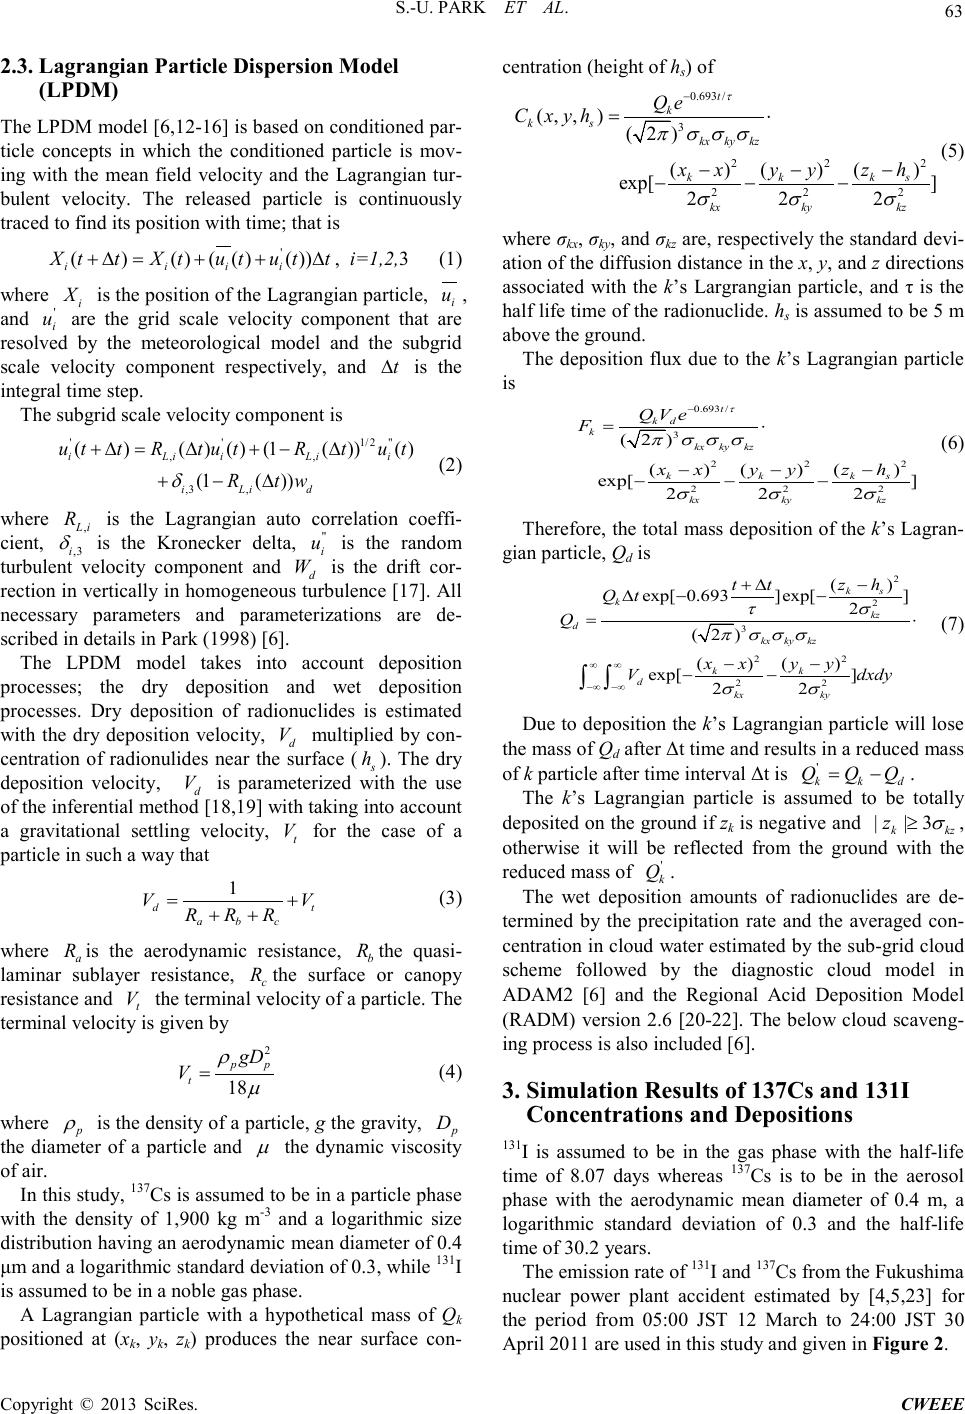 S.-U. PARK ET AL. Copyright © 2013 SciRes. CWEEE 63 2.3. Lagrangian Particle Dispersion Model (LPDM) The LPDM model [6,12-16] is based on conditioned par- ticle concepts in which the conditioned particle is mov- ing with the mean field velocity and the Lagrangian tur- bulent velocity. The released particle is continuously traced to find its position with time; that is ' ()()( ()()) ii ii XttXtut utt+∆ =++∆ , i=1,2,3 (1) where i X is the positio n o f the Lagran gian pa rticle, i u , and ' i u are the grid scale velocity component that are resolved by the meteorological model and the subgrid scale velocity component respectively, and t∆ is the integral time step. The subgrid scale velocity component is ''1/2 " ,, ,3 , ()( )()(1( ))() (1( )) iLi iLii i Li d uttR tutR tut R tw δ +∆ =∆+−∆ + −∆ (2) where ,Li R is the Lagrangian auto correlation coeffi- cient, ,3i δ is the Kronecker delta, " i u is the random turbulent velocity component and d W is the drift cor- rec tion in vertica lly i n homo geneo us turb ulence [17 ]. All necessary parameters and parameterizations are de- scribed in details in Park (1998) [6]. The LPDM model takes into account deposition processes; the dry deposition and wet deposition processes. Dry deposition of radionuclides is estimated with the dry deposition velocity, d V multiplied by con- centration of radionulides near the surface ( s h ). T he dry deposition velocity, d V is parameterized with the use of the inferential method [18,19] with taking into account a gravitational settling velocity, t V for the case of a particle i n s uch a wa y that 1 dt abc VV RRR = + ++ (3) where a R is the aerodynamic resistance, b R the quasi- laminar sublayer resistance, c R the surface or canopy resistance and t V the terminal velocity of a particle. The terminal velocit y is given by 2 18 pp t gD V ρ µ = (4) where p ρ is the density of a particle, g t he gra vity, p D the diameter of a particle and µ the dynamic viscosity of air. In thi s st udy, 137Cs is assumed to be in a particle phase with the density of 1,900 kg m-3 and a logarithmic size distribution having an aerodynamic mean diameter of 0.4 μm and a logarithmic standard deviation of 0.3, while 131I is assumed to be in a noble gas phase. A Lagrangian particle with a hypothetical mass of Qk positioned at (xk, yk, zk) produces the near surface con- centration (he ight of hs) of 0.693 / 3 22 2 22 2 (,, )(2) ( )()() exp[] 222 t k ks kx ky kz kk ks kx kykz Qe C xyh xxyy zh τ π σσσ σσ σ − = ⋅ −−− −− − (5) where σkx, σky, and σkz are, respectively the standard devi- ation of the diffusio n distance in the x, y, a nd z dire ctions associated with the k’s Largrangian particle, and τ is the half life time of the radionuclide. hs is assumed to be 5 m above the ground. The deposition flux due to the k’s Lagrangian particle is 0.693 / 3 22 2 22 2 (2) ( )()() exp[ ] 222 t kd k kx ky kz k k ks kx kykz QVe F xx yy zh τ π σσσ σσ σ − = ⋅ −−− −− − (6) Therefore, the total mass depo sition of t he k’s Lagra n- gian particle, Qd is 2 2 3 22 22 () exp[ 0.693]exp[] 2 (2) ( )() exp[ ] 22 ks k kz d kx ky kz kk d kx ky zh tt Qt Q xx yy V dxdy τσ π σσσ σσ ∞∞ −∞ −∞ − +∆ ∆− − = ⋅ −− −− ∫∫ (7) Due to depo sition the k’s Lagrangian p article will lose the mass of Qd after Δt time and results in a reduced mass of k particle after time interval Δt is ' k kd QQQ= − . The k’s Lagrangian particle is assumed to be totally deposited on the ground if zk is ne gative and | |3 k kz z σ ≥ , otherwise it will be reflected from the ground with the reduced mass of ' k Q . The wet deposition amounts of radionuclides are de- termined by the precipitation rate and the averaged con- centration in cloud water estimated by the sub-grid cloud scheme followed by the diagnostic cloud model in ADAM2 [6] and the Regional Acid Deposition Model (RADM) version 2.6 [20-22]. The below cloud scaveng- ing pr ocess is also inc l uded [6]. 3. Simulation Results of 137Cs and 131I Concentrations and Depositions 131I is assumed to be in the gas phase with the half-life time of 8.07 days whereas 137Cs is to be in the aerosol phase with the aerodynamic mean diameter of 0.4 m, a logarithmic standard deviation of 0.3 and the half-life time of 30.2 years. The emission rate of 131I and 137Cs from the Fukushima nuclear power plant accident estimated by [4,5,23] for the period from 05:00 JST 12 March to 24:00 JST 30 April 2011 are used in t his study and given in Figure 2 . 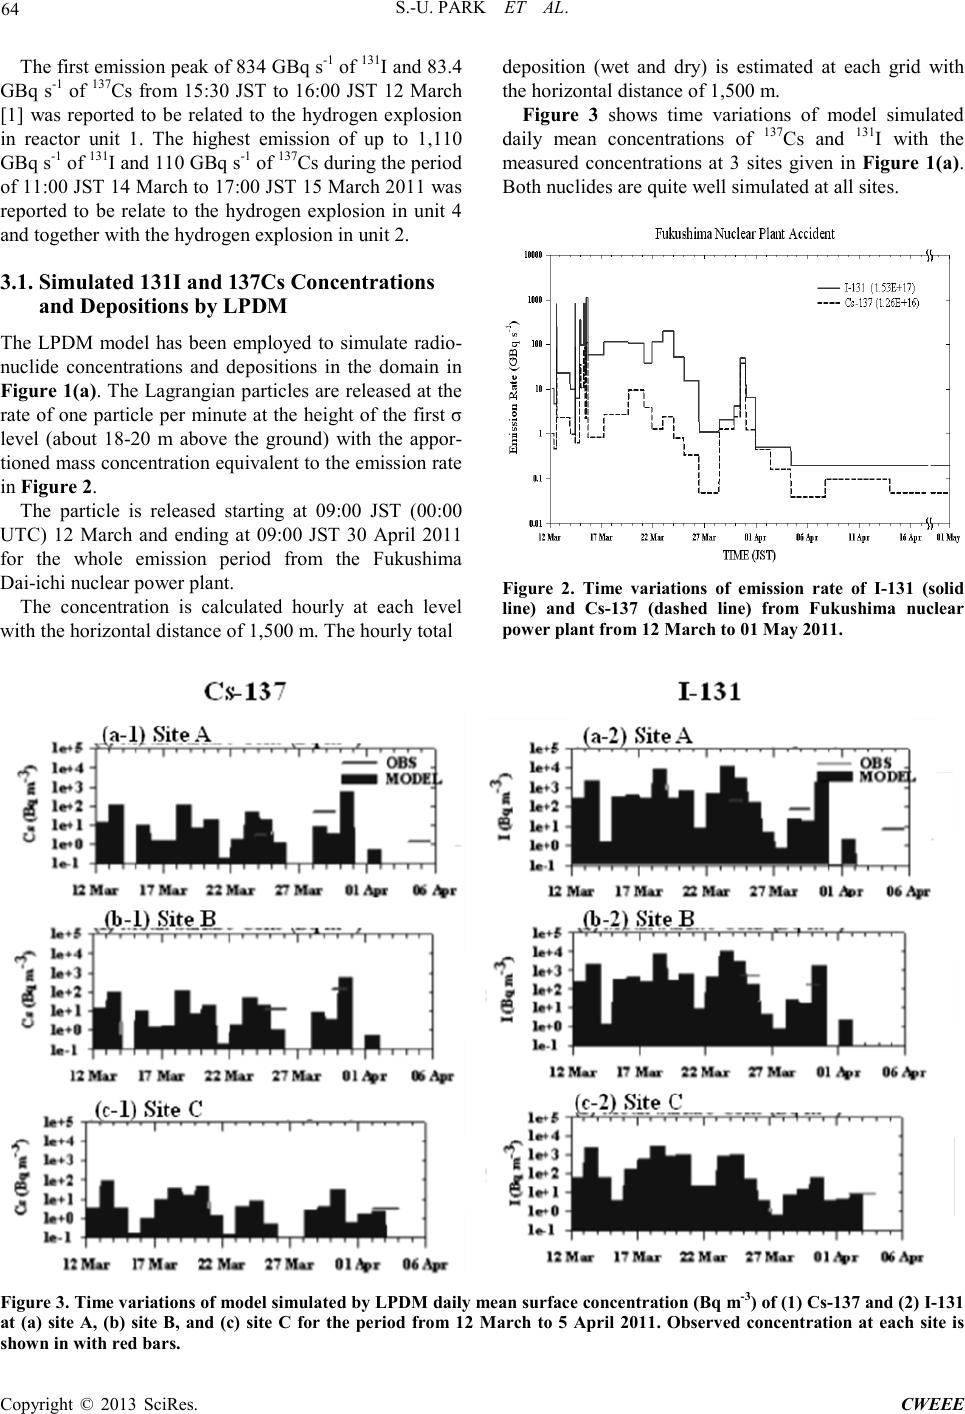 S.-U. PARK ET AL. Copyright © 2013 SciRes. CWEEE 64 The first emission peak of 834 GBq s-1 of 131I and 83.4 GBq s-1 of 137Cs from 15:30 JST to 16:00 JST 12 March [1] was reported to be related to the hydrogen explosion in reactor unit 1. The highest emission of up to 1,110 GBq s-1 of 131I and 110 GBq s-1 of 137Cs dur i ng t he p er io d of 11:00 JST 14 March to 17:00 JST 15 March 2011 was reported to be relate to the hydrogen explosion in unit 4 and together with the hydrogen explosion in unit 2. 3.1. Simulated 131I and 137Cs Concentrations and Depositions by LPDM The LPDM model has been employed to simulate radio- nuclide concentrations and depositions in the domain in Figure 1(a). The Lagrangian particles are released at the rate of one particle per minute at the height of the first σ level (about 18-20 m above the ground) with the appor- tioned mass co ncentratio n equivale nt to the e mission rate in Figure 2. The particle is released starting at 09:00 JST (00:00 UTC) 12 March and ending at 09:00 JST 30 April 2011 for the whole emission period from the Fukushima Dai-ichi nuclear power pla nt. The concentration is calculated hourly at each level with the horiz ontal d istanc e of 1 ,500 m. The hour ly total deposition (wet and dry) is estimated at each grid with the horizontal distance o f 1,500 m. Figure 3 shows time variations of model simulated daily mean concentrations of 137Cs and 131I with the measured concentrations at 3 sites given in Figure 1(a). Both nuclide s are quite well si mula te d at all site s. Figure 2. Time variations of emission rate of I-131 (solid line) and Cs-137 (dashed line) from Fukushima nuclear pow e r plant from 12 M ar c h to 01 M ay 2011. Fig ure 3 . T i me varia ti o ns of mode l s i mul at e d by LP DM dai ly mea n su rf ac e c o nce ntr a ti o n (B q m-3) of (1) Cs-137 and (2) I-131 at (a) site A, (b) site B, and (c) site C for the period from 12 March to 5 April 2011. Observed concentration at each site is shown in wi th red bars . 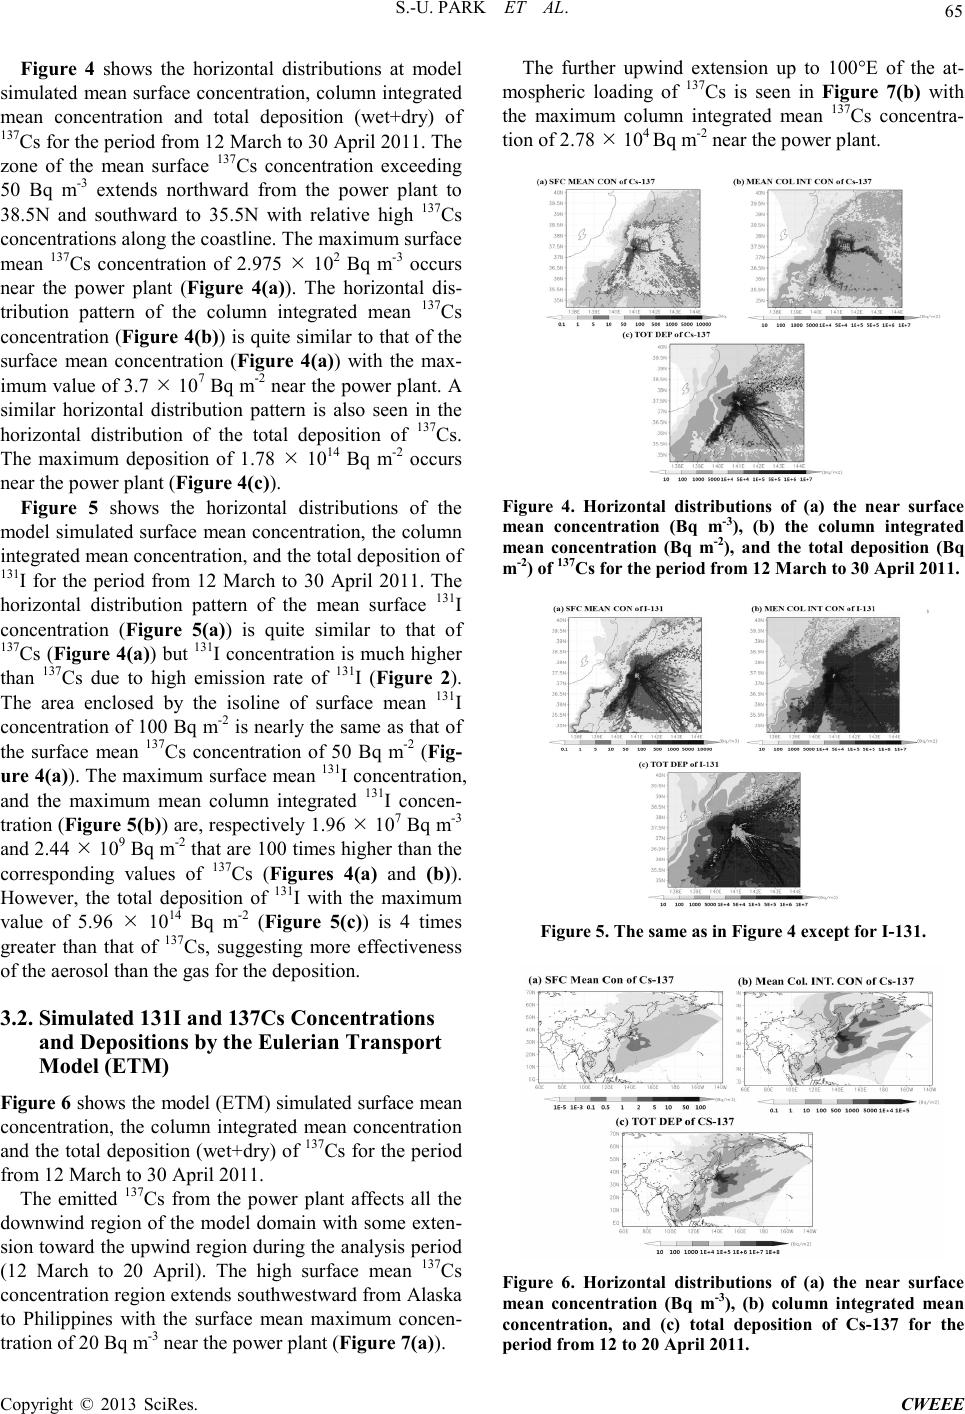 S.-U. PARK ET AL. Copyright © 2013 SciRes. CWEEE 65 Figure 4 shows the horizontal distributions at model simulated mean surface concentration, column integrated mean concentration and total deposition (wet+dry) of 137Cs for the period from 12 March to 30 April 2011. The zone of the mean surface 137Cs concentration exceeding 50 Bq m-3 extends northward from the power plant to 38.5N and southward to 35.5N with relative high 137Cs concentrations along the coastline. The maximum surface mean 137Cs concentration of 2.975 102 Bq m-3 occurs near the power plant (Figure 4(a)). The horizontal dis- tribution pattern of the column integrated mean 137Cs concentration (Figure 4(b)) is quite similar to that of the surface mean concentration (Figure 4(a)) with the max- imum value of 3.7 107 Bq m-2 near the power plant. A similar horizontal distribution pattern is also seen in the horizontal distribution of the total deposition of 137Cs. The maximum deposition of 1.78 1014 Bq m-2 occurs near the power plant (Figure 4(c)). Figure 5 shows the horizontal distributions of the model simulated surface mean concentration, the column integrated mean co ncentr ation , and the to tal deposition of 131I for the period from 12 March to 30 April 2011. The horizontal distribution pattern of the mean surface 131I concentration (Figure 5(a)) is quite similar to that of 137Cs (Figure 4(a)) but 131I c oncentra tion i s much hi gher than 137Cs due to high emission rate of 131I (Figure 2). The area enclosed by the isoline of surface mean 131I concentratio n of 100 Bq m-2 is nearly the same as that of the surface mean 137Cs concentration of 50 Bq m-2 (Fig- ure 4(a)). The maximum surface mean 131I concentration, and the maximum mean column integrated 131I concen- tration (Fig ure 5(b)) are, r espectively 1.96 107 Bq m-3 and 2.44 109 Bq m-2 tha t ar e 1 00 times hi ghe r tha n t he corresponding values of 137Cs (Figures 4(a) and (b)). However, the total deposition of 131I with the maximum value of 5.96 1014 Bq m-2 (Figure 5(c)) is 4 times greater than that of 137Cs, suggesting more effectiveness of the aerosol than the gas for the deposition. 3.2. Simulated 131I and 137Cs Concentrations and Depositions by the Eulerian Transport Model (ETM) Figure 6 shows the model (ET M) simulated surface mean concentration, the column integrated mean concentration and the total dep osition (wet+dry) of 137Cs for the period from 12 March to 30 April 2011. The emitted 137Cs from the power plant affects all the downwind region of the model domain with some exten- sion to ward the up wind regi on dur ing the anal ysis per iod (12 March to 20 April). The high surface mean 137Cs conc ent ra tion r e gio n e xtend s s o uth we st war d from Alas ka to Philippines with the surface mean maximum concen- tration of 20 Bq m-3 near the power plant (Figure 7(a)). The further upwind extension up to 100°E of the at- mospheric loading of 137Cs is seen in Figure 7(b) with the maximum column integrated mean 137Cs concentra- tion of 2.78 104 Bq m-2 near the po wer plant. Figure 4. Horizontal distributions of (a) the near surface mean concentration (Bq m-3), (b) the column integrated mean concentration (Bq m-2), and the total deposition (Bq m-2) of 137Cs for the period from 12 March to 30 April 2011. Figure 5 . The same as in Figure 4 except for I-131. Figure 6. Horizontal distributions of (a) the near surface mean concentration (Bq m-3), (b) column integrated mean concentration, and (c) total deposition of Cs-137 for the period from 12 to 20 April 2011. 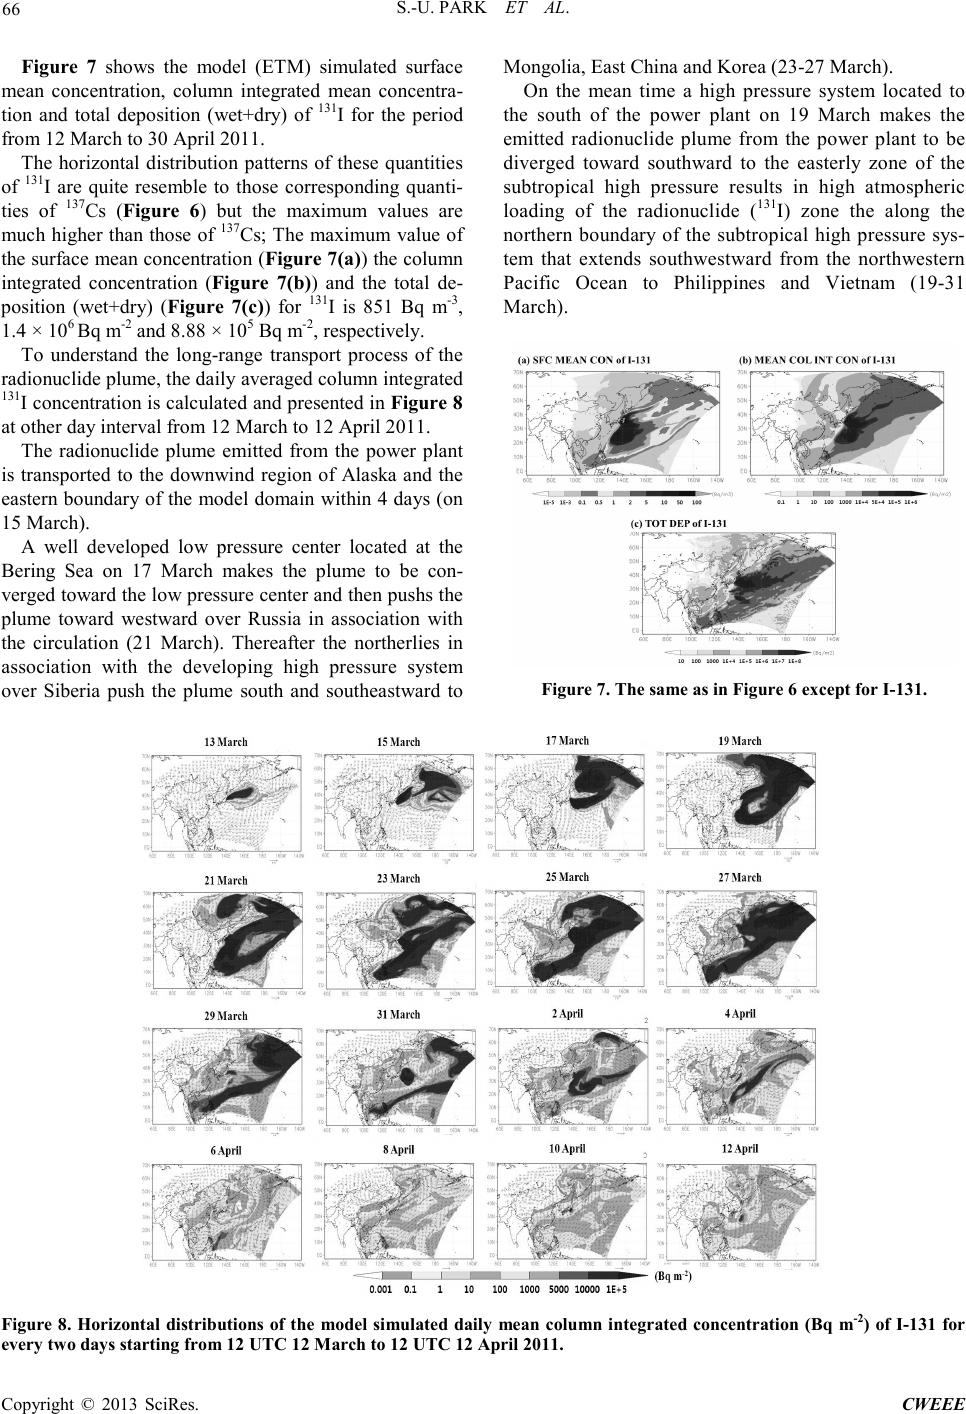 S.-U. PARK ET AL. Copyright © 2013 SciRes. CWEEE 66 Figure 7 shows the model (ETM) simulated surface mean concentration, column integrated mean concentra- tion and total deposition (wet+dry) of 131I for the period from 12 March to 30 April 2011. The horizontal distribution patterns of these quantities of 131I are quite resemble to those corresponding quanti- ties of 137Cs (Figure 6) but the maximum values are much higher than tho se of 137Cs; The ma ximum va lue of the surface mean concentration (Figure 7(a)) the column integrated concentration (Figure 7(b)) and the total de- position (wet+dry) (Figure 7(c)) for 131I is 851 Bq m-3, 1.4 × 10⁶ Bq m-2 and 8.88 × 10⁵ Bq m-2, respectively. To understand the long-range transport process of the radionuclide plume, the daily averaged column integrated 131I concentration is calculated and presented in Figure 8 at other day interval from 12 March to 12 April 2011. The radionuclide plume emitted from the power plant is transported to the downwind region of Alaska and the eastern boundary of the model domain within 4 days (on 15 March). A well developed low pressure center located at the Bering Sea on 17 March makes the plume to be con- verge d to ward the lo w pre ssur e c enter and then pus hs t he plume toward westward over Russia in association with the circulation (21 March). Thereafter the northerlies in association with the developing high pressure system over Siberia push the plume south and southeastward to Mongolia, East China and Korea (23-27 March). On the mean time a high pressure system located to the south of the power plant on 19 March makes the emitted radionuclide plume from the power plant to be diverged toward southward to the easterly zone of the subtropical high pressure results in high atmospheric loading of the radionuclide (131I) zone the along the northern boundary of the subtropical high pressure sys- tem that extends southwestward from the northwestern Pacific Ocean to Philippines and Vietnam (19-31 March). Figure 7 . The same as in Figure 6 except for I-131. Figure 8. Horizontal distributions of the model si mulated dail y mean colu mn integr ated concentr ation (B q m-2) of I-131 for every two days starting from 12 UTC 12 March to 12 UTC 12 April 2011. 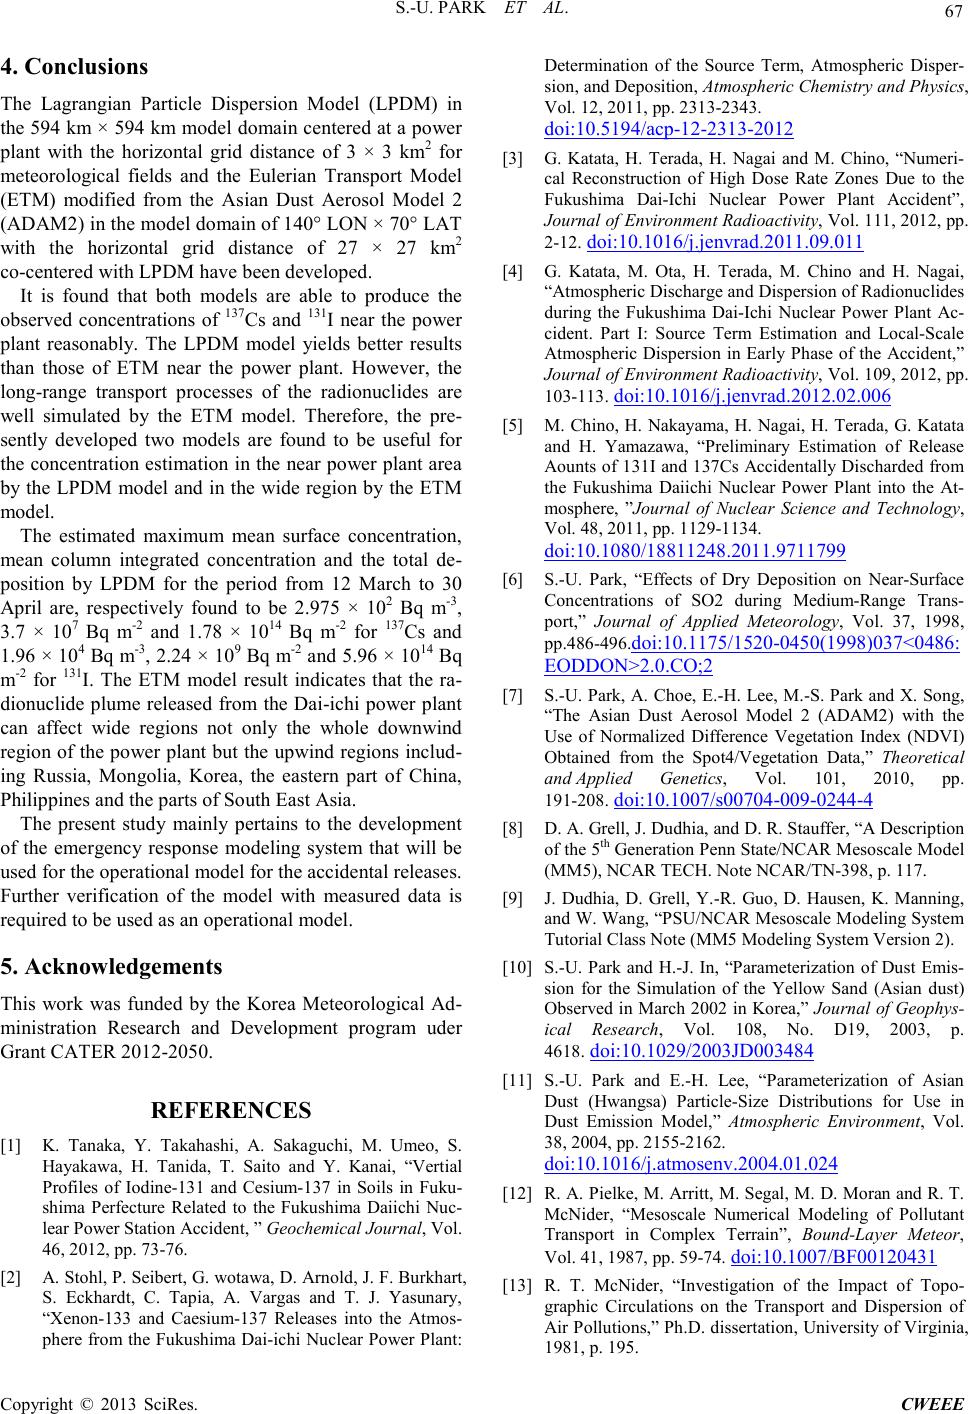 S.-U. PARK ET AL. Copyright © 2013 SciRes. CWEEE 67 4. Conclusions The Lagrangian Particle Dispersion Model (LPDM) in the 594 km × 594 km model domain centered at a power plant with the horizontal grid distance of 3 × 3 km2 for meteorological fields and the Eulerian Transport Model (ETM) modified from the Asian Dust Aerosol Model 2 (ADAM2) in the model domain of 140° LON × 70° LAT with the horizontal grid distance of 27 × 27 km2 co-centered with LPDM have been developed. It is found that both models are able to produce the observed concentrations of 137Cs and 131I near the power plant reasonably. The LPDM model yields better results than those of ETM near the power plant. However, the long-range transport processes of the radionuclides are well simulated by the ETM model. Therefore, the pre- sently developed two models are found to be useful for the concentration estimation in the near power plant area by the LP DM model and i n the wid e regi on by the ETM model. The estimated maximum mean surface concentration, mean column integrated concentration and the total de- position by LPDM for the period from 12 March to 30 April are, respectively found to be 2.975 × 10² Bq m-3, 3.7 × 10⁷ Bq m-2 and 1.78 × 10¹⁴ Bq m-2 for 137Cs and 1.96 × 10⁴ Bq m-3, 2.24 × 10⁹ Bq m-2 and 5.96 × 10¹⁴ Bq m-2 for 131I. The ETM model result indicates that the ra- dionuclide plume released from the Dai-ichi power plant can affect wide regions not only the whole downwind regio n of the p ower p lant but the up wind reg ions incl ud- ing Russia, Mongolia, Korea, the eastern part of China, Philippines and the parts of South East Asia. The present study mainly pertains to the development of the emergency response modeling system that will be used for the operational model for the accidental releases. Further verification of the model with measured data is required to be used as an operational model. 5. Acknowledgements This work was funded by the Korea Meteorological Ad- ministration Research and Development program uder Grant CATER 2012-2050. REFERENCES [1] K. Tanaka, Y. Takahashi, A. Sakaguchi, M. Umeo, S. Hayakawa, H. Tanida, T. Saito and Y. Kanai, “Vertial Profiles of Iodine-131 and Cesium-137 in Soils in Fuku- shima Perfecture Related to the Fukushima Daiichi Nuc- lear Po wer Statio n Accident , ” Geochemical Journal, Vol. 46, 2012 , pp. 73-76. [2] A. Stohl, P. Seibert, G. wotawa, D. Arnold, J. F. Burkhart, S. Eckhardt, C. Tapia, A. Vargas and T. J. Yasunary, “Xenon-133 and Caesium-137 Releases into the Atmos- phere from the Fukushima Dai-ichi Nuclear Power Plant: Determination of the Source Term, Atmospheric Disper- sion, and Deposition, Atmospheric Chemistry and Physics, Vol. 12, 2011, pp. 2313-2343. doi:10.5194/acp-12-2313-2012 [3] G. Katata, H. Terada, H. Nagai and M. Chino, “Numer i- cal Reconstruction of High Dose Rate Zones Due to the Fukushima Dai-Ichi Nuclear Power Plant Accident”, Journal of Environment Radioactivity, Vol. 111, 2012, pp. 2-12. doi:10.1016/j.jenvrad.2011.09.011 [4] G. Katata, M. Ota, H. Terada, M. Chino and H. Nagai, “Atmospheric Dischar ge and Dispersion of Radionuclides during the Fukushima Dai-Ichi Nuclear Power Plant Ac- cident. Part I: Source Term Estimation and Local-Scale Atmospheric Dispersion in Early Phase of the Accident,” Journal of Environment Radioactivity, Vol. 109, 2012, pp. 103-113. doi:10.1016/j.jenvrad.2012.02.006 [5] M. Chino, H. Nakayama, H. Nagai, H. Terada, G. Katata and H. Yamazawa, “Preliminary Estimation of Release Aounts of 131I and 137Cs Accidentally Di scharded fro m the Fukushima Daiichi Nuclear Power Plant into the At- mosphere, ”Journal of Nuclear Science and Technology, Vol. 48, 2011, pp. 1129-1134. doi:10.1080/18811248.2011.9711799 [6] S.-U. Park, “Effects of Dry Deposition on Near-Surface Concentrations of SO2 during Medium-Range Trans- port,” Journal of Applied Meteorology, Vol. 37, 1998, pp.486-496.doi:10.1175/1520-0450(1998)037<0486: EODDON>2.0.CO;2 [7] S.-U. Park, A. Choe, E.-H. Lee, M.-S . Park and X. Song, “The Asian Dust Aerosol Model 2 (ADAM2) with the Use of Normalized Difference Vegetation Index (NDVI) Obtained from the Spot4/Vegetation Data,” Theoret ical and Applied Genetics, Vol. 101, 2010, pp. 191-208. doi:10.1007/s00704-009-0244-4 [8] D. A. Grell, J. Dudhia, and D. R. Stauffer, “A Description of the 5th Generati on P enn State/NC AR Mesoscale Model (MM5), NCAR TECH. Note NCAR/TN-398, p. 117. [9] J. Dudhia, D. Grell, Y.-R. Guo, D. Hausen, K. Manning, and W. Wang, “PSU/NCAR Mesoscale Modeling System Tutorial Class Note (MM5 Modeling System Version 2). [10] S.-U. P ark and H.-J. In, “Par ameterization of Dust Emis- sion for the Simulation of the Yellow Sand (Asian dust) Observed in March 2002 in Korea,” Journal of Geophys- ical R esearch, Vol. 108, No. D19, 2003, p. 4618. doi:10.1029/2003JD003484 [11] S.-U. Park and E.-H. Lee, “Parameterization of Asian Dust (Hwangsa) Particle-Size Distributions for Use in Dust Emission Model,” Atmospheric Environment, Vol. 38, 2004, pp. 2155-2162. doi:10.1016/j.atmosenv.2004.01.024 [12] R. A. Pielke, M. Arritt, M. Segal, M. D. Moran and R. T. McNider, “Mesoscale Numerical Modeling of Pollutant Transport in Complex Terrain”, Bound-Layer Meteor, Vol. 41, 1987, pp. 59-74. doi:10.1007/BF00120431 [13] R. T. McNider, “Investigation of the Impact of Topo- graphic Circulations on the Transport and Dispersion of Air Pollutions,” Ph.D. dissertation, University of Virginia, 1981, p. 195.  S.-U. PARK ET AL. Copyright © 2013 SciRes. CWEEE 68 [14] T. Yamada, J. Kao, and S. Bunker, “Airflow and Air Quality Simulations over the Western Mountaineous Re- gion with a Four-Dimensional Data Assimilation Tech- nique,” Atmospheric Envi r onmen t, Vol.23, 1989, pp.539-554. doi:10.1016/0004-6981(89)90003-6 [15] W. L. Physick, and D. J. Abbs, “Modeling of Summer- time Flow and Dispersion in the Coastal Terrain of Sou- theastern Asutralia,” Monthly Weather Review, Vol.119, 1991,pp.1014-1030. doi:10.1175/1520-0493(1991)11 9<1014:MOSFAD>2.0.CO;2 [16] F. B. Smith, “Conditioned particle motion in a homogen- ous turbulent field,” Atmospheric Environment, Vol.2, 1968,pp.491-508.doi:10.1016/0004-6981(68)90042-5 [17] B. J. Legg, and M. R. Raupach, “Markov-Chain Simula- tions of Particle Deposition in Homogeneous Flows: The Mean Drift Velocity Induced by a Gradient in Eulerian Velocity Variance”, Bound.-Layer Meteor, Vol.24, 1982, pp.3-13. doi:10.1007/BF00121796 [18] M. L. Wesely, “Parameterization of Surface Resistances to Gaseous Dry Deposition in Regional-Scale Numerical Models,” Atmospheric Environment, Vol.23, 1989, pp.1293-1304. doi:10.1016/0004-6981(89)90153-4 [19] M. L. Wesel y and B. B. Hicks, “Some Factor s that Affect the Dispersion Rates of Sulfur Dioxide and Similar Gases on Vegetation ”, Journal of Air Pollution Control Associ- ation,Vol.27,1977,pp.1110-1116. doi:10.1080/00022470.1977.10470534 [20] C. J. Walcek, and G. R. Taylor, “A Theoretical Method for Computing Vertical Distributions of Acidity and Sul- fate Production within Cumulus Clouds,” J. Atmos. Sci., 43,1986,pp.339-355. doi:10.1175/1520-0469(1986)04 3<0339:ATMFCV>2.0.CO;2 [21] J. S. Chang, R. A. Brost, I. S. A. Isaksen, S. Madronich, P. Middleton, W. R. Stockwell and C. J. Walcek, “A Three-Dimensional Eulerian Acid Deposition Model: Physical Concepts and Formulation,” Journal of Geo- physical Research, Vol. 92, 1987, pp. 14681-14700. doi:10.1029/JD092iD12p14681 [22] R. L. Dennis, J. N. McHenry, W. R. Barchet, F. S. Bin- kovski and D. W. Byun, “Correcting RADM’s Sulfate Underprediction: Discovery and Correction of Model Er- rors and Testing the Corrections through Comparisons against Field Dat a,” A tmospheric En vironment, V ol. 27A, No. 6, 1993, pp. 975-997. [23] S. Furuta, S. Sumiya, H. Watanabe, M. Nakano, K. Imai- zumi, M. Takeyasu, A. Nakada, H. Fujita, T. Mizutani, M. Morisawa, Y. Kokubun, T. Kono, M. Nagaoka, Y. Hiya- ma, T. Onuma, C. Kato and T. Kurachi, “Results of the Environmental Radiation Monitoring Following the Ac- cident at the Fukushima Daiichi Nuclear Power Plant ,” JAEA-Review, Vol. 035, 2011, p. 89. |