

Paper Menu >>
Journal Menu >>
 Creative Education 2013. Vol.4, No.6A, 15-19 Published Online June 2013 in SciRes (http://www.scirp.org/journal/ce) http://dx.doi.org/10.4236/ce.2013.46A003 Copyright © 2013 SciRes. 15 Validity Evidence for Assessments on a UK Graduate Entry Medical Course Celia A. Taylor, Remi Zvauya School of Clinical and Experimental Medicine, University of Birmingham, Edgbaston, UK Email: [email protected] Received February 21st, 2013; revised March 23rd, 2013; accepted March 30th, 2013 Copyright © 2013 Celia A. Taylor, Remi Zvauya. This is an open access article distributed under the Creative Commons Attribution License, which permits unrestricted use, distribution, and reproduction in any medium, provided the original work is properly cited. Graduate entry medical courses (GEC) have been introduced into the UK to increase the supply of doctors and to widen participation. In addition to evaluation against these outcomes, the educational process should also be evaluated. One aspect of process is assessment and different types of validity evidence for the assessments used should be provided. This paper provides validity evidence for the assessments on a UK GEC, focusing on the 2010/11 assessment diet. The types of validity evidence provided are content, internal structure, relationship with other variables and consequences. Students’ GEC assessment results are used to determine whether or not students should progress to Year 3 on the traditional course. 66% of the learning outcome/body system combinations in the assessment specification for Years 1 & 2 of the traditional course were assessed in one assessment diet. Short answer questions performed “best” in terms of difficulty and discrimination. The reliability of three modules was just outside the recommended range of 0.7 to 0.9. GEC performance is at least as good a predictor of final year performance as Year 1/2 per- formance on the traditional course. Across the six written modules for 2010/11, 12 scores (5%) were in the borderline range. Judgement regarding the validity of interpretations made from GEC assessment re- sults is left to the reader since such judgements should not be made by those providing the validity evi- dence. Similar studies should aim to use benchmarks to enable results to be more objectively evaluated. Keywords: Graduate Entry Medicine; Assessment; Validity Introduction While in the USA and Canada most medical students have already completed an undergraduate degree before beginning their medical training, the majority of entrants to medical school in the UK and in many other countries are school leavers aged 18 - 19. Following a similar initiative in Australia, since 2000 15 UK medical schools have introduced four-year gradu- ate entry courses (GEC). As part of a larger expansion of UK medical schools, there were two main reasons for the introduc- tion of GEC: the need to quickly increase the supply of doctors and to attract students from a broader range of social back- grounds (Department of Health, 2004). Evaluation of Gradua te Entry Courses Given the relatively recent introduction of GEC in the UK, it is important to evaluate the impact of such courses. In terms of student ‘inputs’, evidence from both Australia and the UK sug- gests that GEC have had little impact in increasing diversity (Powis et al., 2004; Mathers et al., 2011). In terms of under- graduate outcomes, a number of recent articles have shown that graduates from UK GEC perform at least as well as students on five year traditional courses (TC) by the time they graduate (Calvert et al., 2009; Manning & Garrud, 2009; Price & Wright, 2010; Shehmar et al., 2010). There is some evidence from Aus- tralia that GEC students are at least as well prepared for their first jobs as TC students (Dean et al., 2003), but longer-term evidence regarding postgraduate performance outcomes is not yet available. As well as considering inputs and outcomes, it is also impor- tant to evaluate the educational process of the GEC themselves. One critical aspect of process, for which there is little published evidence, is assessment validity. Validity is a key requirement in the General Medical Council’s (GMC) document Tomor- row’s Doctors (GMC, 2009) and is one of the components of assessment utility identified by Van der Vleuten (Van der Vleuten, 1996). As described by Shaw and colleagues, “validity is concerned with the appropriateness or correctness of infer- ences, decisions or descriptions made about individuals, groups, or institutions from test results” (Shaw et al., 2012: p. 162). Validity is particularly important to ensure against two types of error, both of which have implications for students, medical schools and patients: false negatives (failing a competent stu- dent) and false positives (passing an incompetent student). Based on the 1999 edition of the Standards for Educational and Psychological Testing (American Educational Research Association et al., 1999), Downing highlights that validity is now considered a unified concept and that evidence should be provided on five different aspects: content, response process, internal structure, relationship with other variables and conse- quences (Downing, 2003). There are only three examples of a unified approach being 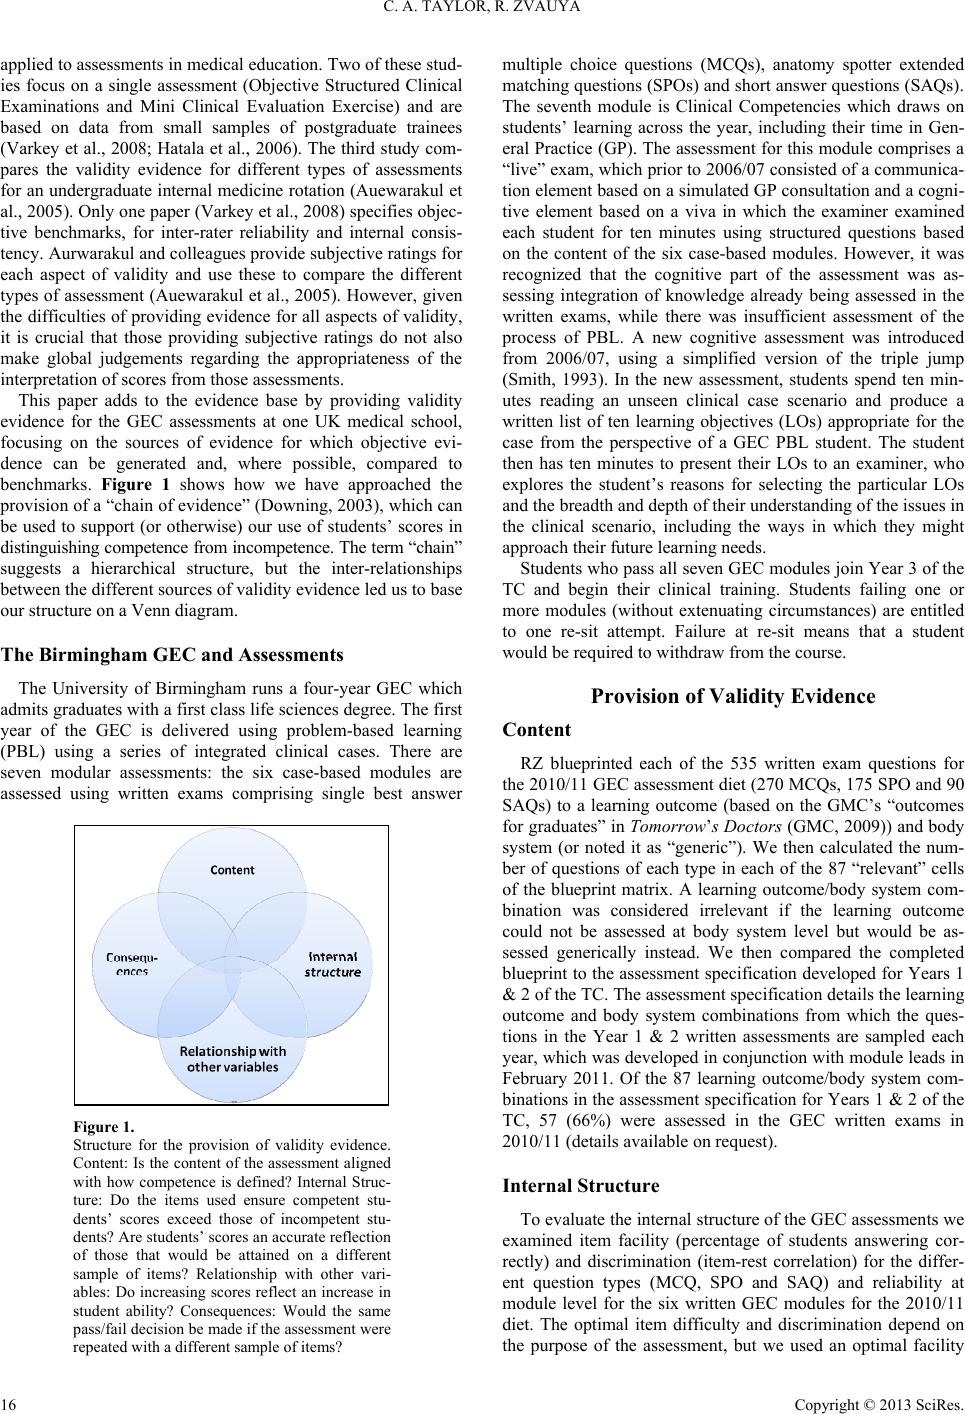 C. A. TAYLOR, R. ZVAUYA applied to assessments in medical education. Two of these stud- ies focus on a single assessment (Objective Structured Clinical Examinations and Mini Clinical Evaluation Exercise) and are based on data from small samples of postgraduate trainees (Varkey et al., 2008; Hatala et al., 2006). The third study com- pares the validity evidence for different types of assessments for an undergraduate internal medicine rotation (Auewarakul et al., 2005). Only one paper (Varkey et al., 2008) specifies objec- tive benchmarks, for inter-rater reliability and internal consis- tency. Aurwarakul and colleagues provide subjective ratings for each aspect of validity and use these to compare the different types of assessment (Auewarakul et al., 2005). However, given the difficulties of providing evidence for all aspects of validity, it is crucial that those providing subjective ratings do not also make global judgements regarding the appropriateness of the interpretation of scores from those assessments. This paper adds to the evidence base by providing validity evidence for the GEC assessments at one UK medical school, focusing on the sources of evidence for which objective evi- dence can be generated and, where possible, compared to benchmarks. Figure 1 shows how we have approached the provision of a “chain of evidence” (Downing, 2003), which can be used to support (or otherwise) our use of students’ scores in distinguishing competence from incompetence. The term “chain” suggests a hierarchical structure, but the inter-relationships between the different sources of validity evidence led us to base our structure on a Venn diagram. The Birmingham GEC and Assessments The University of Birmingham runs a four-year GEC which admits graduates with a first class life sciences degree. The first year of the GEC is delivered using problem-based learning (PBL) using a series of integrated clinical cases. There are seven modular assessments: the six case-based modules are assessed using written exams comprising single best answer Figure 1. Structure for the provision of validity evidence. Content: Is the content of the assessment aligned with how competence is defined? Internal Struc- ture: Do the items used ensure competent stu- dents’ scores exceed those of incompetent stu- dents? Are students’ scores an accurate reflection of those that would be attained on a different sample of items? Relationship with other vari- ables: Do increasing scores reflect an increase in student ability? Consequences: Would the same pass/fail decision be made if the assessment were repeated with a different sample of items? multiple choice questions (MCQs), anatomy spotter extended matching questions (SPOs) and short answer questions (SAQs). The seventh module is Clinical Competencies which draws on students’ learning across the year, including their time in Gen- eral Practice (GP). The assessment for this module comprises a “live” exam, which prior to 2006/07 consisted of a communica- tion element based on a simulated GP consultation and a cogni- tive element based on a viva in which the examiner examined each student for ten minutes using structured questions based on the content of the six case-based modules. However, it was recognized that the cognitive part of the assessment was as- sessing integration of knowledge already being assessed in the written exams, while there was insufficient assessment of the process of PBL. A new cognitive assessment was introduced from 2006/07, using a simplified version of the triple jump (Smith, 1993). In the new assessment, students spend ten min- utes reading an unseen clinical case scenario and produce a written list of ten learning objectives (LOs) appropriate for the case from the perspective of a GEC PBL student. The student then has ten minutes to present their LOs to an examiner, who explores the student’s reasons for selecting the particular LOs and the breadth and depth of their understanding of the issues in the clinical scenario, including the ways in which they might approach their future learning needs. Students who pass all seven GEC modules join Year 3 of the TC and begin their clinical training. Students failing one or more modules (without extenuating circumstances) are entitled to one re-sit attempt. Failure at re-sit means that a student would be required to withdraw from the course. Provision of Validity Evidence Content RZ blueprinted each of the 535 written exam questions for the 2010/11 GEC assessment diet (270 MCQs, 175 SPO and 90 SAQs) to a learning outcome (based on the GMC’s “outcomes for graduates” in Tomorrow’s Doctors (GMC, 2009)) and body system (or noted it as “generic”). We then calculated the num- ber of questions of each type in each of the 87 “relevant” cells of the blueprint matrix. A learning outcome/body system com- bination was considered irrelevant if the learning outcome could not be assessed at body system level but would be as- sessed generically instead. We then compared the completed blueprint to the assessment specification developed for Years 1 & 2 of the TC. The assessment specification details the learning outcome and body system combinations from which the ques- tions in the Year 1 & 2 written assessments are sampled each year, which was developed in conjunction with module leads in February 2011. Of the 87 learning outcome/body system com- binations in the assessment specification for Years 1 & 2 of the TC, 57 (66%) were assessed in the GEC written exams in 2010/11 (details available on request). Internal Structure To evaluate the internal structure of the GEC assessments we examined item facility (percentage of students answering cor- rectly) and discrimination (item-rest correlation) for the differ- ent question types (MCQ, SPO and SAQ) and reliability at module level for the six written GEC modules for the 2010/11 diet. The optimal item difficulty and discrimination depend on the purpose of the assessment, but we used an optimal facility Copyright © 2013 SciRes. 16  C. A. TAYLOR, R. ZVAUYA Copyright © 2013 SciRes. 17 range of 20% - 80% and a minimum discrimination value of 0.2. We evaluated reliability at module level using Cronbach’s al- pha, with a benchmark coefficient between 0.7 and 0.9 (Streiner & Norman, 2003). The percentage of each type of question meeting the item fa- cility and discrimination targets and the reliability of the written assessment as a whole for each module is shown in Table 1. Across the six modules, SAQs perform “best” in terms of both facility and discrimination, which would be expected given the scoring process for SAQs (each marked out of ten) compared to MCQs and SPOs (which have one mark each). Three of the six reliability coefficients are in the recommended range of 0.7 to 0.9, with the other three just below this. Relationship with Other Variables We analyzed anonymous performance data for all 331 stu- dents who began the GEC course between 2003 and 2010 and for all 687 students who completed the TC in 2010 or 2011. As appropriate, the following data were obtained for each student, with first sit, standard-set marks used: Year of entry; GEC written score (mean across all six modules), live exam score and weighted average score; Year 1 & 2 weighted average score; Final year weighted average score. Weighted average scores are used to aggregate student per- formance across the MBChB and identify which students are eligible for the award of MBChB with Honours. The weight used for each assessment is determined by the module credit value although the weights on modules in the last three years and on all clinical modules are increased by 25%. The GEC dataset was split into two groups based on the type of live exam undertaken: Knowledge (those matriculating in 2003-5) and Process (2006-10). We calculated convergent/divergent correlations between GEC written and live scores. Given the change in focus of the assessment, we would expect a higher positive correlation when the live exam was assessing knowledge compared to when it was assessing process. We also compared the correlations be- tween weighted average GEC/TC Years 1 & 2 performance and final year performance for students graduating in 2010 and 2011. As the data were normally distributed, we used Pearson correlation coefficients to evaluate these relationships. Correla- tion coefficients from the different groups (Knowledge vs. Process and GEC vs. TC) were compared using Fisher’s r-to-z transformation (Lowry, 2012). P-values < 0.05 were considered statistically significant. Where appropriate, the Bonferroni ad- justment was used to correct p-values for multiple comparisons. Figure 2 shows the relationship between GEC written and live scores for the Knowledge and Process groups. There is a stronger positive correlation between written and live scores for the Knowledge group (r = 0.67) when compared to the Process group (r = 0.18): z = 5.42, p < 0.001, suggesting that different skills are being assessed in the new live exam. Table 2 shows the Pearson correlation coefficients between GEC/Year 1 & 2 and final year weighted averages for the co- horts of students graduating in 2010 and 2011. All four indi- vidual correlation coefficients are statistically significant at p < 0.001. The correlations for GEC are higher than for the TC, but not statistically significantly so, suggesting that GEC perform- ance is at least as good a predictor of final year performance as TC Year 1 & 2 performance. Consequences We assessed pass mark reliability for each written module in the 2010/11 assessment diet by calculating the percentage of the cohort in each of four groups: clear fail, borderline fail, borderline pass and clear pass. The “regression-based” approach was used to assess pass mark reliability, which uses students’ estimated true scores (ETS) and controls for regression to the Table 1. Internal structure by module. N Questions Facility (% Questions) Discrimination IR Corr (% Questions) Overall Reliability (Alpha) Module <20% “Hard ” 20% - 80%>80% “Easy ” >0.2 1 MCQ 45 SPO 30 SAQ 15 0 23 0 60 63 93 40 13 7 24 23 53 0.675 2 MCQ 45 SPO 30 SAQ 15 2 7 0 67 57 100 31 37 0 27 33 60 0.652 3 MCQ 45 SPO 30 SAQ 15 9 13 0 64 73 100 27 13 0 40 47 93 0.814 4 MCQ 45 SPO 30 SAQ 15 0 10 0 56 73 93 44 17 7 31 63 53 0.763 5 MCQ 45 SPO 30 SAQ 15 0 10 0 53 77 80 47 13 20 27 40 80 0.798 6 MCQ 45 SPO 25 SAQ 15 18 8 0 67 56 93 16 36 7 29 20 47 0.662 N ote: percentages may not sum to 100% due to rounding. Facility for the SAQs is based on the total question score (out of a possible 10 marks).  C. A. TAYLOR, R. ZVAUYA Figure 2. Relationship between GEC written and live exam scores, by type of live exam (knowledge or process). Table 2. Correlations between GEC/Year 1 & 2 and final year weighted averages. Year TC Year 1 & 2 GEC Comparison of Correlation Coefficients 2010 r = 0.62 (n = 363) p < 0.001 r = 0.65 (n = 38) p < 0.001 Z = −0.64 p = 1.000 2011 r = 0.55 (n = 324) p < 0.001 r = 0.78 (n = 39) p < 0.001 Z = −2.46 p = 0.083 Note: p-values have been corrected for multiple comparisons using the Bonferroni adjustment. mean (Harvill, 1991). Borderline boundaries were one standard error of the estimate (SEE) above and below the pass mark. Figure 3 shows the percentage of students in each of the four outcome categories by module. The percentage of students classified as “borderline” ranges from 0% to 15% across the six modules. Evaluation of Validity Evidence The assessments for which we have provided validity evi- dence are used to determine whether students should progress into Year 3 of the TC: while students have to pass other as- sessments before graduating, it is important that GEC pass/fail decisions are both accurate and fair. Interpreting the results presented in this paper to determine the appropriateness of these decisions is left to the reader. This is because provision of the evidence must be independent of interpretation of the evi- dence in order to avoid bias. We were unable to find any studies using blueprints to assess content validity; and neither could we find any published re- ports of pass mark reliability in the literature. The former may be due to controversy regarding whether or not blueprints should be published (McLaughlin et al., 2005) and the latter to concerns about students using the data as a basis to appeal fail decisions. Because all 2010/11 GEC students failing their first attempt at a module passed their re-sit, no false negative deci- sions were made. While the re-sitting students may have just passed their first attempt if the exam was held on a different Figure 3. Pass mark reliability, by module. SEE: Standard error of the estimate. day with different questions, erring on the side of caution helps ensure medical schools do not graduate incompetent students. We have not been able to evaluate whether the GEC pass marks were set at the right level, since this would require Year 3 score data for students who had both passed and failed the GEC as- sessments. Notwithstanding these concerns, we believe multiple sources of validity evidence data should be published, particularly where benchmarks are available against which such data can be evaluated. Such data can be used as a starting point for qualita- tive work to explain differences in validity evidence across assessments (and across educational institutions) and therefore to identify ways in which assessments can be improved. An example from the data reported here, which also highlights the inter-relationships between the different sources of validity evidence, is the need to compare the characteristics of the writ- ten questions meeting the facility and discrimination targets with those that do not, and to revise the poorly-performing questions appropriately. This review should improve the reliability (internal consis- tency) of the assessments, but this must be achieved without reducing the spread of learning outcomes being assessed (i.e. by jeopardizing content validity). We have also shown how validity evidence can be used to evaluate changes in the assessment process; the importance of which is highlighted by Cook and Beckman (Cook & Beckman, 2006). The change in focus of the live exam from knowledge to process appears to have had the desired effect of having the live exam assess different skills to the written exam. The new exam included assessment of communication skills, dealing with uncertainty, synthesis of new information and writing learning objectives; all essential skills during the students’ clinical years and beyond. It is vital that these skills are nurtured early on and that students who may struggle to manage their own learning in the clinical years can be identified and supported. Providing validity evidence is rarely straightforward: while we have shown that GEC performance is an excellent predictor of final year performance, the ‘ultimate’ outcome is postgradu- ate performance, for which final year performance is a reason- able, but not excellent, predictor (Hamdy et al., 2006). In addi- tion, we have not been able to provide objective evidence on all aspects of validity identified by Downing (Downing, 2003) and it is important to remember that validity is only one component of assessment utility (Van der Vleuten, 1996). Our results only relate to inferences made on the basis of the particular diet(s) of Copyright © 2013 SciRes. 18  C. A. TAYLOR, R. ZVAUYA assessments considered and cannot be generalized to the as- sessments themselves. Nevertheless, we would encourage oth- ers to undertake similar work, so that more generalizable les- sons can be learned. Acknowledgements The authors wish to thank Angela Priestman, Trudy Knight, Camelia Arsene, Christine Wright and Mary Stevenson for their suggestions on drafts of this paper. REFERENCES American Educational Research Association, American Psychological Association & National Council on Measurement in Education (1999). Standards for educational and psychological testing. Wash- ington, DC: American Educational Research Association. Auewarakul, C., Downing, S. M., Jaturatamrong, U., & Praditsuwan, R. (2005). Sources of validity evidence for an internal medicine student evaluation system: An evaluative study of assessment methods. Me- dical Education, 39, 276-283. doi:10.1111/j.1365-2929.2005.02090.x Calvert, M. J., Ross, N. M., Freemantle, N., Xu, Y., Zvauya, R., & Parle, J. V. (2009). Examination performance of graduate entry medical students compared with mainstream students. Journal of the Royal Society of Medicine, 102, 425-430. doi:10.1258/jrsm.2009.090121 Cook, D. A., & Beckman, T. J. (2006). Current concepts in validity and reliability for psychometric instruments: Theory and application. The American Journal of Medicine, 119, 166.e7-166.e16. doi:10.1016/j.amjmed.2005.10.036 Dean, S. J., Barratt, A. L., Hendry, G. D., & Lyon, P. M. A. (2003). Preparedness for hospital practice among graduates of a problem- based, graduate-entry medical program. Medical Journal of Australia, 178, 163-166. Department of Health (2004). Medical schools: Delivering doctors of the future. London: Department of Health. Downing, S. M. (2003). Validity: On the meaningful interpretation of assessment data. Medical Educati on, 37, 830-837. doi:10.1046/j.1365-2923.2003.01594.x GMC (2009). Tomorrow’s doctors. London: General Medical Council. Hamdy, H., Prasad, K., Anderson, M. B., Scherpbier, A., Williams, R., Zwierstra, R., et al. (2006). BEME systematic review: Predictive values of measurements obtained in medical schools and future per- formance in medical practice. Medical Teacher, 28, 103-116. doi:10.1080/01421590600622723 Harvill, L. M. (1991). Standard error of measurement. Educationa l Mea- surement: Issues and Prac t i ce , 10, 33-41. doi:10.1111/j.1745-3992.1991.tb00195.x Hatala, R., Ainslie, M., Kassen, B. O., Mackie, I., & Roberts, J. M. (2006). Assessing the mini-clinical evaluation exercise in compari- son to a national specialty examination. Medical Education, 40, 950- 956. doi:10.1111/j.1365-2929.2006.02566.x Lowry, R. (2012). Significance of the difference between two correla- tion coefficients. URL (last checked 24 April 2012). http://vassarstats.net/rdiff.html Manning, G., & Garrud, P. (2009). Comparative attainment of 5-year undergraduate and 4-year graduate entry medical students moving into foundation training. BMC Medical Education, 9, 76. doi:10.1186/1472-6920-9-76 Mathers, J., Sitch, A., Marsh, J. L., & Parry, J. (2011). Widening access to medical education for under-represented socioeconomic groups: Population based cross sectional analysis of UK data, 2002-6. British Medical Journal, 342, d918. doi:10.1136/bmj.d918 McLaughlin, K., Coderre, S., Woloschuk, W., & Mandin, H. (2005). Does blueprint publication affect students’ perception of validity of the evaluation process? Advances in Health Sciences Education, 10, 15-22. doi:10.1007/s10459-004-8740-x Powis, D., Hamilton, J., & Gordon, J. (2004). Are graduate entry pro- grammes the answer to recruiting and selecting tomorrow’s doctors? Medical Education, 38, 1147-1153. doi:10.1111/j.1365-2929.2004.01986.x Price, R., & Wright, S. R. (2010). Comparisons of examination per- formance between “conventional” and Graduate Entry Programme students; the Newcastle experience. Medical Teacher, 32, 80-82. doi:10.3109/01421590903196961 Shaw, S., Crisp, V., & Johnson, N. (2012). A framework for evidencing assessment validity in large-scale, high-stakes international examina- tions. Assessment in Education: Principles, Policy & Practice, 19, 159-176. doi:10.1080/0969594X.2011.563356 Shehmar, M., Haldane, T., Price-Forbes, A., Macdougall, C., Fraser, I., Peterson, S., et al. (2010). Comparing the performance of graduate- en- try and school-leaver medical students. Medical Education, 44, 699-705. doi:10.1111/j.1365-2923.2010.03685.x Smith, R. M. (1993). The triple-jump examination as an assessment tool in the problem-based medical curriculum at the University of Hawaii. Academic Medicine, 68, 366. doi:10.1097/00001888-199305000-00020 Streiner, D., & Norman, G. (2003). Health measurement scales: A prac- tical guide to their development and use (3rd ed.). Oxford: Oxford University Press. Van der Vleuten, C. (1996). The assessment of professional compe- tence: Developments, research and practical implications. Advances in Health Sciences Education, 1 , 41-67. doi:10.1007/BF00596229 Varkey, P., Natt, N., Lesnick, T., Downing, S., & Yudkowsky, R. (2008). Validity evidence for an OSCE to assess competency in sys- tems-based practice and practice-based learning and improvement: A preliminary investigation. Academic Medicine, 83, 775-780. doi:10.1097/ACM.0b013e31817ec873 Copyright © 2013 SciRes. 19 |