

Paper Menu >>
Journal Menu >>
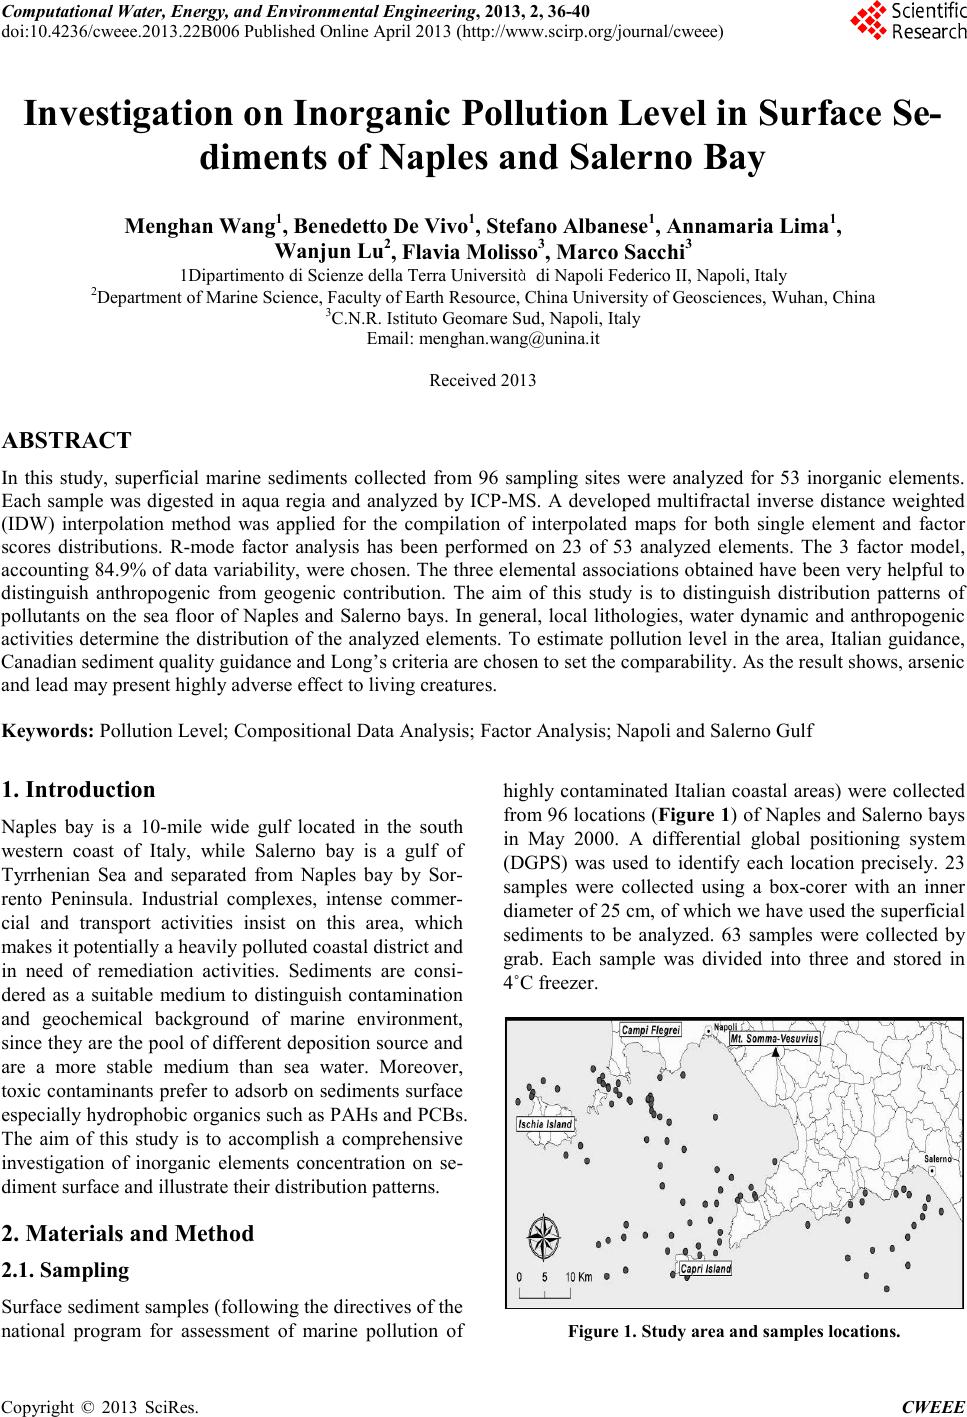 Computational Water, Energy, and Environmental Engineering, 2013, 2, 36-40 doi:10.4236/cweee.2013.22B006 Published Online April 2013 (http://www.scirp. org/journal/cweee) Copyright © 2013 SciRes. CWEEE Investigation on Inorganic Pollution Level in Surface Se- diments of Naples and Salerno Bay Menghan Wang1, Benedetto De Vivo1, Stefano Albanese1, Annamaria Lima1, Wanjun Lu2, Flavia Molisso3, Marco Sacchi3 1Dipartimento di Scienze della Terra Università di Napoli Federico II, Napoli, Italy 2Department of Marine Science, Faculty of Earth Resource, China University of Geosciences, Wuhan, China 3C.N.R. Istituto Geomare Sud, Napoli, Italy Email: [email protected] Received 2013 ABSTRACT In this study, superficial marine sediments collected from 96 sampling sites were analyzed for 53 inorganic elements. Each sample was digested in aqua regia and analyzed by ICP-MS. A developed multifractal inverse distance weighted (IDW) interpolation method was applied for the compilation of interpolated maps for both single element and factor scores distributions. R-mode factor analysis has been performed on 23 of 53 analyzed elements. The 3 factor model, accounting 84.9% of data variability, were chosen. The three elemental associations obtained have been very helpful to distinguish anthropogenic from geogenic contribution. The aim of this study is to distinguish distribution patterns of pollutants on the sea floor of Naples and Salerno bays. In general, local lithologie s, water dynamic and anthropogenic activities determine the distribution of the analyzed elements. To estimate pollution level in the area, Italian guidance, Canadian sediment quality guidance and Long’s criteria are chosen to set the comparability. As the result shows, arse nic and lead may present highly adverse effect to living creatures. Keywords: Pollution Le ve l; Compositional Data Analysis; Factor Ana l ysis; Napoli and Salerno Gulf 1. Introduction Naples bay is a 10-mile wide gulf located in the south western coast of Italy, while Salerno bay is a gulf of Tyrrhenian Sea and separated from Naples bay by Sor- rento Peninsula. Industrial complexes, intense commer- cial and transport activities insist on this area, which makes it potentially a heavily polluted coastal district and in need of remediation activities. Sediments are consi- dered as a suitable medium to distinguish contamination and geochemical background of marine environment, since they are the pool of different deposition source and are a more stable medium than sea water. Moreover, toxic contaminants prefer to adsorb on sediments surface especially hydrophobic organics such as PAHs and PCBs. The aim of this study is to accomplish a comprehensive investigation of inorganic elements concentration on se- diment surface and illustrate their distribution patterns. 2. Materials and Metho d 2.1. Sampling Surface sediment samples (following the directives of the national program for assessment of marine pollution of highly contaminated Italian coastal areas) were collected from 96 locations (Figure 1) of Naples and Salerno bays in May 2000. A differential global positioning system (DGPS) was used to identify each location precisely. 23 samples were collected using a box-corer with an inner diameter of 25 cm, of which we have used the superficial sediments to be analyzed. 63 samples were collected by grab. Each sample was divided into three and stored in 4˚C freezer. Figure 1. Study area and samples locations. 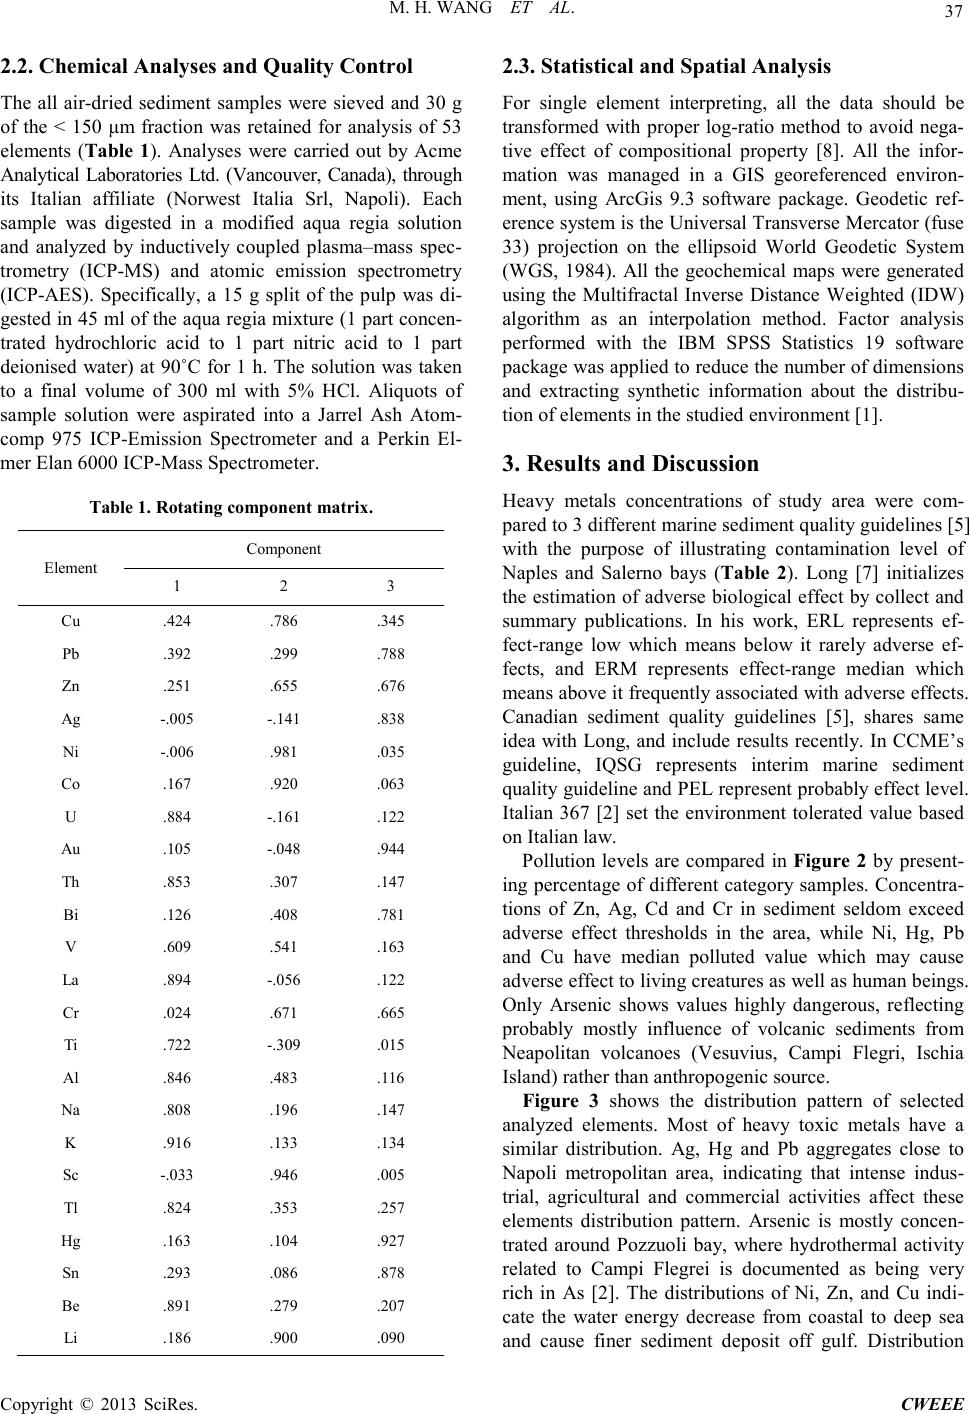 M. H. WANG ET AL. Copyright © 2013 SciRes. CWEEE 37 2.2. Chemical Analyses and Quality Control The all air-dried sediment samples were sieved and 30 g of the < 150 μm fraction was retained for analysis of 53 elements (Table 1). Analyses were carried out by Acme Analytical Laboratories Ltd. (Vancouver, Canada), through its Italian affiliate (Norwest Italia Srl, Napoli). Each sample was digested in a modified aqua regia solution and analyzed by inductively coupled plasma–mass spec- trometry (ICP-MS) and atomic emission spectrometry (ICP-AES). Specifically, a 15 g split of the pulp was di- gested in 45 ml of the aqua regia mixture (1 part concen- trated hydrochloric acid to 1 part nitric acid to 1 part deionised water) at 90˚C for 1 h. The solution was taken to a final volume of 300 ml with 5% HCl. Aliquots of sample solution were aspirated into a Jarrel Ash Atom- comp 975 ICP-Emission Spectrometer and a Perkin El- mer Elan 6000 ICP-Mass Spectrometer. Table 1. Rotating component matrix. Element Compon ent 1 2 3 Cu .424 .78 6 .34 5 Pb .392 . 299 . 788 Zn .251 .65 5 .67 6 Ag -.005 -.141 .83 8 Ni -.006 .981 . 035 Co .167 .92 0 .06 3 U .884 -.161 .12 2 Au .105 -.048 .94 4 Th .853 .30 7 .14 7 Bi .126 .40 8 .78 1 V .609 . 541 . 163 La .89 4 -.056 .12 2 Cr .024 . 671 . 665 Ti . 722 -.309 . 015 Al .846 .48 3 . 11 6 Na .80 8 .19 6 .14 7 K .916 . 133 . 134 Sc -.033 .946 . 005 Tl .824 . 353 . 257 Hg .163 .104 .92 7 Sn .293 . 086 . 878 Be .891 .27 9 .20 7 Li .186 . 900 . 090 2.3. Statistical and Spatial Analysi s For single element interpreting, all the data should be transformed with proper log-ratio method to avoid nega- tive effect of compositional property [8]. All the infor- mation was managed in a GIS georeferenced environ- ment, using ArcGis 9.3 software package. Geodetic ref- erence system is the Universal Transverse Mercator (fuse 33) projection on the ellipsoid World Geodetic System (WGS, 1984). All the geochemical maps were generated using the Multifractal Inverse Distance Weighted (IDW) algorithm as an interpolation method. Factor analysis performed with the IBM SPSS Statistics 19 software package was applied to reduce the number of dimensions and extracting synthetic information about the distribu- tion of elements in the studied enviro n me nt [1]. 3. Results and Discussion Heavy metals concentrations of study area were com- pared to 3 different marine sediment quality guidelines [5] wit h the purpose of illustrating contamination level of Naples and Salerno bays (Table 2). Long [7] initialize s the estimation of adverse biological effect by collect and sum mary publications. In his work, ERL represents ef- fect-range low which means below it rarely adverse ef- fects, and ERM represents effect-range median which means above it frequentl y associated with adverse effects. Canadian sediment quality guidelines [5], shares same idea with Long, and include results recently. In CCME’s guideline, IQSG represents interim marine sediment quality guideline and PEL represent probably effect level. Italian 367 [2] set the envi ro nmen t tolerated value based on Italian law. Pollution levels are compared in Figure 2 by present- ing percentage of different category samples. Concentra- tions of Zn, Ag, Cd and Cr in sediment seldom exceed adverse effect thres ho ld s in the area, while Ni, Hg, Pb and Cu have median polluted value which may cause adverse effect to living creatures as well as human beings. Only Arsenic shows values highly dangerous, reflecting probably mostly influence of volcanic sediments from Neapolitan volcanoes (Vesuvius, Campi Flegri, Ischia Island) rather than anthropogenic source. Figure 3 s h ows the distribution pattern of selected analyzed elements. Most of heavy toxic metals have a similar distributio n. Ag, Hg and Pb aggregates close to Napoli metropolitan area, indicating that intense indus- trial, agricultural and commercial activities affect these elements distribution pattern. Arsenic is mostly concen- trated around Pozzuoli bay, where hydrothermal activity related to Campi Flegrei is documented as being very rich in As [2]. The distributions of Ni, Zn, and Cu indi- cate the water energy decrease from coastal to deep sea and cause finer sediment deposit off gulf. Distribution 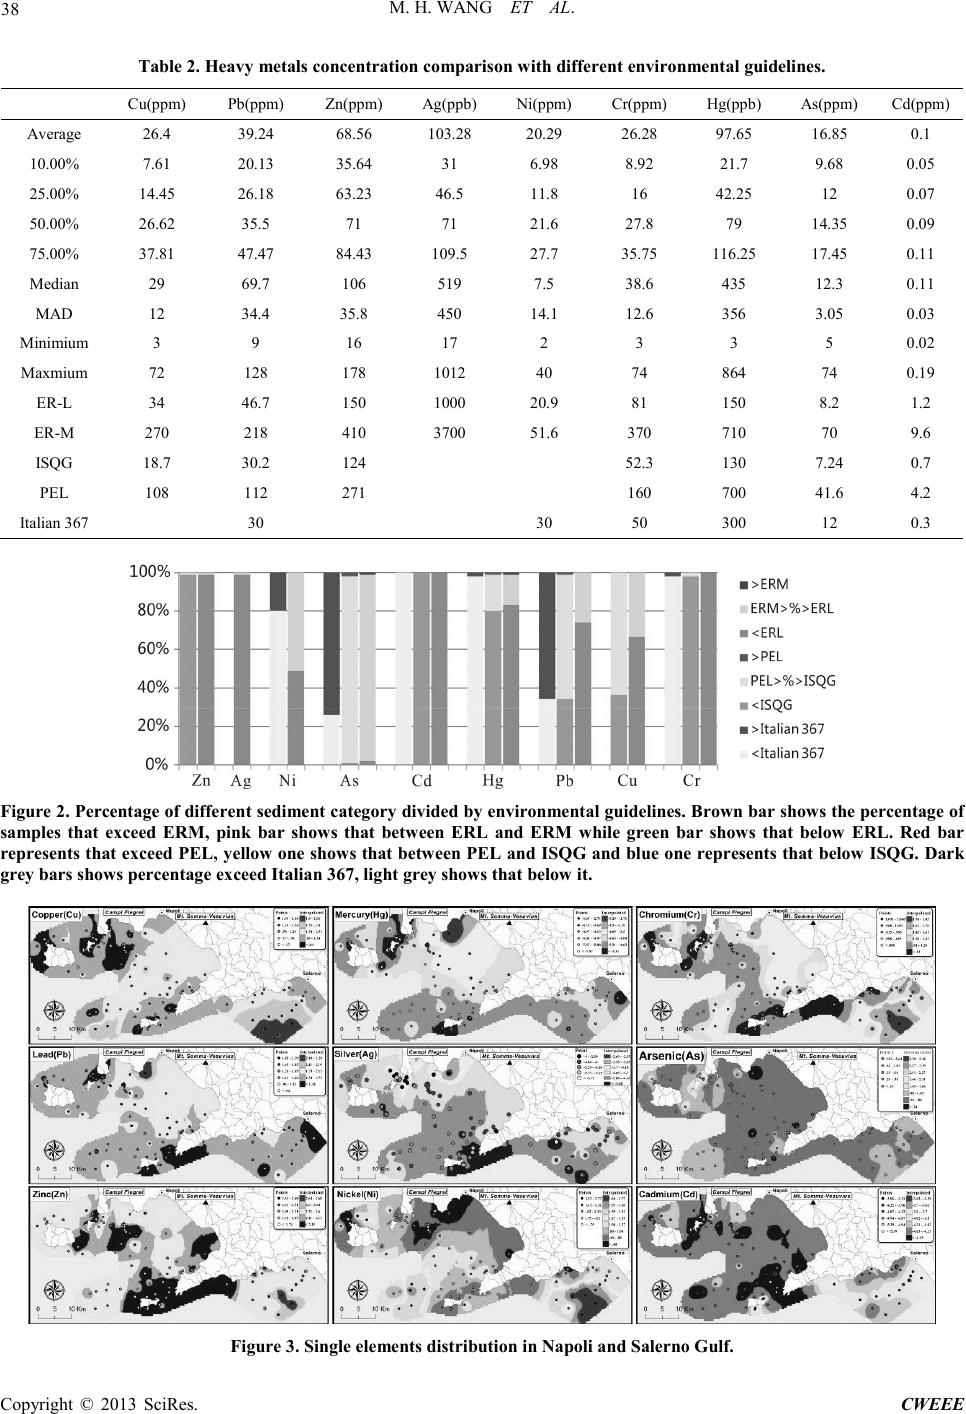 M. H. WANG ET AL. Copyright © 2013 SciRes. CWEEE 38 Table 2. Heavy metals concentration comparison with different environmental guideli ne s . Cu(ppm) Pb(ppm) Zn(ppm) Ag(ppb) Ni(ppm) Cr(p pm) Hg(ppb) As(ppm) Cd(ppm) Average 26.4 3 9.24 6 8.56 1 03.28 2 0.29 2 6.28 97. 65 16. 85 0.1 10.00 % 7.61 20.13 35.64 31 6.98 8.92 21.7 9.68 0.05 25.00 % 14. 45 26.18 63.23 46. 5 11.8 16 42.25 12 0.07 50.00 % 26. 62 35.5 71 71 21.6 27.8 79 14.35 0.09 75.00 % 37. 81 47.47 84.43 109.5 27.7 35.75 116 .25 17.45 0.11 Med ian 29 69.7 106 5 19 7.5 38. 6 435 12. 3 0.11 MAD 12 34.4 35.8 4 50 14. 1 12. 6 356 3.05 0.03 Mini mium 3 9 16 17 2 3 3 5 0.02 Maxm ium 72 128 178 1 012 40 74 864 74 0.19 ER-L 34 46.7 150 1000 2 0.9 81 150 8.2 1.2 ER-M 270 218 410 3700 5 1.6 370 710 70 9.6 ISQG 18. 7 30. 2 124 52.3 130 7.24 0.7 PEL 108 112 271 160 700 41.6 4.2 Italian 367 30 30 50 300 12 0.3 Figure 2. Percentage of different sediment category divided by environmental guidelines. Brown bar shows the per c entage of samples that exceed ERM, pink bar shows that between ERL and ERM while green bar shows that below ERL. Red bar represents that exceed PEL, yellow one shows that between PEL and ISQG and blue one represents that below ISQG. Dark grey bars shows percentage exceed Italian 367, light grey shows that below it. Figure 3. Single elements distribution in Napoli and Salerno Gulf. 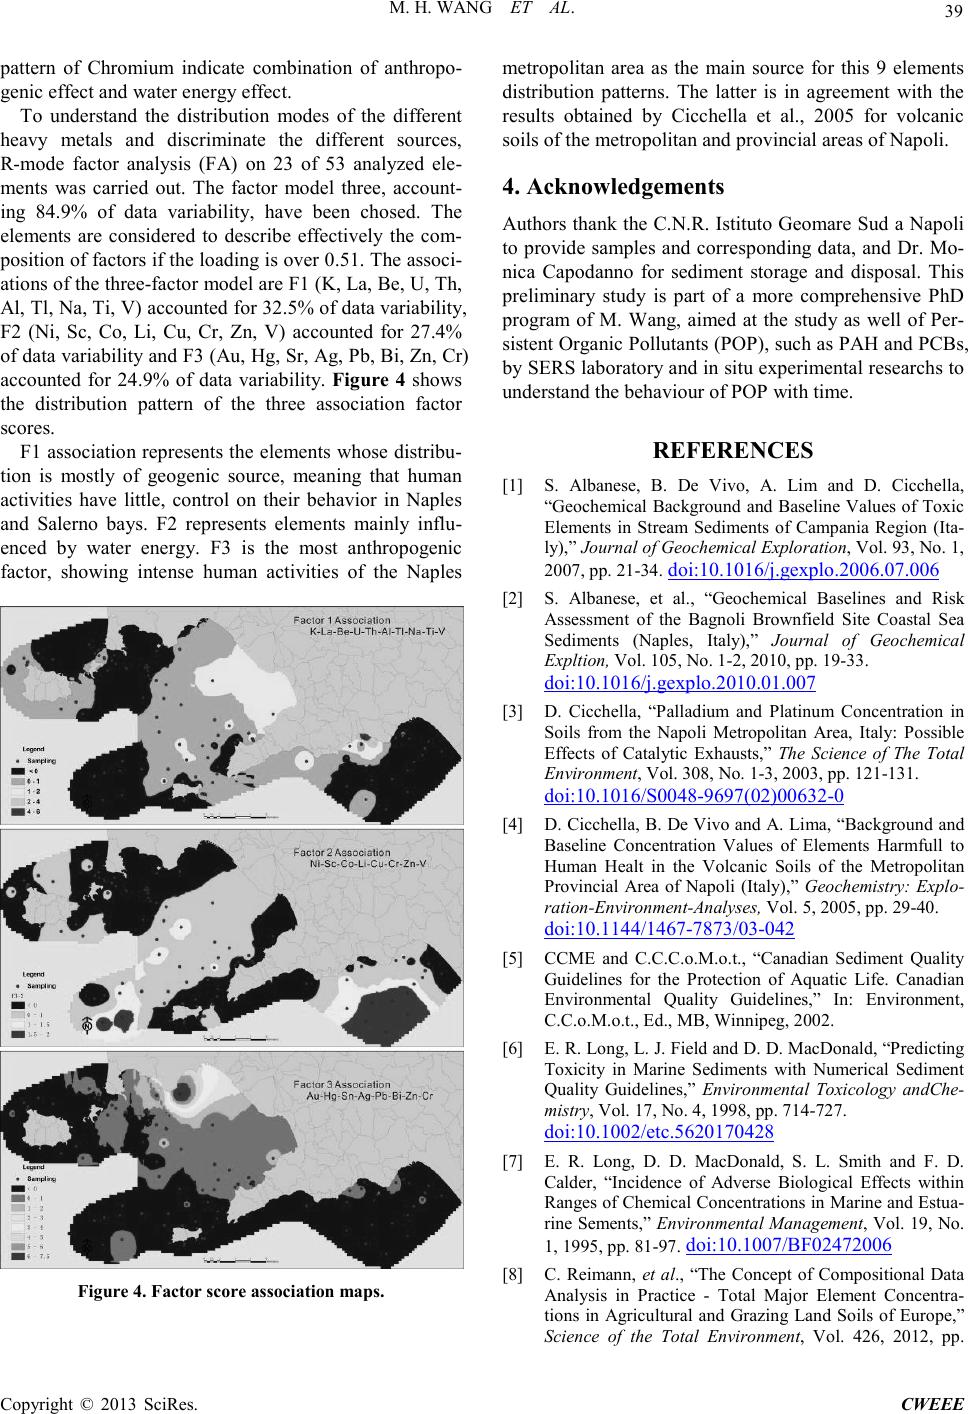 M. H. WANG ET AL. Copyright © 2013 SciRes. CWEEE 39 pattern of Chromium indicate combination of anthropo- genic effect and water energy effect. To understand the distribution modes of the different heavy metals and discriminate the different sources, R-mode factor analysis (FA) on 23 of 53 analyzed ele- ments was carried out. The factor model three, account- ing 84.9% of data variability, have been chosed. The elements are considered to describe effectively the com- position of factors if the loading is over 0.51. The associ- ations of the three-factor model are F1 (K, La, Be, U, Th, Al, Tl, Na, Ti, V) accounted for 32.5% of data variability, F2 (Ni, Sc, Co, Li, Cu, Cr, Zn, V) accounted for 27.4% of data variability and F3 (Au, Hg, Sr, Ag, Pb, Bi, Zn, Cr) accounted for 24.9% of data variability. Figure 4 shows the distribution pattern of the three association factor score s. F1 association represents the elements whose distribu- tion is mostly of geogenic source, meaning that human activities have little, control on their beha vio r in Naples and Salerno bays. F2 represents elements mainly influ- enced by water energy. F3 is the most anthropogenic factor, showing intense human activities of the Naples Figure 4. Factor score association maps. metropolitan area as the main source for this 9 elements distribution patterns. The latter is in agreement with the results obtained by Cicchella et al., 2005 for volcanic soils of the metropolitan and provincial areas of Napoli. 4. Acknowledgements Authors thank the C.N. R. Istituto Geomare Sud a Napoli to provide samples and corresponding data, and Dr. Mo- nica Capodanno for sediment storage and disposal. This preliminary study is part of a more comprehensive PhD program of M. Wang, aimed at the study as well of Per- sistent Organic Pollutants (POP), such as PAH and PCBs, by SERS laboratory and in situ experimental researchs to understand the behaviour of POP with time. REFERENCES [1] S. Albanese, B. De Vivo, A. Li m and D. Cicchella, “Geochemical Background and Baseline Values of Toxic Elements in Stream Sediments of Campania Region (Ita- ly),” Journal of Geochemical Exploration, Vol. 93, No. 1, 2007, pp. 21-34. doi:10.1016/j.gexplo.2006.07.006 [2] S. Albanese, et al., “Geochemical Baselines and Risk Assessment of the Bagnoli Brownfield Site Coastal Sea Sediments (Naples, Italy),” Journal of Geochemical Expltion, Vol. 105, No. 1-2, 2010, pp. 19-33. doi:10.1016/j.gexplo.2010.01.007 [3] D. Ci cchella, “Palladium and Platinum Concentration in Soils from the Napoli Metropolitan Area, Italy: Possible Effects of Catalytic Exhausts,” The Science of The Total Environment, Vol. 308, No. 1-3, 2003, pp. 121-131. doi:10.1016/S0048-9697(02)00632-0 [4] D. Cicch ella, B. De Vivo and A. Lima, “Background and Baseline Concentration Values of Elements Harmfull to Human Healt in the Volcanic Soils of the Metropolitan Provincial Area of Napoli (Italy),” Geochemistry: Explo- ration-Environment-Analyses, Vol. 5, 2005, pp. 29-40. doi:10.1144/1467-7873/03-042 [5] CCME and C.C.C.o.M.o.t., “Canadian Sediment Quality Guidelines for the Protection of Aquatic Life. Canadian Environmental Quality Guidelines,” In: Environment, C.C.o.M.o.t., Ed., MB, Winnipeg, 2002. [6] E. R. Long, L. J. Field and D. D. MacDonald, “Predicting Toxicity in Marine Sediments with Numerical Sediment Quality Guidelines,” Environmental Toxicology andChe- mistry, Vol. 17, No. 4, 1998, pp. 714-727. doi:10.1002/etc.5620170428 [7] E. R. Long, D. D. MacDonald, S. L. Smith and F. D. Calder, “Incidence of Adverse Biological Effects within Ranges of Chemical Concentrations in Marine and Estua- rine Seme nts,” Environmental Management, Vol. 19, No. 1, 1995, pp. 81-97. doi:10.1007/BF02472006 [8] C. Reimann, et al., “The Concept of Compositional Data Analysis in Practice - Total Major Element Concentra- tions in Agricultural and Grazing Land Soils of Europe,” Science of the Total Environment, Vol. 426, 2012, pp.  M. H. WANG ET AL. Copyright © 2013 SciRes. CWEEE 40 196-210. doi:10.1016/j.scitotenv.2012.02.032 [9] M. Sprovieri, et al., “Heavy metals, Polycyclic Aromatic Hydrocarbons and Polychlorinated Biphenyls in Surface Sediments of the Naples Harbour (Southern Italy). Che- mosphere,” Vol. 67, No. 5, 2007, pp. 998-1009. doi:10.1016/j.chemosphere.2006.10.055 |