

Paper Menu >>
Journal Menu >>
 Computational Water, Energy, and Environmental Engineering, 2013, 2, 26-35 doi:10.4236/cweee.2013.22B005 Published Online April 2013 (http://www.scirp.org/journal/cweee) Copyright © 2013 SciRes. CWEEE Are there Monthly Variations in Water Quality in the Amman, Zarqa and Balqa R egions, Jordan? Khaled A. Alqadi*, Lalit Kumar Ecosystem Management, School of En vi ronment al and Rur al Science, Faculty of Arts and Sciences, University of New England, Armidale, NSW 2351, Australia Email: *[email protected] Received 2013 ABSTRACT This study investigated the monthly variation of water quality in the Amman-Zarqa and Balqa regions in Jordan in terms of pH, ammonium, nitrate and conductivity. During 2004 there was no monthly variation in water quality for most of the tested parameters. All readings were above the accepted range except for pH, indicating that land use does have an impact on water quality irrespective of urban, industrial or agricultural usage. The water quality remained for the most part below the maximum levels for drinking standards in Jordan, but these standards are often below the WHO recommendations. The pH was found to fluctuate through the year. Nitrate levels were highly seasonal in irrigated lands but remained stable over basin covered by other land uses. Ammonium levels were high in areas of urbanisation and intensive animal husbandry as a consequence of effluent infiltration, peaking during the wet season due to increased infiltration. These results indicate that, over an annual cycle, the variation in water quality remains constant; however the continued dra wdo wn of th e a quifer system will inevitabl y lead to dete r ioration in the parameters investigated. Keywords: Water Quality; pH; Ammonium; Conduct ivity; Nitrate 1. Introduction The water crisis in Jordan is a major geopolitical issue that threatens the future and stability of the whole coun- try. The Amman, Zarqa and Balqa regions supply irriga- tion water to an estimated 33,000 Ha, however, most of demand is for do mestic and industrial water with the ba- sin supplying over half of the population of Jordan with water [3]. Agricultural production in the basin is domi- nated by grazing, with only limited olive and fruit trees and the production of cereals near areas of permanent water. Ground water quality has a major impact on human welfare and affects all human activity [7]. Understanding changes in ground water quality allows for effective management of water resources in the face of increasing pressures from urbanization, agricultural and industrial development [15]. However, Jordan is faced with a lack of funding to maintain monitoring which has resulted in fragmented data sets [13]. The utilisation of aquifers has led to severe lowering of the ground water table and this has changed the ground water chemistry [10]. The Am- man, Zarqa and Balqa regions is renewable and draws water from areas of urban and industrial development and landfill sites and therefore is at significant risk of waste water infiltration pollution [1]. Data from 2002 indicates that there was an unsustain- able drawdown of ground water from the Amman-Zarqa Basin. In 2002 a total of 84 mcm year-1 was withdrawn from the aquifer for municipal supply, while 54 mcm year-1 was taken to supply the agricultural sector. This represents an excess of 72 mcm year-1 of water above the estimated safe yield of 65 mcm year-1. This overdrawing from the 772 officiall y register ed wells has led to a fall in the ground water table and declines in water quality [13]. Salameh [19] argued that the current drawdown of the aquifers has led to permanent damage of the hydrological system, and Al-Mahamid [4] argued that at current ex- traction rates areas in the middle of the basin will be completely dry in the next few decades. These findings were supported by Dottrige and Jaber [8] who argued that at current levels of extraction many of the aquifers dependent upon for urban and industrial supply will be dry by the middle of the t wenty first century. The aim of this paper is to examine the water quality over an annual cycle in the Amman, Zarqa and Balqa regions under dif- fering land use. 2. Hydrogeology of the Amman-Zarqa Basin The geology of the Amman-Zarqa Basin is primarily *Corresponding author. 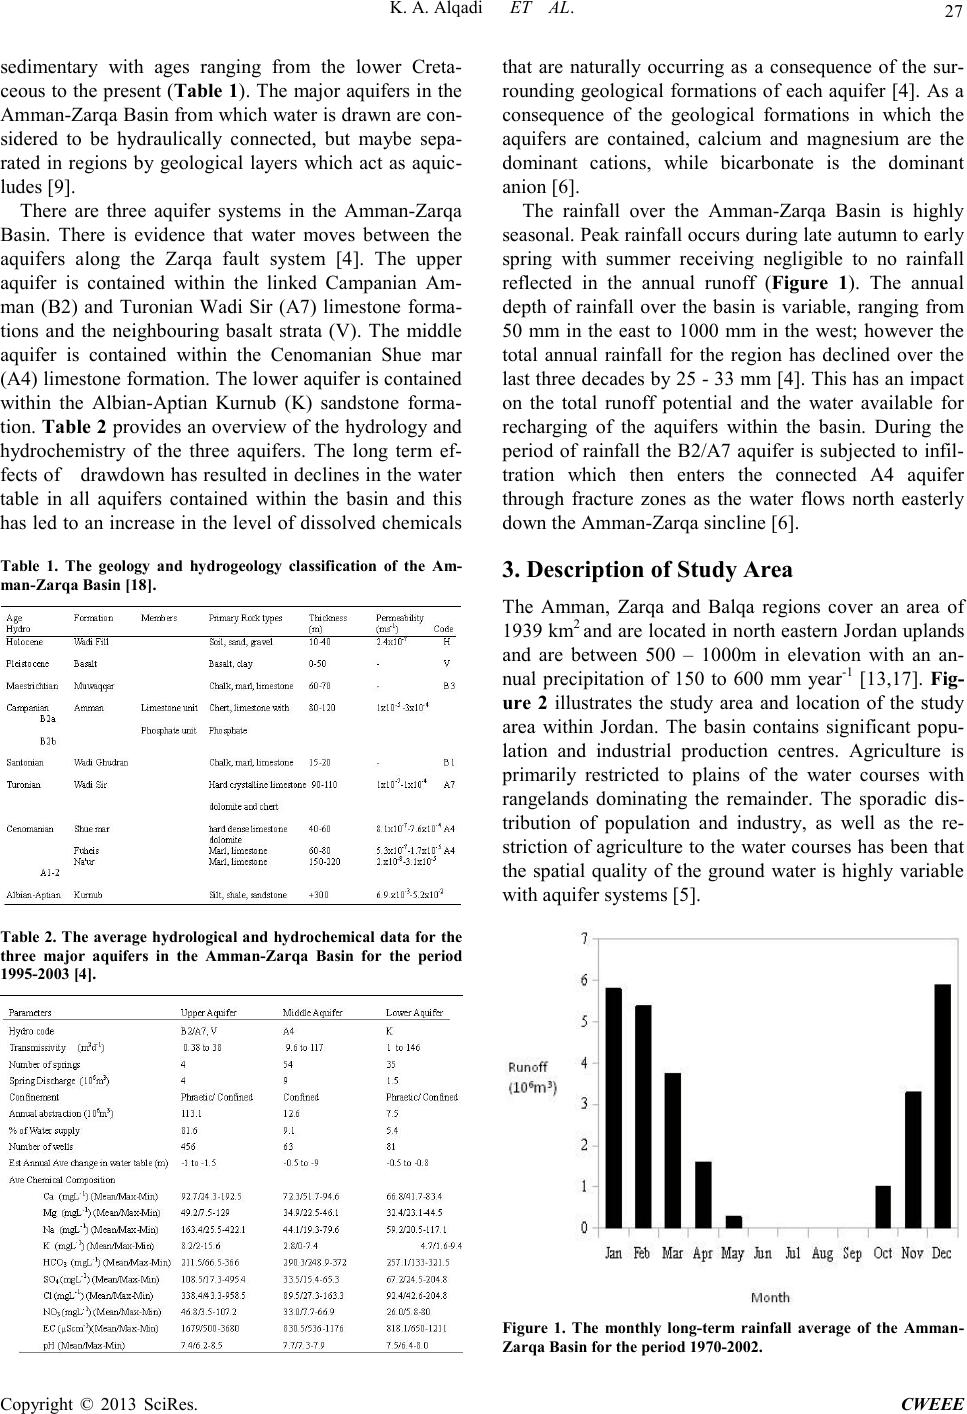 K. A. Al q a d i ET AL. Copyright © 2013 SciRes. CWEEE 27 sedimentary with ages ranging from the lower Creta- ceous to the present (Table 1 ). The major aquifers i n the Amma n-Zarqa Basin from which water is drawn are con- sidered to be hydraulically connected, but maybe sepa- rated in regions by geological layers which act as aquic- ludes [9]. There are three aquifer systems in the Amman-Zarqa Basin. There is evidence that water moves between the aquifers along the Zarqa fault system [4]. The upper aquifer is contained within the linked Campanian Am- man (B2) and Turonian Wadi Sir (A7) limestone forma- tions and the neighbouring basalt strata (V). The middle aquifer is contained within the Cenomanian Shue mar (A4) limestone formation. T he lo wer aquifer is contained within the Albian-Aptian Kurnub (K) sandstone forma- tion. Ta ble 2 provides an overview of the hydrology and hydrochemistry of the three aquifers. The long term ef- fects of drawdown has resulted in declines in the water table in all aquifers contained within the basin and this has led to an increase in the level of dissolved chemicals Table 1. The geology and hydrogeology classification of the Am- man-Zarqa B as in [18]. Table 2. The average hydrological and hydrochemical data for the three major aquifers in the Amman-Zarqa Basin for the period 1995-2003 [4]. that are naturally occurring as a consequence of the sur- rounding geological formations of each aquifer [4]. As a consequence of the geological formations in which the aquifers are contained, calcium and magnesium are the dominant cations, while bicarbonate is the dominant anion [6]. The rainfall over the Amman-Zarqa Basin is highly seasonal. Peak rainfall occurs during late autumn to earl y spring with summer receiving negligible to no rainfall reflected in the annual runoff (Figure 1). The annual depth of rainfall over the basin is variable, ranging from 50 mm in the east to 1000 mm in the west; however the total annual rainfall for the region has declined over the last three decades by 25 - 33 mm [4]. This has an impact on the total runoff potential and the water available for recharging of the aquifers within the basin. During the period of rainfall the B2/A7 aquifer is subjected to infil- tration which then enters the connected A4 aquifer through fracture zones as the water flows north easterly down the Amman-Zarqa sincline [6]. 3. Description of Study Area The Amman, Zarqa and Balqa regions cover an area of 1939 km2 and are located in north eastern Jordan uplands and are between 500 ‒ 1000m in elevation with an an- nual precipitation of 150 to 600 mm year-1 [13,17]. Fig- ure 2 illustrates the study area and location of the study area within Jordan. The basin contains significant popu- lation and industrial production centres. Agriculture is primarily restricted to plains of the water courses with rangelands dominating the remainder. The sporadic dis- tribution of population and industry, as well as the re- striction of agriculture to the water courses has been that the spatial quality of the ground water is highly variable with aquifer systems [5]. Figure 1. The monthly long-term rainfall average of the Amman- Zarqa Basin for the period 1970-2002. 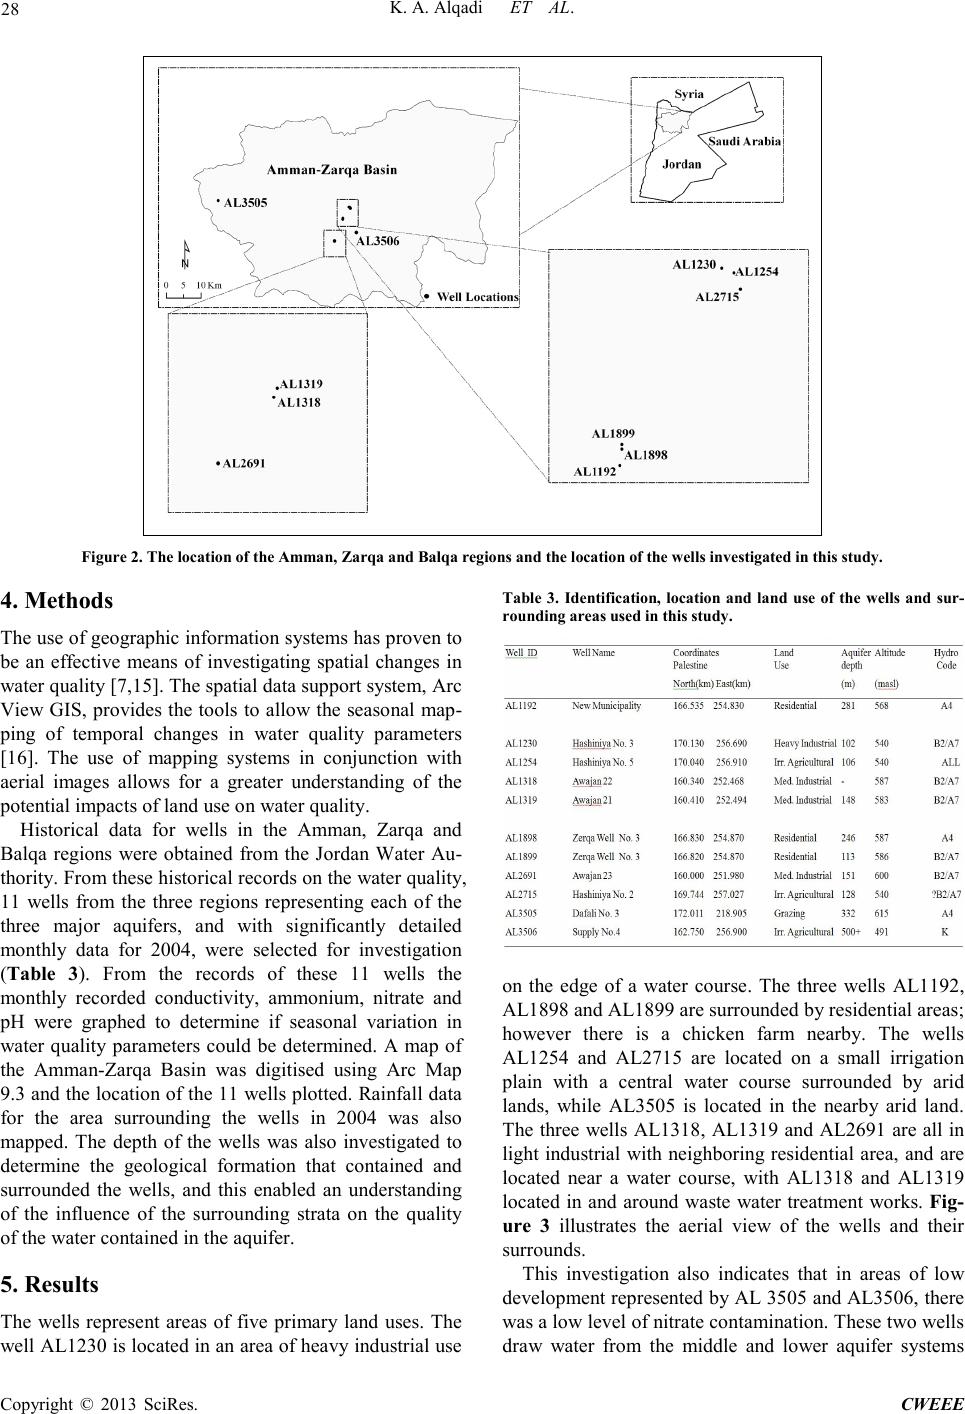 K. A. Al q a d i ET AL. Copyright © 2013 SciRes. CWEEE 28 Figure 2. The location of the Amman, Zarqa and Balqa regions and the location of the wells investigated in this study. 4. Method s The use of ge ogr aphic info r matio n syste ms ha s p rove n to be an effective means of investigating spatial changes in water quality [7,15]. The spatial data support system, Arc View GIS, provides the tools to allo w the seasonal map- ping of temporal changes in water quality parameters [16]. The use of mapping systems in conjunction with aerial images allows for a greater understanding of the potential i mpacts of land use on water quality. Historical data for wells in the Amman, Zarqa and Balqa regions were obtained from the Jordan Water Au- thority. Fro m these historic al reco rd s on the water qualit y, 11 wells from the three regions representing each of the three major aquifers, and with significantly detailed monthly data for 2004, were selected for investigation (Table 3). From the records of these 11 wells the monthly recorded conductivity, ammonium, nitrate and pH were graphed to determine if seasonal variation in water quality parameters could be determined. A map of the Amman-Zarqa Basin was digitised using Arc Map 9.3 and the location of the 11 wells plotted. Rainfall data for the area surrounding the wells in 2004 was also mapped. The depth of the wells was also investigated to determine the geological formation that contained and surrounded the wells, and this enabled an understanding of the influence of the surrounding strata on the quality of the water contained in t he a quifer. 5. Resul ts The wells represent areas of five primary land uses. The well AL1230 is located in an area of heavy industrial use Table 3. Identification, location and land use of the wells and sur- rounding area s used in thi s study. on the edge of a water course. The three wells AL1192, AL1898 and AL1899 are surrounded by residential areas; however there is a chicken farm nearby. The wells AL1254 and AL2715 are located on a small irrigation plain with a central water course surrounded by arid lands, while AL3505 is located in the nearby arid land. The three wells AL1318, AL1319 and AL2691 are all in light industrial with neighboring residential area, and are located near a water course, with AL1318 and AL1319 located in and around waste water treatment works. Fig- ure 3 illustrates the aerial view of the wells and their surrounds. This investigation also indicates that in areas of low development represented by AL 3505 and AL3506, there was a low level of nitrate contamination. These two wells draw water from the middle and lower aquifer systems 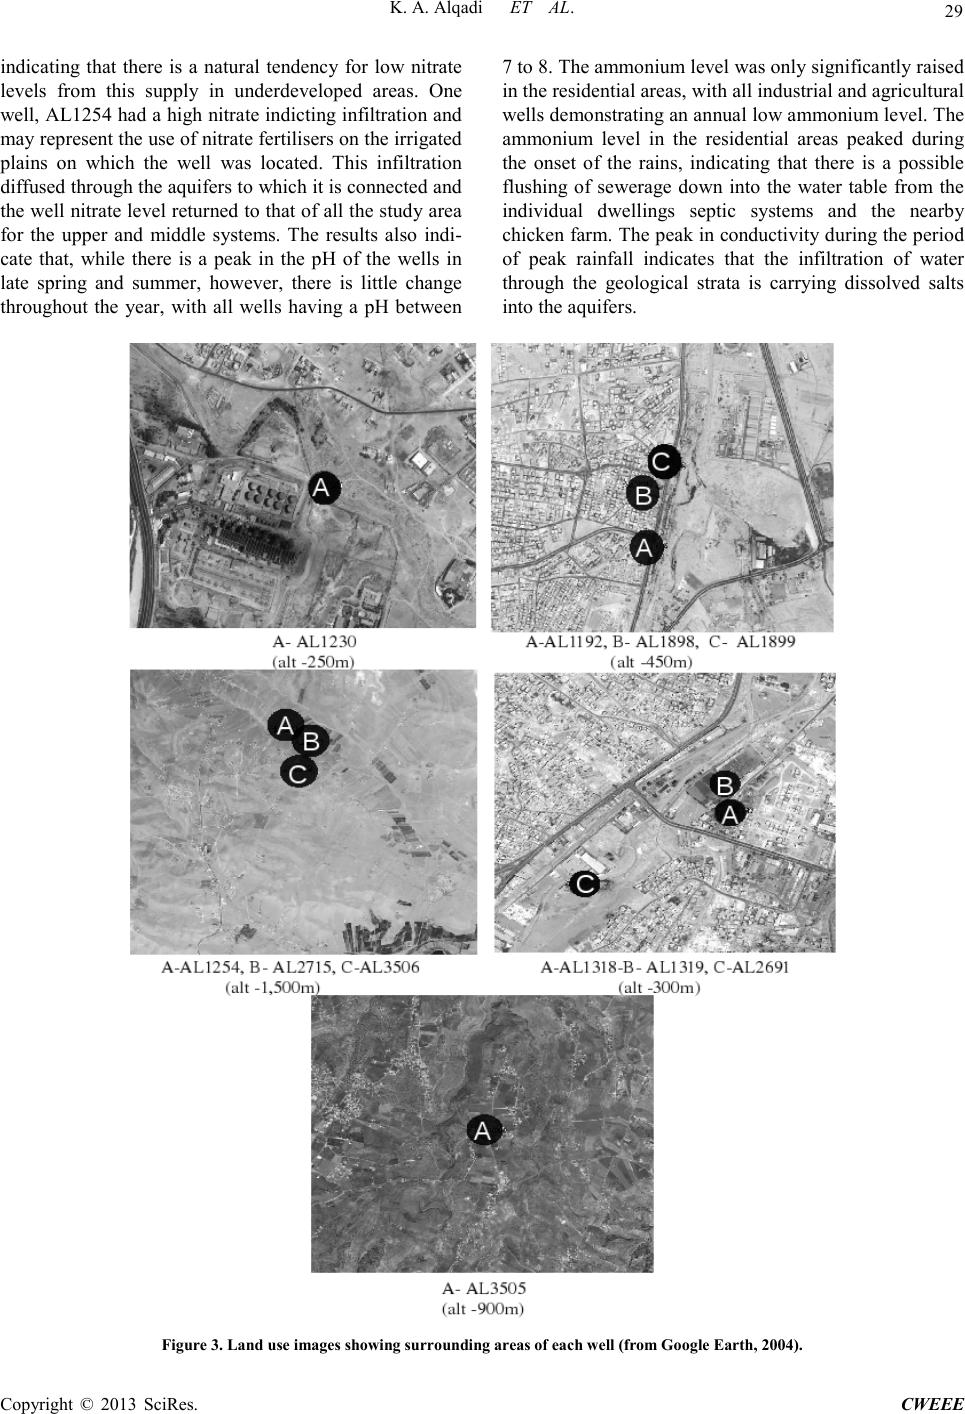 K. A. Al q a d i ET AL. Copyright © 2013 SciRes. CWEEE 29 indicating that there is a natural tendency for low nitrate levels from this supply in underdeveloped areas. One well, AL125 4 had a high nitra te indicting in filtration and may represent the use of nitrate fertilisers on the irrigated plains on which the well was located. This infiltration diffus ed thr oug h the aq ui fers to which it is connected and the well nitrate le vel returned to that of all the study ar ea for the upper and middle systems. The results also indi- cate that, while there is a peak in the pH of the wells in late spring and summer, however, there is little change throughout the year, with all wells having a pH between 7 to 8. The ammonium level was only significa ntly raise d in the residen tia l a reas, wit h all industrial and agricultural wells demo nstr at i n g an an nua l l o w am mo ni u m le ve l. T he ammonium level in the residential areas peaked during the onset of the rains, indicating that there is a possible flushing of sewerage down into the water table from the individual dwellings septic systems and the nearby chicke n far m. The peak in cond uctivi ty dur ing the p eriod of peak rainfall indicates that the infiltration of water through the geological strata is carrying dissolved salts into the aquifers. Figure 3. Land use images showing surrounding areas of each well (from Google Earth, 2004). 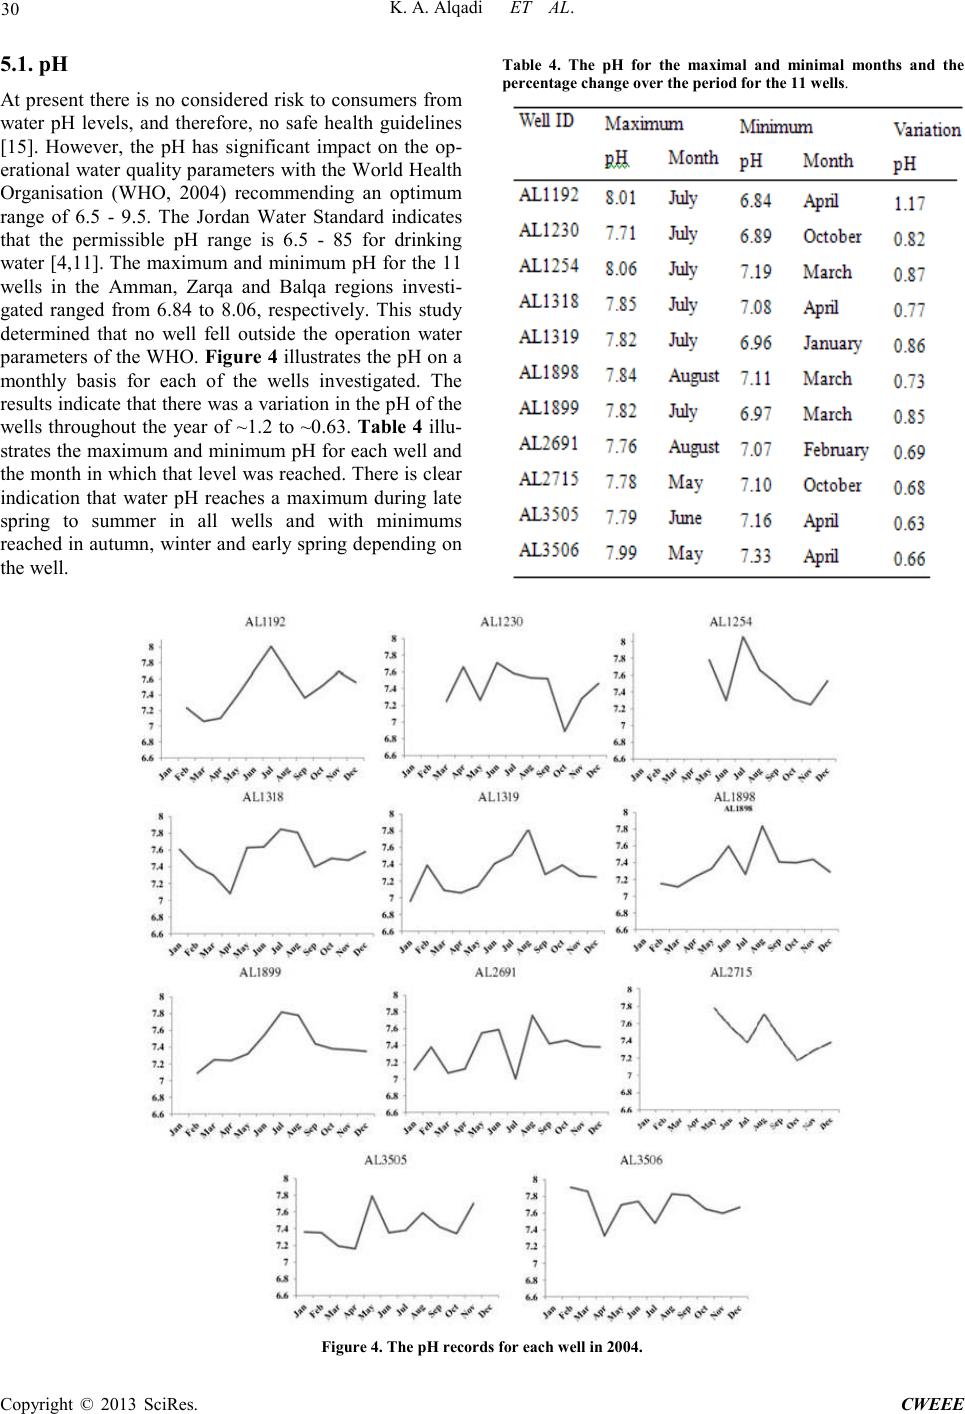 K. A. Al q a d i ET AL. Copyright © 2013 SciRes. CWEEE 30 5.1. pH At present there is no considered risk to consumers from water pH levels, and therefore, no safe health guidelines [15]. However, the pH has significant impact on the op- erational water q uality parameters with the Wo rld Health Organisation (WHO, 2004) recommending an optimum range of 6.5 - 9.5. The Jordan Water Standard indicates that the permissible pH range is 6.5 - 85 for drinking water [4,11]. The maximum and minimum pH for the 11 wells in the Amman, Zarqa and Balqa regions investi- gated ranged from 6.84 to 8.06, respectively. This study determined that no well fell outside the operation water parameters of the WHO. Figure 4 illustrate s the pH on a monthly basis for each of the wells investigated. The results indicate that there was a variation in t he p H of t he wells throughout the year of ~1.2 to ~0.63. Table 4 illu- strates the maximum and minimum pH for each well and the month in which that level was reached. There is clear indication that water pH reaches a maximum during late spring to summer in all wells and with minimums reached in autumn, winter and early spring depending on the well. Table 4. The pH for the maximal and minimal months and the percentage change over the period for the 11 wells. Figure 4. The pH records fo r ea ch well in 2004. 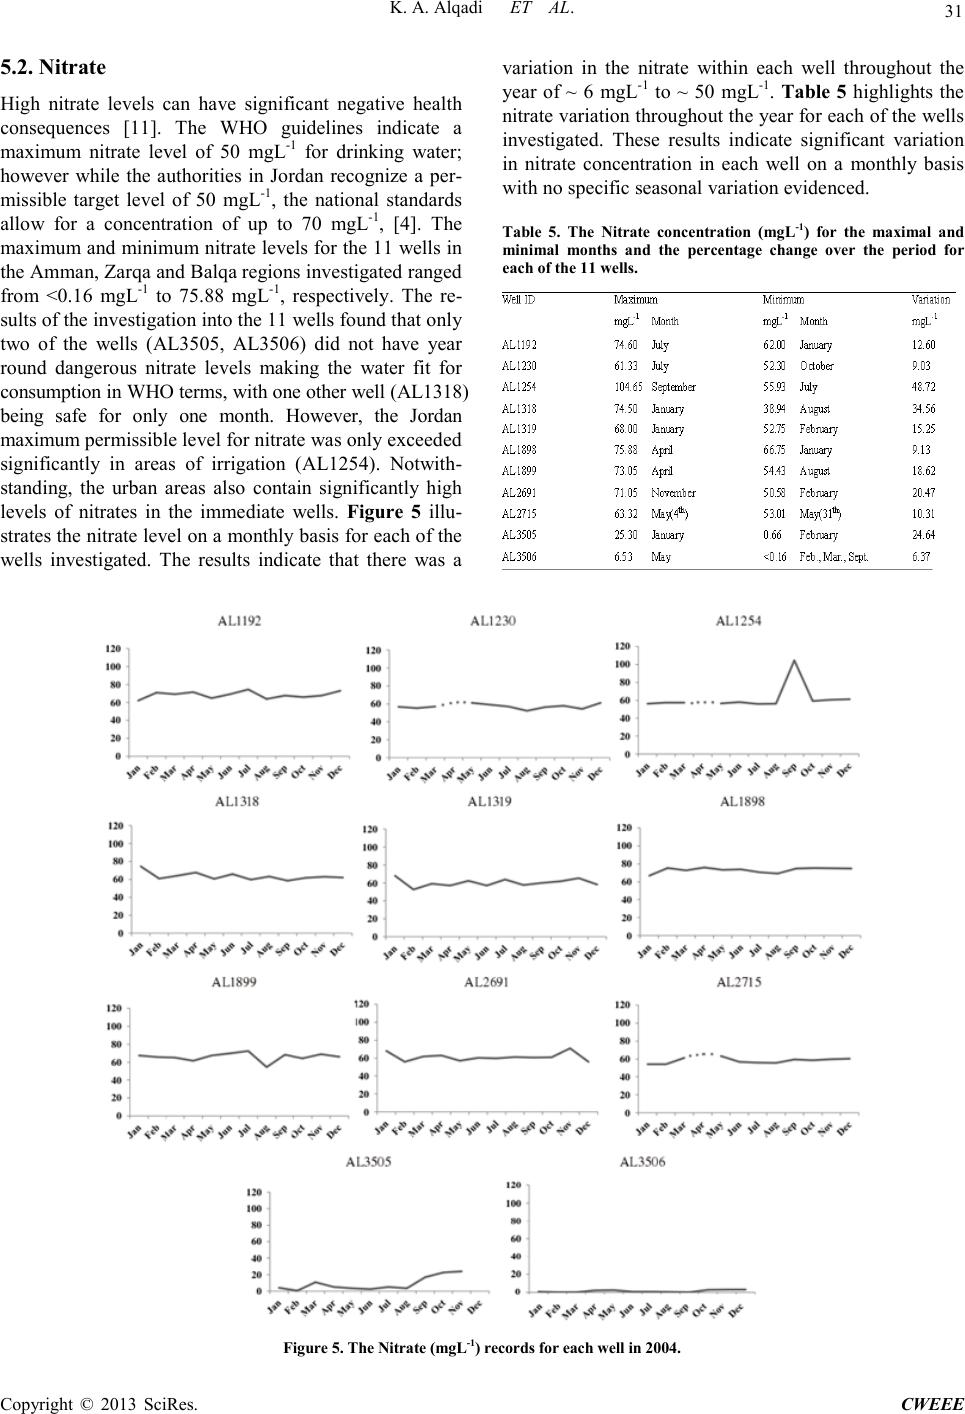 K. A. Al q a d i ET AL. Copyright © 2013 SciRes. CWEEE 31 5.2. Nitr at e High nitrate levels can have significant negative health consequences [11]. The WHO guidelines indicate a maximum nitrate level of 50 mgL-1 for drinking water; however while the authorities in Jordan recognize a per- missible target level of 50 mgL-1, the national standards allow for a concentration of up to 70 mgL-1, [4]. The maximum and minimu m nitrate levels for the 11 wells in the Am ma n, Zar q a a nd B a lq a regio ns inve st i gat ed r ange d from <0.16 mgL-1 to 75.88 mgL-1, respectively. The re- sults of the investi gation int o t he 11 wells found that o nly two of the wells (AL3505, AL3506) did not have year round dangerous nitrate levels making the water fit for consumption in WHO terms, with one other well (AL1318) being safe for only one month. However, the Jordan maximum permissible level for nitrate was only exceeded significantly in areas of irrigation (AL1254). Notwith- standing, the urban areas also contain significantly high levels of nitrates in the immediate wells. Figure 5 illu- strates the nitra te le vel on a monthl y ba sis for e ach o f the wells investigated. The results indicate that there was a variation in the nitrate within each well throughout the year of ~ 6 mgL-1 to ~ 50 mgL-1. Table 5 highlights the nitra te varia tion t hro ugho ut t h e year for each of the wells investigated. These results indicate significant variation in nitrate concentration in each well on a monthly basis with no specific seasonal variation evidenced. Table 5. The Nitrate concentration (mgL-1) for the maximal and minimal months and the percentage change over the period for each of the 11 wells. Figure 5. The Nitrate (mgL-1) records for each well in 200 4. 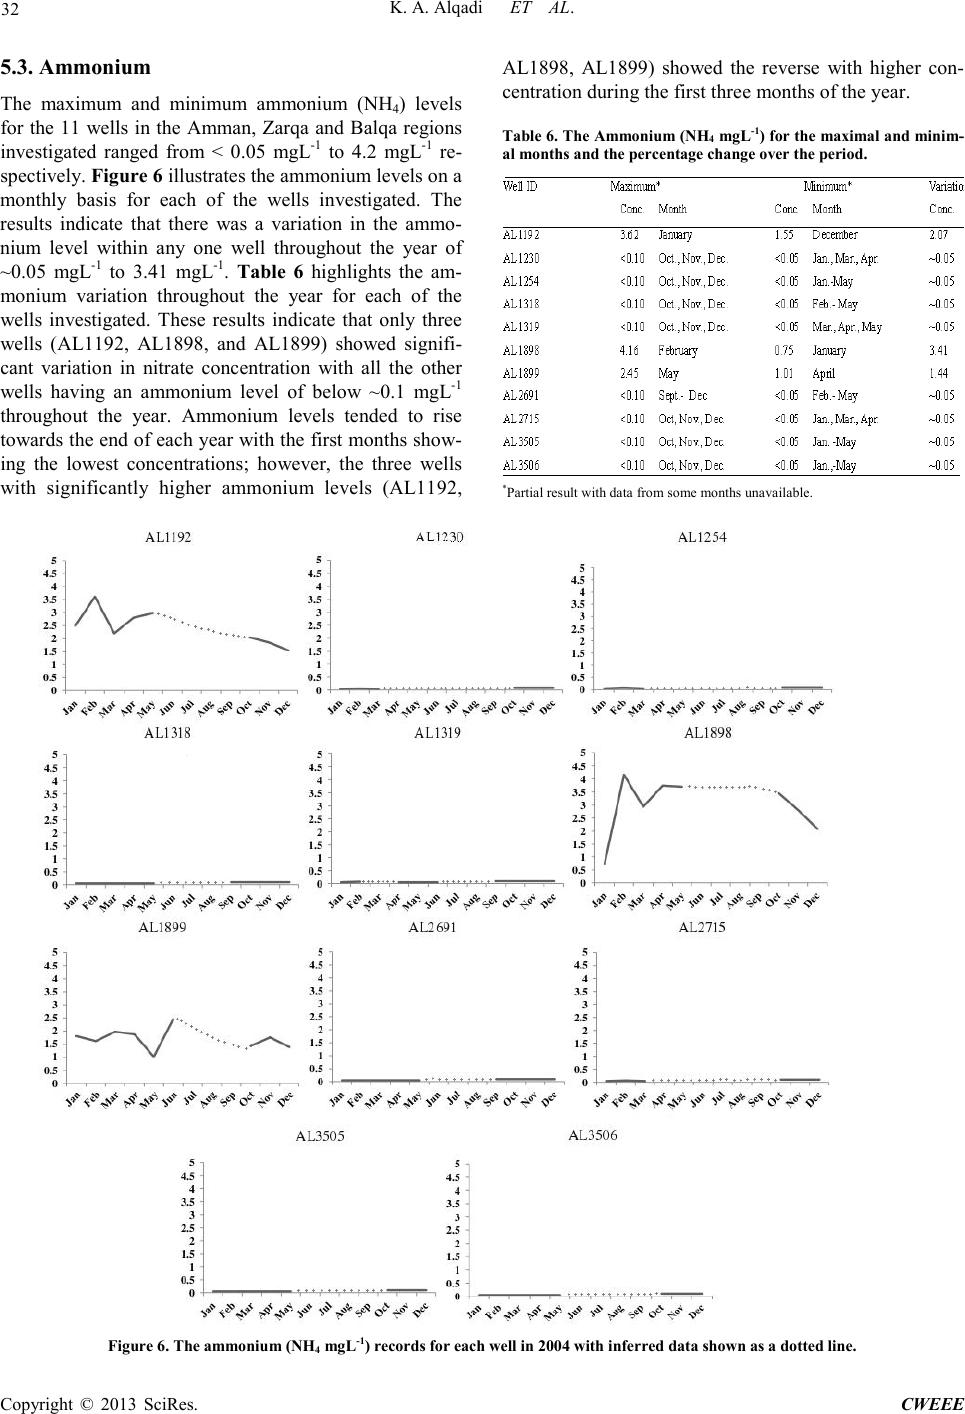 K. A. Al q a d i ET AL. Copyright © 2013 SciRes. CWEEE 32 5.3. Ammonium The maximum and minimum ammonium (NH4) levels for the 11 wells in the Amman, Zarqa and Balqa regions investigated ranged from < 0.05 mgL-1 to 4.2 mgL-1 re- spectively. Figure 6 illustrates the ammonium levels on a monthly basis for each of the wells investigated. The results indicate that there was a variation in the ammo- nium level within any one well throughout the year of ~0.05 mgL-1 to 3.41 mgL-1. Table 6 highlights the am- monium variation throughout the year for each of the wells investigated. These results indicate that only three wells (AL1192, AL1898, and AL1899) showed signifi- cant variation in nitrate concentration with all the other wells having an ammonium level of below ~0.1 mgL-1 throughout the year. Ammonium levels tended to rise towards the end of each year with the first months show- ing the lowest concentrations; however, the three wells with significantly higher ammonium levels (AL1192, AL1898, AL1899) showed the reverse with higher con- centration during the firs t three months of the year. Table 6. The Ammonium (NH4 mgL-1) f or t he ma x i ma l a nd mi n im- al months and the percentage cha nge over the period. *Pa r tial re sult with data f rom s ome months unavailable. Figu re 6. The amm o n ium (NH 4 mgL-1) records for each well in 2004 with infer red data show n as a dotted line. 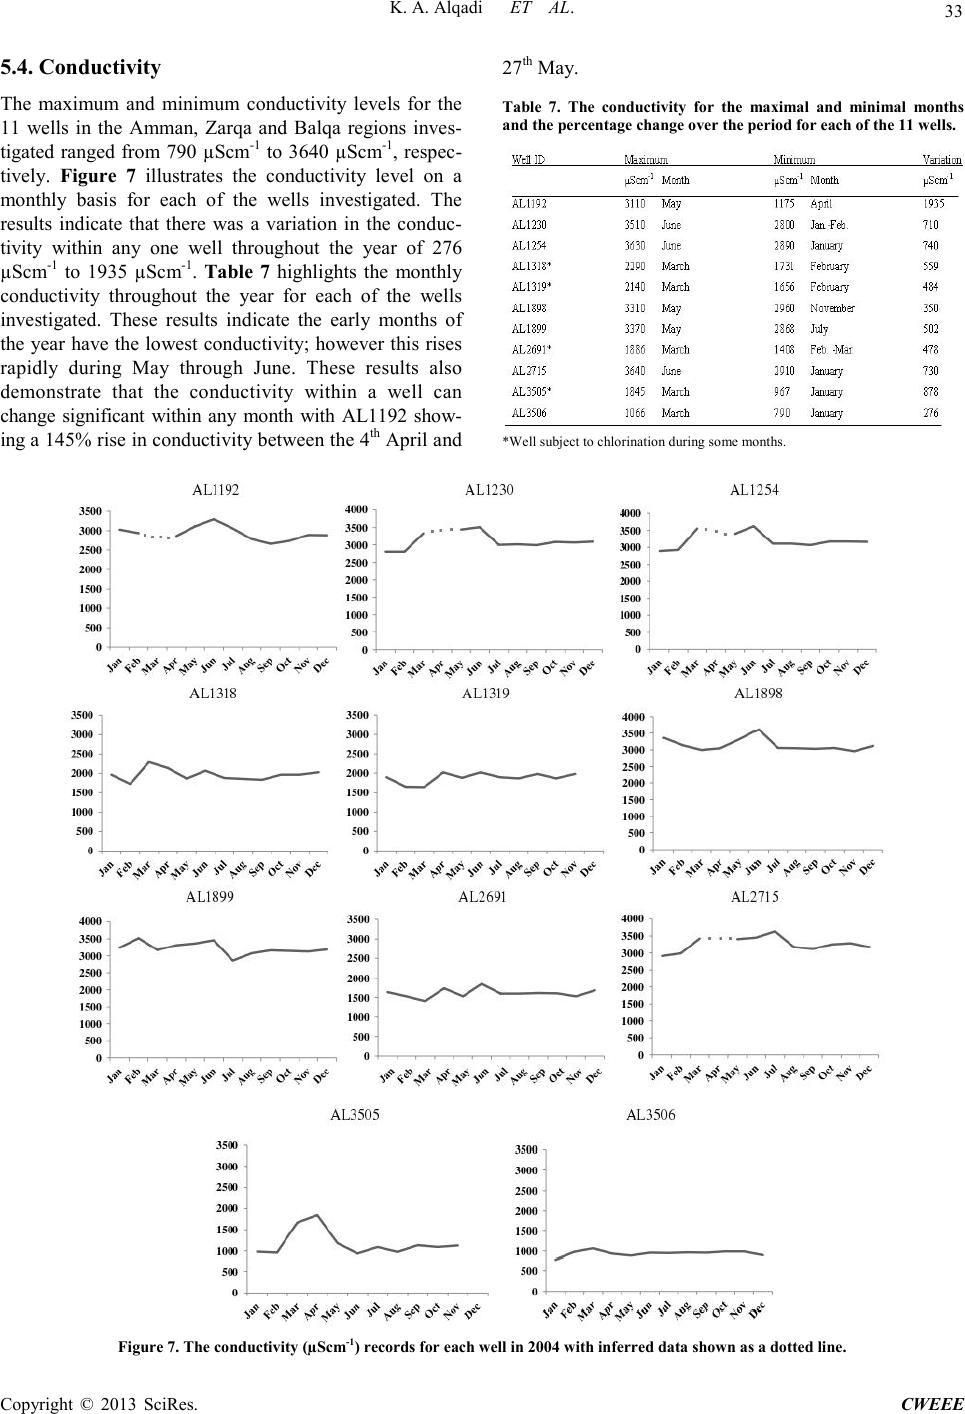 K. A. Al q a d i ET AL. Copyright © 2013 SciRes. CWEEE 33 5.4. Conductivity The maximum and minimum conductivity levels for the 11 wells in the Amman, Zarqa and Balqa regions inves- tigated ranged from 790 µScm-1 to 3640 µScm-1, respec- tively. Figure 7 illustrates the conductivity level on a monthly basis for each of the wells investigated. The results indicate that there was a variation in the conduc- tivity within any one well throughout the year of 276 µScm-1 to 1935 µScm-1. Table 7 highlights the monthly conductivity throughout the year for each of the wells investigated. These results indicate the early months of the year have the lowest conductivity; however this rises rapidly during May through June. These results also demonstrate that the conductivity within a well can change significant within any month with AL1192 show- ing a 145% rise in conductivity between the 4th April and 27th May. Table 7. The conductivity for the maximal and minimal months and the perc en t a ge chan g e ov er th e p eri od f or each o f the 1 1 wells. *Wel l subject to chlorination during some mo nths. Figure 7. The conductivity (µScm-1) reco rd s fo r ea ch we ll in 2004 with inferred data shown as a dotted line.  K. A. Al q a d i ET AL. Copyright © 2013 SciRes. CWEEE 34 6. Discussion This study confirmed waste effluent can have a signifi- cant negative impact on the water quality of the aquifers in the basin. Ho wever, thi s study indicates that the prob- lem may come from urban areas with low sanitation in- frastructure. Also, areas under irrigation can have a marked, localised and temporary effect on water quality. Infil tra tion i s ar eas o f u nder deve lop me nt have sig ni fica nt increase in the conductivity, particularly as the first flush from the rains moves through the profile. Notwithstanding all aquifers were determined to comply with the guide- lines for maximum permissible standards for drinking water, except for the A2/B7 aquifer from which water is dra wn has regions of conductivity which is outside these standards. It must be noted that the maximum permissi- ble level for most water contaminants in Jordan often exceed the WHO recommendations [4]. During this study the pH of all wells remained within the permissible standards of the Jordanian water authori- ty [4]. This study concluded that irrigation can have a significant impact on the nitrate level of the aquifer with nitrate levels shown to significantly exceed the maximal permissible levels [4]. Areas of high urban density also had higher nitrate levels which seasonally peaked at or just above the Jordan Governmental standards for the maximum permissible level, while lands which are grazed have the lo west nitrates [4]. The high ammoniu m content of AL1192, AL1898, and AL1899 is postulated to come fro m infiltration o f the efflue nt from the c hicken farm, indicating that ammonium contamination is highly dependent on land use. The conductivity was found to be lo wes t in the ra ngela nds wit h irri gated, urban, and ind us- tria l lands s howi ng the highe st re adings. T his re flect s the level of water use in each of these areas, indicating that drawdown has a negative impact on the conductivity of the water. This study confirms the results obtained in neighboring aquifer systems in Jordan that indicate that urbanizatio n and industrializat ion, coup led with intensive agriculture, have a negative impact on water quality when compared to natural rangeland systems [2,10]. Many of the aquifer systems in Jordan are under threat from overexploitation and this unsustainable drawdown will lead to many systems becoming dry by 2030 to 2040 [8].There is a need for increased monitoring throughout the Amman, Zarqa and Balqa regions over a long term in order to capture a more reliable image of the declines in water quality and regulate the water extraction or face the loss of the aquifer system [4,13,18]. 7. Conclusions The aquifers within the Amman, Zarqa and Balqa regions are affected by irrigation, industrialisation and urbansia- tion. The increased drawdown of the aquifers has led to declines in the water quality o ve r t he lo ng ter m. T he mon- thly variations in water quality parameters are signifcantly affected by the rainfall which leads to infiltration of water that carries pollutants from anthropogenic sources and dissolved salts from the geological strata that the water moves through. The drawdown of the aqufers has led to a concentration of salts and other contaminants that would have previously been dispersed in a historical larger water volume. REFERENCES [1] M. Al-Farajat, I. Hamdan, K. Jaber, and S. H. Mo- hammed, “GIS Mapping of Ground Water Vulnerability against Pollution in Amman Using DRASTIC dex, ”Hydrogeologie und Umwelt, Vol. 33, No. 9, 2005, pp. 1-19. [2] A. Al-Hanbali and A. Kondoh, “Ground Water Vulnera- bility Assessment and Evaluation of Human Activity Im- pact (HAI) within the Dead Sea Groundwater Basin, Jor- dan,” Hydrogeology Journal, Vol. 16, 2008, pp. 499-510. doi:10.1007/s10040-008-0280-7 [3] E. K. Al-Karablieh, A. S. Jabarin and M. A. Tabieh, “Jordan Horticultural Export Competit iveness fro m Water Perspective,” Journal of Agricultural Science and Tech- nology, Vol. B1, 2011, pp. 964-974. [4] J. Al-Mahamid, “Integration of Water Resources of the Upper Aquifer in Amman-Zarqa Basin Based on Mathe- matical Modeling and GIS, Jordan,” Freiberg Online Ge- ology, Vol. 12, 2005, pp. 7-223. [5] Al-Mashagbah, R. Al-Adamat, and E. Salmeh, “The Use of Kri gin g Techniques with in GIS Environment to Inves- tigate Groundwater Quality in the Amman-Zarqa Ba- sin/Jordan,” Research Journal of Environmental and Earth Sciences, Vol. 4, No 2, 201 1, pp. 177-185. [6] E. Al-Tarazi, J. A. Rajab, A. Al-Naqa and M . El-Waheidi, “Detecting Leachate Plumes and Groundwater Pollution at Ruseifa Municipal Landfill Utalising VLF-EM Me- thod,” Journal of Applied Geophysics, Vol. 65, 2008, pp. 121-131. doi:10.1016/j.jappgeo.2008.06.005 [7] P. Balakrishnan, A. Saleem and N. D, “Mallikarjan, Groundwater Quality Mapping Using Geographic Infor- mation System (GIS): A Case Study of Gulbarga City, Karnataka, India,” African Journal of Environmental Science and Technology, Vol.5, No. 12, 2011, pp. 1069-1084. doi:10.5897/AJEST11.134 [8] J. Dottridge and N. A. Jaber, “Groundwater Resources and Quality in Northeastern Jordan: Safe Yield and Sus- tainability,” Applied Geography, Vo l. 19, pp. 313-323. doi:10.1016/S0143-6228(99)00012-0 [9] A. El-Naqa, N. Hammouri and M. Kuisi, “GIS- Based Evaluation of Groundwater Vulnerability in the Russeifa Area Jordan,” Revista Mexicana de Ciencias Geológicas, Vol. 23, 1999, pp. 277-287. [10] N. Hammouri and A. El-Naqa, “GIS Based HydroGeo- logical Vulnerability Mapping of Ground Water Re- sources in Jerash Area- Jordan,” Geofísica Internacional,  K. A. Al q a d i ET AL. Copyright © 2013 SciRes. CWEEE 35 Vol. 47, No. 2, 2008, pp. 85-97. [11] P. F. Hudak, “Regional Trends in Nitrate Content of Texas Groundwater,” Journal of Hydrology, Vol. 228, 2000, pp. 37-47. doi:10.1016/S0022-1694(99)00206-1 [12] Jordanian Institute of Standards and Metrology (JISM) Drinking water standards No. (286/2001), 2001, Gov- ernment of Jordan, Amman. [13] Jordan Ministry of Water and Irrigation (JMWI). Disi- Mudawarra to Amman Water Conveyance System: Envi- ronmental and Social Management Plan Part 2. 2009, Government of Jo r dan, Amman. [14] G. Jousma, Guideline on: Groundwater Monitoring for General Reference Purposes. International Working Group I, International Groundwater Resources Assess- ment Centre, Ut r acht, GP 2008-1, 2008. [15] R. T. Mehrjardi, M. Z. Jahromi, S. Hahmodi and A. Hei- dari, “Spatial Distribution of Groundwater Quaity and Geostatistics (Case Study: Yazd-Ardakan Plain),” World Applied Sciences Journal, Vol. 4, No. 1, 2008, pp. 9-17. [16] B. Nas and A. Berktay, “Groundwater Quality Mapping in Urban Groundwater Using GIS,” Environmental Mon- itoring and Assessment, Vo l . 160, 2010, pp. 215-227. doi:10.1007/s10661-008-0689-4 [17] O. Rimawi, “Hydrochemistry and isotope hydrology of groundwater and surface water in the north-east of Ma- fraq, Dhuleil, Hallabat, Azraq basin, PhD. Thesis,” Techn. University, Muenchen, 1985, p. 240. [18] E. Salameh, “Over-Exploitation of Groundwater Re- sources and Their Environmental and Socio-Economic Implications: The Case of Jordan,” Water International Vol. 33, No. 1, 2008, pp. 55-68. doi:10.1080/02508060801927663 |