

Paper Menu >>
Journal Menu >>
 Psychology 2013. Vol.4, No.6, 541-546 Published Online June 2013 in SciRes (http://www.scirp.org/journal/psych) http://dx.doi.org/10.4236/psych.2013.46077 Copyright © 2013 SciRes. 541 Human Susceptibility to Framing Effect in Decisions Can Be Reflected in Scalp Potentials Jianmin Zeng1, Fenghua Zhang2, Ying Wang3, Qinglin Zhang1*, Hong Yuan1, Lei Jia1, Jiang Qiu1 1Ministry of Education’s Key Laboratory of Cognition and Personality, Faculty of Psychology, Southwest University, Chongqing, China 2Department of Psychology, Jiangxi Normal University, Nanchang, China 3Xiangshan High School, Hancheng, China Email: *[email protected] Received March 11th, 2013; revised April 13th, 2013; accepted May 12th, 2013 Copyright © 2013 Jianmin Zeng et al. This is an open access article distributed under the Creative Commons Attribution License, which permits unrestricted use, distribution, and reproduction in any medium, provided the original work is properly cited. Humans are susceptible to a famous decision bias named framing effect, which refers that people make different decisions in two decision questions that are intrinsically the same but described in different ways. This intriguing phenomenon has been widely studied with behavioral methods, animal models, and fMRI technique. To date, it’s still unknown whether human susceptibility to this intriguing decision bias can be reflected in scalp potentials. We recorded subjects’ scalp potentials when they decided between risky op- tions and sure options, which were described in positive or negative way. We found that subjects’ brain potential significantly differed between when their choices were consistent with framing effect and when not. More significantly, we found that their susceptibility to framing effect could be reflected in their scalp potentials. Further research in this line can possibly help minimize framing effect bias. Keywords: Framing Effect; Risky Decision Making; Prospect Theory; Event-Related Potentials Introduction Framing effect refers that two different descriptions of the intrinsically same decision question lead to different decisions. A famous example of such came from Tversky and Kahneman (1981). Suppose a disease is coming to attack US, which will kill 600 people according to accurate scientific estimation. Two alternative programs to deal with this disease are proposed. In a positive frame, you need to choose between 200 people will be saved for sure, and all people will be saved with a probability of 1/3 or nobody will be saved with a probability of 2/3. In a negative frame, you need to choose between 400 people will die for sure, and all people will die with a probability of 1/3 or nobody will die with a probability of 2/3. Although the two decision questions in the two frames are intrinsically the same, most of people chose the sure option in the positive frame but the risky option in the negative frame. This phenomenon is so intriguing that many studies have been devoted into investigat- ing it (Druckman, 2001a, 2001b; Frisch, 1993; Levin, Gaeth, Schreiber, & Lauriola, 2002; Levin, Schneider, & Gaeth, 1998; Nelson, Oxley, & Clawson, 1997; Reyna & Ellis, 1994; Smith & Levin, 1996). Even non-human animals are also susceptible to the framing effect. Lakshminarayanan, Chen, and Santos (2011) revealed that even monkeys exhibited framing effect: they were risk seeking in negative frames and risk averse in positive frames. Marsh and Kacelnik (2002) found that even birds like starlings exhibited more risk seeking in negative frames than in positive frames. In their experiment, the gain and loss were represented by the value higher or lower than the starlings’ expectation. These studies suggested that framing effect may have ancient evolutionary root. With functional magnetic resonance imaging (fMRI), De Martino, Kumaran, Seymour, and Dolan (2006) found that the susceptibility to the framing effect can be reflected in the activ- ity of orbital and medial prefrontal cortex across subjects. Gonzalez, Dana, Koshino, and Just (2005) revealed that the framing effect was associated with the activity of the prefrontal and parietal cortices. Deppe et al. (2005) revealed that indi- viduals’ susceptibility to framing effect correlated with the activity of the ventromedial prefrontal cortex. Deppe et al. (2007) revealed that individuals’ susceptibility to framing effect correlated with the activity of the anterior cingulated cortex. All studies mentioned in this paragraph used fMRI technique. So far, there are only two ERP studies on the framing effect. Ma, Feng, Xu, Bian, and Tang (2012) examined the framing effect in outcome processing and found that outcomes in nega- tive frames induced stronger feedback-related negativity than outcomes in positive frames. This study did not study framing effect in decisions. Zhang, Zeng, and Zhang (2010) examined the scalp potentials induced by different frames. However, this study did not examine the scalp potentials related to framing effect (the interaction between frames and choices). It also did not examine the relationship between susceptibility to framing effect and scalp potentials. *Corresponding author. 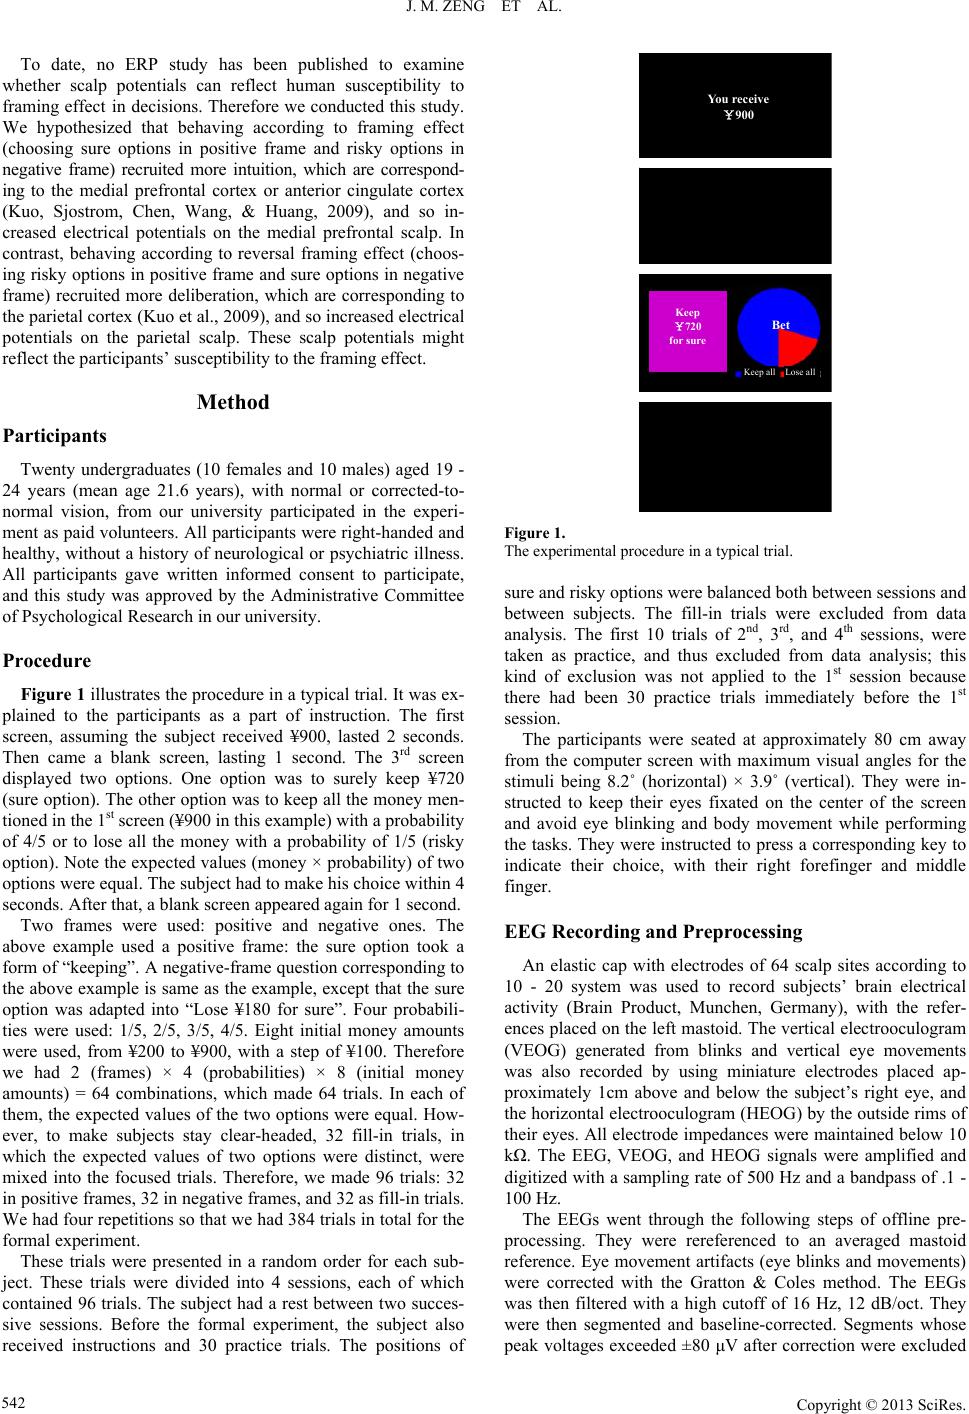 J. M. ZENG ET AL. To date, no ERP study has been published to examine whether scalp potentials can reflect human susceptibility to framing effect in decisions. Therefore we conducted this study. We hypothesized that behaving according to framing effect (choosing sure options in positive frame and risky options in negative frame) recruited more intuition, which are correspond- ing to the medial prefrontal cortex or anterior cingulate cortex (Kuo, Sjostrom, Chen, Wang, & Huang, 2009), and so in- creased electrical potentials on the medial prefrontal scalp. In contrast, behaving according to reversal framing effect (choos- ing risky options in positive frame and sure options in negative frame) recruited more deliberation, which are corresponding to the parietal cortex (Kuo et al., 2009), and so increased electrical potentials on the parietal scalp. These scalp potentials might reflect the participants’ susceptibility to the framing effect. Method Participants Twenty undergraduates (10 females and 10 males) aged 19 - 24 years (mean age 21.6 years), with normal or corrected-to- normal vision, from our university participated in the experi- ment as paid volunteers. All participants were right-handed and healthy, without a history of neurological or psychiatric illness. All participants gave written informed consent to participate, and this study was approved by the Administrative Committee of Psychological Research in our university. Procedure Figure 1 illustrates the procedure in a typical trial. It was ex- plained to the participants as a part of instruction. The first screen, assuming the subject received ¥900, lasted 2 seconds. Then came a blank screen, lasting 1 second. The 3rd screen displayed two options. One option was to surely keep ¥720 (sure option). The other option was to keep all the money men- tioned in the 1st screen (¥900 in this example) with a probability of 4/5 or to lose all the money with a probability of 1/5 (risky option). Note the expected values (money × probability) of two options were equal. The subject had to make his choice within 4 seconds. After that, a blank screen appeared again for 1 second. Two frames were used: positive and negative ones. The above example used a positive frame: the sure option took a form of “keeping”. A negative-frame question corresponding to the above example is same as the example, except that the sure option was adapted into “Lose ¥180 for sure”. Four probabili- ties were used: 1/5, 2/5, 3/5, 4/5. Eight initial money amounts were used, from ¥200 to ¥900, with a step of ¥100. Therefore we had 2 (frames) × 4 (probabilities) × 8 (initial money amounts) = 64 combinations, which made 64 trials. In each of them, the expected values of the two options were equal. How- ever, to make subjects stay clear-headed, 32 fill-in trials, in which the expected values of two options were distinct, were mixed into the focused trials. Therefore, we made 96 trials: 32 in positive frames, 32 in negative frames, and 32 as fill-in trials. We had four repetitions so that we had 384 trials in total for the formal experiment. These trials were presented in a random order for each sub- ject. These trials were divided into 4 sessions, each of which contained 96 trials. The subject had a rest between two succes- sive sessions. Before the formal experiment, the subject also received instructions and 30 practice trials. The positions of You receive ¥900 Keep ¥720 for sure Bet Keep all Lose all Figure 1. The experimental procedure in a typical trial. sure and risky options were balanced both between sessions and between subjects. The fill-in trials were excluded from data analysis. The first 10 trials of 2nd, 3rd, and 4th sessions, were taken as practice, and thus excluded from data analysis; this kind of exclusion was not applied to the 1st session because there had been 30 practice trials immediately before the 1st session. The participants were seated at approximately 80 cm away from the computer screen with maximum visual angles for the stimuli being 8.2˚ (horizontal) × 3.9˚ (vertical). They were in- structed to keep their eyes fixated on the center of the screen and avoid eye blinking and body movement while performing the tasks. They were instructed to press a corresponding key to indicate their choice, with their right forefinger and middle finger. EEG Recording and Preprocessing An elastic cap with electrodes of 64 scalp sites according to 10 - 20 system was used to record subjects’ brain electrical activity (Brain Product, Munchen, Germany), with the refer- ences placed on the left mastoid. The vertical electrooculogram (VEOG) generated from blinks and vertical eye movements was also recorded by using miniature electrodes placed ap- proximately 1cm above and below the subject’s right eye, and the horizontal electrooculogram (HEOG) by the outside rims of their eyes. All electrode impedances were maintained below 10 kΩ. The EEG, VEOG, and HEOG signals were amplified and digitized with a sampling rate of 500 Hz and a bandpass of .1 - 100 Hz. The EEGs went through the following steps of offline pre- processing. They were rereferenced to an averaged mastoid reference. Eye movement artifacts (eye blinks and movements) were corrected with the Gratton & Coles method. The EEGs was then filtered with a high cutoff of 16 Hz, 12 dB/oct. They were then segmented and baseline-corrected. Segments whose peak voltages exceeded ±80 μV after correction were excluded Copyright © 2013 SciRes. 542  J. M. ZENG ET AL. before averaging. All these steps were performed with the Brain Vision Analyser software (Brain Products). The ERP wave- forms were time-locked at the onset of the stimuli in the deci- sion screen of Figure 1. The averaged epochs for ERP were 1700 ms including 1500 ms post-stimulus waveform and 200 ms pre-stimulus baseline. Results Behavioral Results Firstly, we examined whether framing effect occurred for each probability. We compared the counts of trials in which the subjects’ choices were consistent with framing effect (choosing sure options in positive frame or risky options in negative frame) and those inconsistent (choosing risky options in posi- tive frame or sure options in negative frame) for each probabil- ity. We found that framing effect did not appear for the prob- ability of 1/5. This is understandable because prospect theory (Kahneman & Tversky, 1979) stated people are generally risk- neutral for some probability between small and middle, and thus people’s choices might not be affected by frames for these probabilities. Therefore the data of this probability (1/5) were excluded from the following behavioral and neural analysis. We then compared the counts of trials in which the subjects’ choices were consistent with framing effect (mean ± se = 139.20 ± 5.569) and those inconsistent (mean ± se = 96.85 ± 5.672), as shown in Figure 2. A paired t-test revealed a signifi- cant difference: t(19) = 3.772, p = .001. This result suggested our subjects were generally susceptible to framing effect. Electrophysiological Results We firstly compared the scalp potentials between framing effect and reversal framing effect. According to the waveforms and topographic maps, we chose two time windows and some electrode sites for analysis. In the time window of 1100 - 1200 ms, the following elec- trode sites were selected for analysis: Fpz, Fp1, AF3, AF4, F4. Figure 2. Framing effect and reversal framing effect reflected in averaged counts. Framing effect: trials in which the subjects chose sure options in posi- tive frame or risky options in negative frame. Reversal framing effect: trials in which the subjects chose risky options in positive frame or sure options in negative frame. A 5 (electrode) × 2 (effect: framing effect vs reversal framing effect) repeated measures ANOVA was used to analyzed the scalp potentials. The Greenhouse-Geisser correction was ap- plied to p-values whenever necessary. We found the potentials related to framing effect differed from those to reversal framing effect significantly: F(1, 19) = 6.635, p = .019, ηp 2 = .259. Fig- ure 3 illustrated this contrast. In the time window of 1300 - 1500 ms, the following elec- trode sites were selected for analysis: Pz, P1, P3, POz, PO3. A 5 (electrode) × 2 (effect: framing effect vs reversal framing effect) repeated measures ANOVA was used to analyzed the scalp potentials. We found the potentials related to framing effect differed from those to reversal framing effect signifi- cantly: F(1, 19) = 4.483, p = .048, ηp 2 = .191. Figure 4 illus- trated this contrast. An intriguing question is, whether the subjects’ susceptibility to framing effect can be reflected in their scalp potentials. For this purpose, we calculated three indices. Behavioral index of framing effect = count of trials in which a subject’s choice was consistent with framing effect—that of inconsistent. Scalp po- tential index of framing effect = averaged scalp potential of trials in which a subject’s choice was consistent with framing effect—that of inconsistent. Scalp potential index of framing effect has two kinds: one for the medial prefrontal scalp during 1100 - 1200 ms, and the other for the parietal scalp during 1300 - 1500 ms. Figure 5 depicts the co-variation relationship between be- havioral index of framing effect and scalp potential index of framing effect in 1100 - 1200 ms on the medial prefrontal scalp. With a linear regression, scalp potential index of framing effect can positively reflect behavioral index of framing effect sig- nificantly: p = .011. This result means, the more a subject’s electrical potential on the medial prefrontal scalp was influ- enced by the framing effect, the more a subject’s choice was influenced by the framing effect. Figure 6 depicts the co-variation relationship between be- havioral index of framing effect and scalp potential index of framing effect in 1300 - 1500 ms on the parietal scalp. With a linear regression, scalp potential index of framing effect can negatively reflect behavioral index of framing effect signifi- cantly: p = .005. This result means, the more a subject’s elec- trical potential on the parietal scalp was influenced by the framing effect, the less a subject’s choice was influenced by the framing effect. Discussion In our study, the participants exhibited framing effect in all probabilities (4/5, 3/5, 2/5) except the too small probability (1/5). This result was consistent with prospect theory (Kahne- man & Tversky, 1979). Choices consistent with framing effect (choosing sure options in positive frame and risky options in negative frame) were preceded by relatively stronger electrical potentials on the medial prefrontal scalp during 1100 - 1200 ms. Choices consistent with reversal framing effect (choosing risky options in positive frame and sure options in negative frame) were preceded by relatively stronger electrical potentials on the parietal scalp during 1300 - 1500 ms. Most importantly, the electrical potentials on these two scalp areas could respectively reflect subjects’ susceptibility to the framing effect. Previous fMRI studies (De Martino et al., 2006; Deppe et al., 2005; Deppe et al., 2007; Gonzalez et al., 2005; Kuo et al., Copyright © 2013 SciRes. 543  J. M. ZENG ET AL. Copyright © 2013 SciRes. 544 Figure 3. Waveforms at the electrode sites of AF4, Fpz and Fp1; Topographical map of the difference potential between framing effect and reversal framing effect in the time window of 1100 - 1200 ms. Figure 4. Waveforms at the electrode sites of P3, P1 and POz; Topographical map of the difference potential between framing effect and reversal framing effect in the time window of 1300 - 1500 ms. 2009) have related framing effect or intuition to medial pre- frontal or anterior cingulate cortices. Therefore we expected that stronger electrical potentials on medial prefrontal scalp would precede choices consistent with framing effect. As revealed above, they did. Choosing consistently with framing effect is a dominant choice pattern, which possibly represents a default decision pattern and so relies more on intuition. That is why the fMRI studies and our ERP study had the above observations. 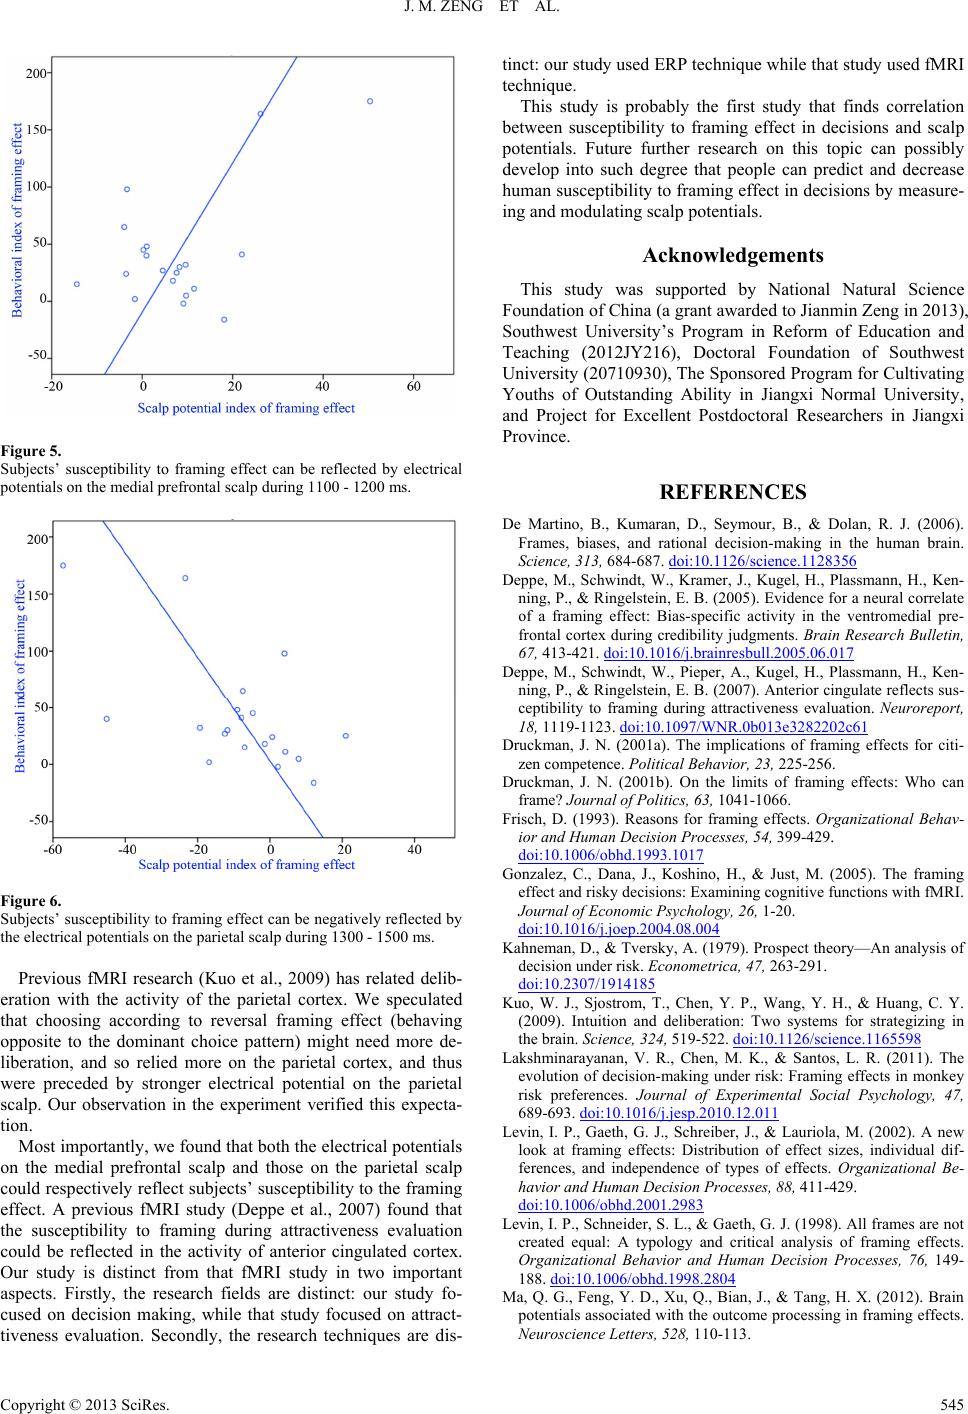 J. M. ZENG ET AL. Figure 5. Subjects’ susceptibility to framing effect can be reflected by electrical potentials on the medial prefrontal scalp during 1100 - 1200 ms. Figure 6. Subjects’ susceptibility to framing effect can be negatively reflected by the electrical potentials on the parietal scalp during 1300 - 1500 ms. Previous fMRI research (Kuo et al., 2009) has related delib- eration with the activity of the parietal cortex. We speculated that choosing according to reversal framing effect (behaving opposite to the dominant choice pattern) might need more de- liberation, and so relied more on the parietal cortex, and thus were preceded by stronger electrical potential on the parietal scalp. Our observation in the experiment verified this expecta- tion. Most importantly, we found that both the electrical potentials on the medial prefrontal scalp and those on the parietal scalp could respectively reflect subjects’ susceptibility to the framing effect. A previous fMRI study (Deppe et al., 2007) found that the susceptibility to framing during attractiveness evaluation could be reflected in the activity of anterior cingulated cortex. Our study is distinct from that fMRI study in two important aspects. Firstly, the research fields are distinct: our study fo- cused on decision making, while that study focused on attract- tiveness evaluation. Secondly, the research techniques are dis- tinct: our study used ERP technique while that study used fMRI technique. This study is probably the first study that finds correlation between susceptibility to framing effect in decisions and scalp potentials. Future further research on this topic can possibly develop into such degree that people can predict and decrease human susceptibility to framing effect in decisions by measure- ing and modulating scalp potentials. Acknowledgements This study was supported by National Natural Science Foundation of China (a grant awarded to Jianmin Zeng in 2013), Southwest University’s Program in Reform of Education and Teaching (2012JY216), Doctoral Foundation of Southwest University (20710930), The Sponsored Program for Cultivating Youths of Outstanding Ability in Jiangxi Normal University, and Project for Excellent Postdoctoral Researchers in Jiangxi Province. REFERENCES De Martino, B., Kumaran, D., Seymour, B., & Dolan, R. J. (2006). Frames, biases, and rational decision-making in the human brain. Science, 313, 684-687. doi:10.1126/science.1128356 Deppe, M., Schwindt, W., Kramer, J., Kugel, H., Plassmann, H., Ken- ning, P., & Ringelstein, E. B. (2005). Evidence for a neural correlate of a framing effect: Bias-specific activity in the ventromedial pre- frontal cortex during credibility judgments. Brain Research Bulletin, 67, 413-421. doi:10.1016/j.brainresbull.2005.06.017 Deppe, M., Schwindt, W., Pieper, A., Kugel, H., Plassmann, H., Ken- ning, P., & Ringelstein, E. B. (2007). Anterior cingulate reflects sus- ceptibility to framing during attractiveness evaluation. Neuroreport, 18, 1119-1123. doi:10.1097/WNR.0b013e3282202c61 Druckman, J. N. (2001a). The implications of framing effects for citi- zen competence. Political Behavior, 23, 225-256. Druckman, J. N. (2001b). On the limits of framing effects: Who can frame? Journal of Politics , 63, 1041-1066. Frisch, D. (1993). Reasons for framing effects. Organizational Behav- ior and Human Decision Processes, 54, 399-429. doi:10.1006/obhd.1993.1017 Gonzalez, C., Dana, J., Koshino, H., & Just, M. (2005). The framing effect and risky decisions: Examining cognitive functions with fMRI. Journal of Economic Psychology, 26, 1-20. doi:10.1016/j.joep.2004.08.004 Kahneman, D., & Tversky, A. (1979). Prospect theory—An analysis of decision under risk. Econometrica, 47, 263-291. doi:10.2307/1914185 Kuo, W. J., Sjostrom, T., Chen, Y. P., Wang, Y. H., & Huang, C. Y. (2009). Intuition and deliberation: Two systems for strategizing in the brain. Science, 324, 519-522. doi:10.1126/science.1165598 Lakshminarayanan, V. R., Chen, M. K., & Santos, L. R. (2011). The evolution of decision-making under risk: Framing effects in monkey risk preferences. Journal of Experimental Social Psychology, 47, 689-693. doi:10.1016/j.jesp.2010.12.011 Levin, I. P., Gaeth, G. J., Schreiber, J., & Lauriola, M. (2002). A new look at framing effects: Distribution of effect sizes, individual dif- ferences, and independence of types of effects. Organizational Be- havior and Human Decision Processes, 88, 411-429. doi:10.1006/obhd.2001.2983 Levin, I. P., Schneider, S. L., & Gaeth, G. J. (1998). All frames are not created equal: A typology and critical analysis of framing effects. Organizational Behavior and Human Decision Processes, 76, 149- 188. doi:10.1006/obhd.1998.2804 Ma, Q. G., Feng, Y. D., Xu, Q., Bian, J., & Tang, H. X. (2012). Brain potentials associated with the outcome processing in framing effects. Neuroscience Letters, 52 8, 110-113. Copyright © 2013 SciRes. 545 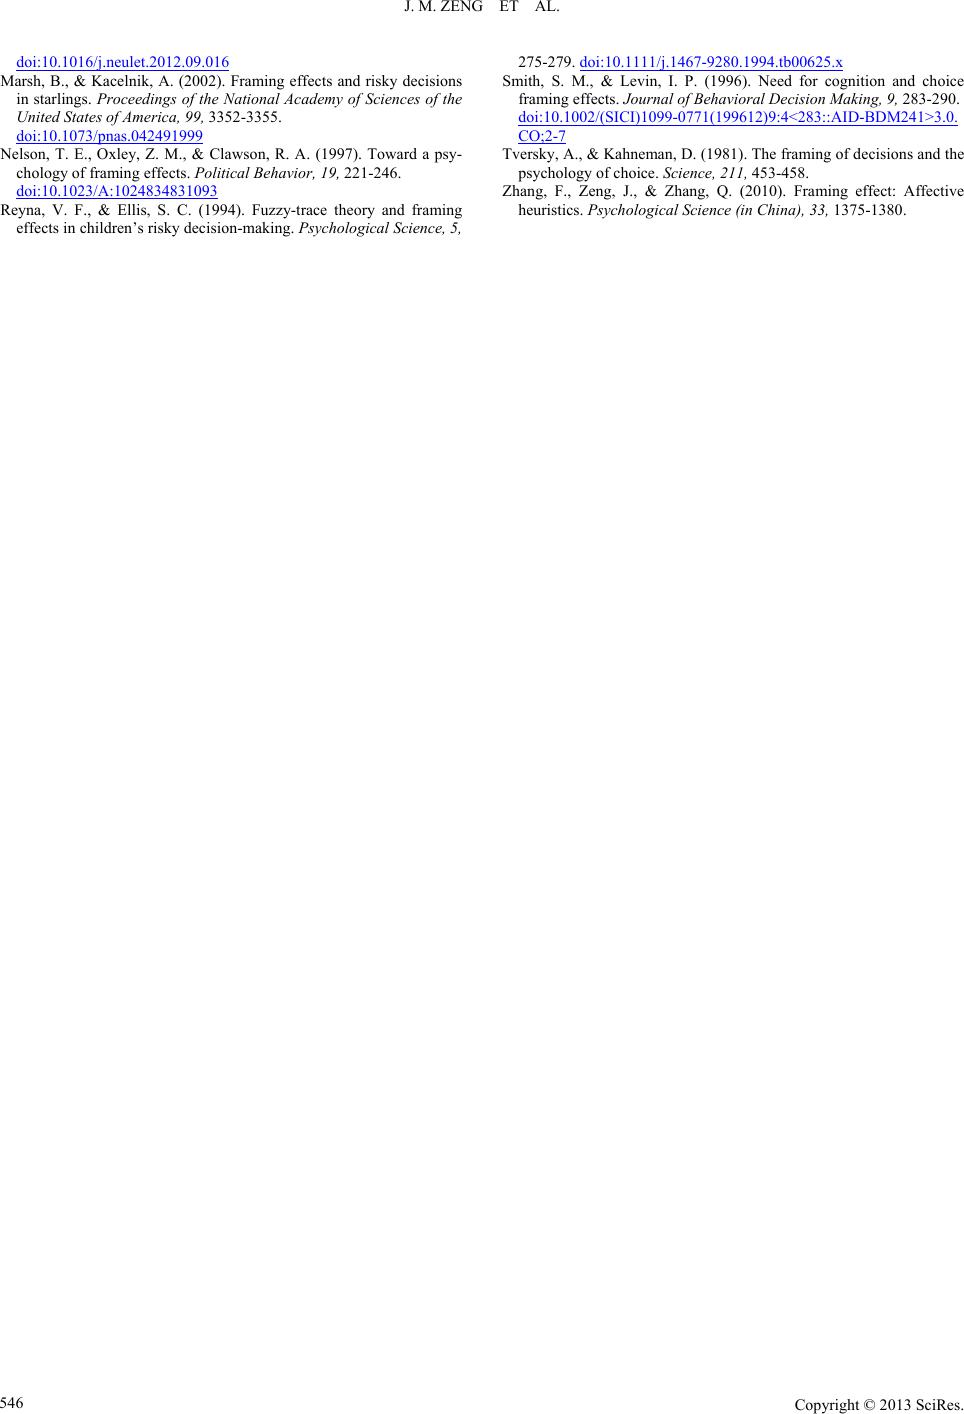 J. M. ZENG ET AL. Copyright © 2013 SciRes. 546 doi:10.1016/j.neulet.2012.09.016 Marsh, B., & Kacelnik, A. (2002). Framing effects and risky decisions in starlings. Proceedings of the National Academy of Sciences of the United States of America, 9 9, 3352-3355. doi:10.1073/pnas.042491999 Nelson, T. E., Oxley, Z. M., & Clawson, R. A. (1997). Toward a psy- chology of framing effects. Political Behavior, 19, 221-246. doi:10.1023/A:1024834831093 Reyna, V. F., & Ellis, S. C. (1994). Fuzzy-trace theory and framing effects in children’s risky decision-making. Psychological Science, 5, 275-279. doi:10.1111/j.1467-9280.1994.tb00625.x Smith, S. M., & Levin, I. P. (1996). Need for cognition and choice framing effects. Journal of Be ha vi oral Decision Making, 9, 283-290. doi:10.1002/(SICI)1099-0771(199612)9:4<283::AID-BDM241>3.0. CO;2-7 Tversky, A., & Kahneman, D. (1981). The framing of decisions and the psychology of choice. Science, 211, 453-458. Zhang, F., Zeng, J., & Zhang, Q. (2010). Framing effect: Affective heuristics. P s ych olog ical Sci enc e (in China), 33, 1375-1380. |