

Paper Menu >>
Journal Menu >>
 Journal of Financial Risk Management 2013. Vol.2, No.2, 38-42 Published Online June 2013 in SciRes (http://www.scirp.org/journal/jfrm) http://dx.doi.org/10.4236/jfrm.2013.22006 Copyright © 2013 SciRes. 38 Market Discipline of Subordinated Debt: Empirical Evidence from Japanese Commercial Banks Young-Soon Hwang1, Hong-Ghi Min2* 1Busan Development Institute, Busan, Republic of Korea 2Department of Management Science, Korea Advanced Institute of Science and Technology, Daejeon, Republic of Korea Email: *[email protected] Received November 30th, 2012; revised February 24th, 2013; accepted March 2nd, 2013 Copyright © 2013 Young-Soon Hwang, Hong-Ghi Min. This is an open access article distributed under the Creative Commons Attribution License, which permits unrestricted use, distribution, and reproduction in any medium, provided the original work is properly cited. We investigate if Subordinated Note and Debenture (SND) holders make banks to take less risk by ana- lyzing balance sheet data of Japanese commercial banks. The cross-section regression shows that banks take less risk as the amount of SNDs increase. Specifically, it is shown that the loan risk measure (the ra- tio of impaired loans to the total loans) and the stock investment risk measure (the invested stocks over bank capital) have decreased with the increase of SND amounts. These results provide evidence that SNDs are effective instrument for the market discipline. Keywords: Market Discipline; Subordinated Debt; Japanese Commercial Banks; Loan Risk; Stock Investment Risk Introduction Concern on the stability of banking system has been on the center of financial regulators. Because corruption of whole banking system could start from a bank failure, government regulatory agencies monitors bank risk and take an action to restrict excessive risk taking by banks. However, financial in- novation keeps advancing quickly and financial integration with the globe makes the regulator difficult to monitor and control the bank risk only with direct regulation. Market disci- pline is suggested as a supplement to direct regulation. Either market information could be used to help the regulator to re- strict bank risk or market can be designed to work as a super- visor by itself. This new way of bank supervision, market dis- cipline, has attracted the more interest since when Basel II sug- gestion included market discipline as one of the main pillar for banking supervision system. This BIS (Basel II, 2004)’s new suggestion emphasizes transparency of bank information, so that market could evaluate the risk and penalize if the risk is excessive. If one knows the role of finance, it is easier to understand how market disciplines the bank. (Lane, 1992) points out that finance’s role is to allow agents to maintain temporary imbal- ances of revenue and cost. Thereby economic agents who have profitable investment opportunities could start the business even though they lack sufficient capital. Finance increases economic efficiency by transforming excess savings to the most efficient investments. What is important in this process is that by whom and how it is determined whether the imbalances are temporary or not. Economists argue that this function is well done by markets and the resulting resource allocation is optimal. This is the way market treats possibly unsustainable deficits: As the probability of default becomes higher, investors require the more interest rate spread. But if the probability goes beyond some critical level, then markets deny supplying any additional funds. This is because the adverse selection problem makes the probability of reimbursement become too low. The former we call weak market discipline, and the latter strong market disci- pline. Strong market discipline is sometimes known as credit crunch. Summarizing the process, at first, investors increase the interest rate spread and then stop lending. In this way, market penalizes high risk debtors. The framework for market discipline is helpful before we proceed. (Hamalainen et al., 2005) well organized the previous researches and presented the framework. Figure 1 is the sum- mary description of it. We see there are two phases. One is monitoring phase and the other is influencing phase. In order for market discipline to be effective, the most essential condi- tion would be that investors recognize they are at stake, that is, their invested funds are not guaranteed by government or any- one. Then investors have an incentive to observe the risk of bank. Given this condition, if the bank information is transpar- ent so that investors could evaluate the risk, then investors would require appropriate interest rate spread for the risk. This is the monitoring phase. If investors are at stake and could suc- cessfully monitor the bank risk, then the spread would respond to the risk level. That is, market monitors the bank risk. If the spread is proportional to the bank risk, then banks should respond to the market signal. Increased spread means increased cost to the bank. Besides that, government regulator might probably warn for the high risk taking. This explicit and implicit cost would make the bank to try to reduce its risk. This is the influencing phase. That is, market influences bank be- *Corresponding author. 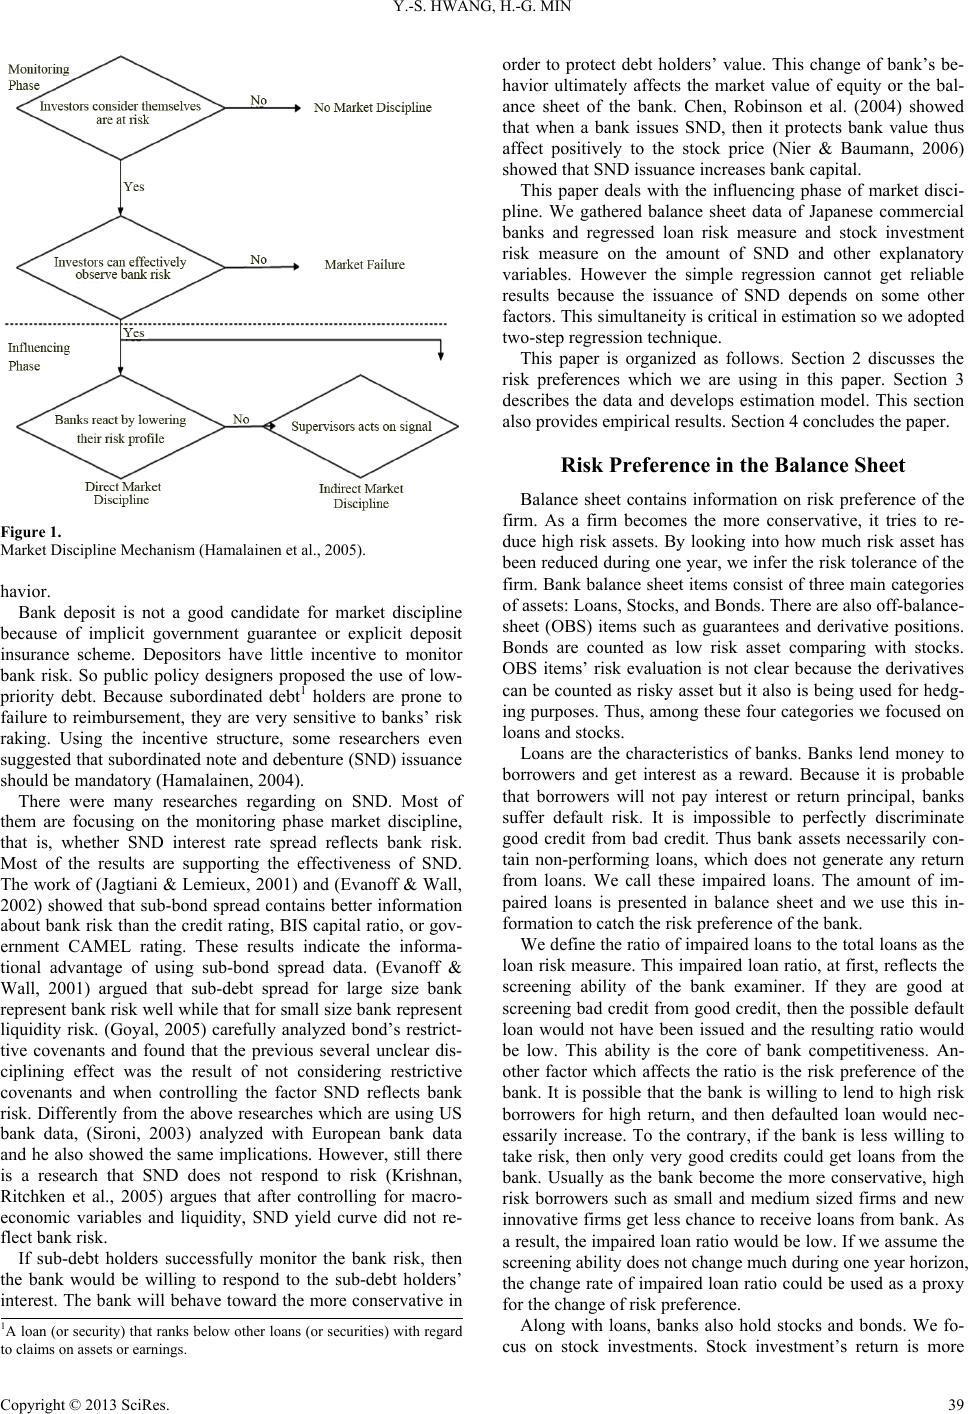 Y.-S. HWANG, H.-G. MIN Figure 1. Market Discipline Mechanism (Hamalainen et al., 2005). havior. Bank deposit is not a good candidate for market discipline because of implicit government guarantee or explicit deposit insurance scheme. Depositors have little incentive to monitor bank risk. So public policy designers proposed the use of low- priority debt. Because subordinated debt1 holders are prone to failure to reimbursement, they are very sensitive to banks’ risk raking. Using the incentive structure, some researchers even suggested that subordinated note and debenture (SND) issuance should be mandatory (Hamalainen, 2004). There were many researches regarding on SND. Most of them are focusing on the monitoring phase market discipline, that is, whether SND interest rate spread reflects bank risk. Most of the results are supporting the effectiveness of SND. The work of (Jagtiani & Lemieux, 2001) and (Evanoff & Wall, 2002) showed that sub-bond spread contains better information about bank risk than the credit rating, BIS capital ratio, or gov- ernment CAMEL rating. These results indicate the informa- tional advantage of using sub-bond spread data. (Evanoff & Wall, 2001) argued that sub-debt spread for large size bank represent bank risk well while that for small size bank represent liquidity risk. (Goyal, 2005) carefully analyzed bond’s restrict- tive covenants and found that the previous several unclear dis- ciplining effect was the result of not considering restrictive covenants and when controlling the factor SND reflects bank risk. Differently from the above researches which are using US bank data, (Sironi, 2003) analyzed with European bank data and he also showed the same implications. However, still there is a research that SND does not respond to risk (Krishnan, Ritchken et al., 2005) argues that after controlling for macro- economic variables and liquidity, SND yield curve did not re- flect bank risk. If sub-debt holders successfully monitor the bank risk, then the bank would be willing to respond to the sub-debt holders’ interest. The bank will behave toward the more conservative in order to protect debt holders’ value. This change of bank’s be- havior ultimately affects the market value of equity or the bal- ance sheet of the bank. Chen, Robinson et al. (2004) showed that when a bank issues SND, then it protects bank value thus affect positively to the stock price (Nier & Baumann, 2006) showed that SND issuance increases bank capital. This paper deals with the influencing phase of market disci- pline. We gathered balance sheet data of Japanese commercial banks and regressed loan risk measure and stock investment risk measure on the amount of SND and other explanatory variables. However the simple regression cannot get reliable results because the issuance of SND depends on some other factors. This simultaneity is critical in estimation so we adopted two-step regression technique. This paper is organized as follows. Section 2 discusses the risk preferences which we are using in this paper. Section 3 describes the data and develops estimation model. This section also provides empirical results. Section 4 concludes the paper. Risk Preference in the Balance Sheet Balance sheet contains information on risk preference of the firm. As a firm becomes the more conservative, it tries to re- duce high risk assets. By looking into how much risk asset has been reduced during one year, we infer the risk tolerance of the firm. Bank balance sheet items consist of three main categories of assets: Loans, Stocks, and Bonds. There are also off-balance- sheet (OBS) items such as guarantees and derivative positions. Bonds are counted as low risk asset comparing with stocks. OBS items’ risk evaluation is not clear because the derivatives can be counted as risky asset but it also is being used for hedg- ing purposes. Thus, among these four categories we focused on loans and stocks. Loans are the characteristics of banks. Banks lend money to borrowers and get interest as a reward. Because it is probable that borrowers will not pay interest or return principal, banks suffer default risk. It is impossible to perfectly discriminate good credit from bad credit. Thus bank assets necessarily con- tain non-performing loans, which does not generate any return from loans. We call these impaired loans. The amount of im- paired loans is presented in balance sheet and we use this in- formation to catch the risk preference of the bank. We define the ratio of impaired loans to the total loans as the loan risk measure. This impaired loan ratio, at first, reflects the screening ability of the bank examiner. If they are good at screening bad credit from good credit, then the possible default loan would not have been issued and the resulting ratio would be low. This ability is the core of bank competitiveness. An- other factor which affects the ratio is the risk preference of the bank. It is possible that the bank is willing to lend to high risk borrowers for high return, and then defaulted loan would nec- essarily increase. To the contrary, if the bank is less willing to take risk, then only very good credits could get loans from the bank. Usually as the bank become the more conservative, high risk borrowers such as small and medium sized firms and new innovative firms get less chance to receive loans from bank. As a result, the impaired loan ratio would be low. If we assume the screening ability does not change much during one year horizon, the change rate of impaired loan ratio could be used as a proxy for the change of risk preference. Along with loans, banks also hold stocks and bonds. We fo- cus on stock investments. Stock investment’s return is more 1A loan (or security) that ranks below other loans (or securities) with regard to claims on assets or earnings. Copyright © 2013 SciRes. 39 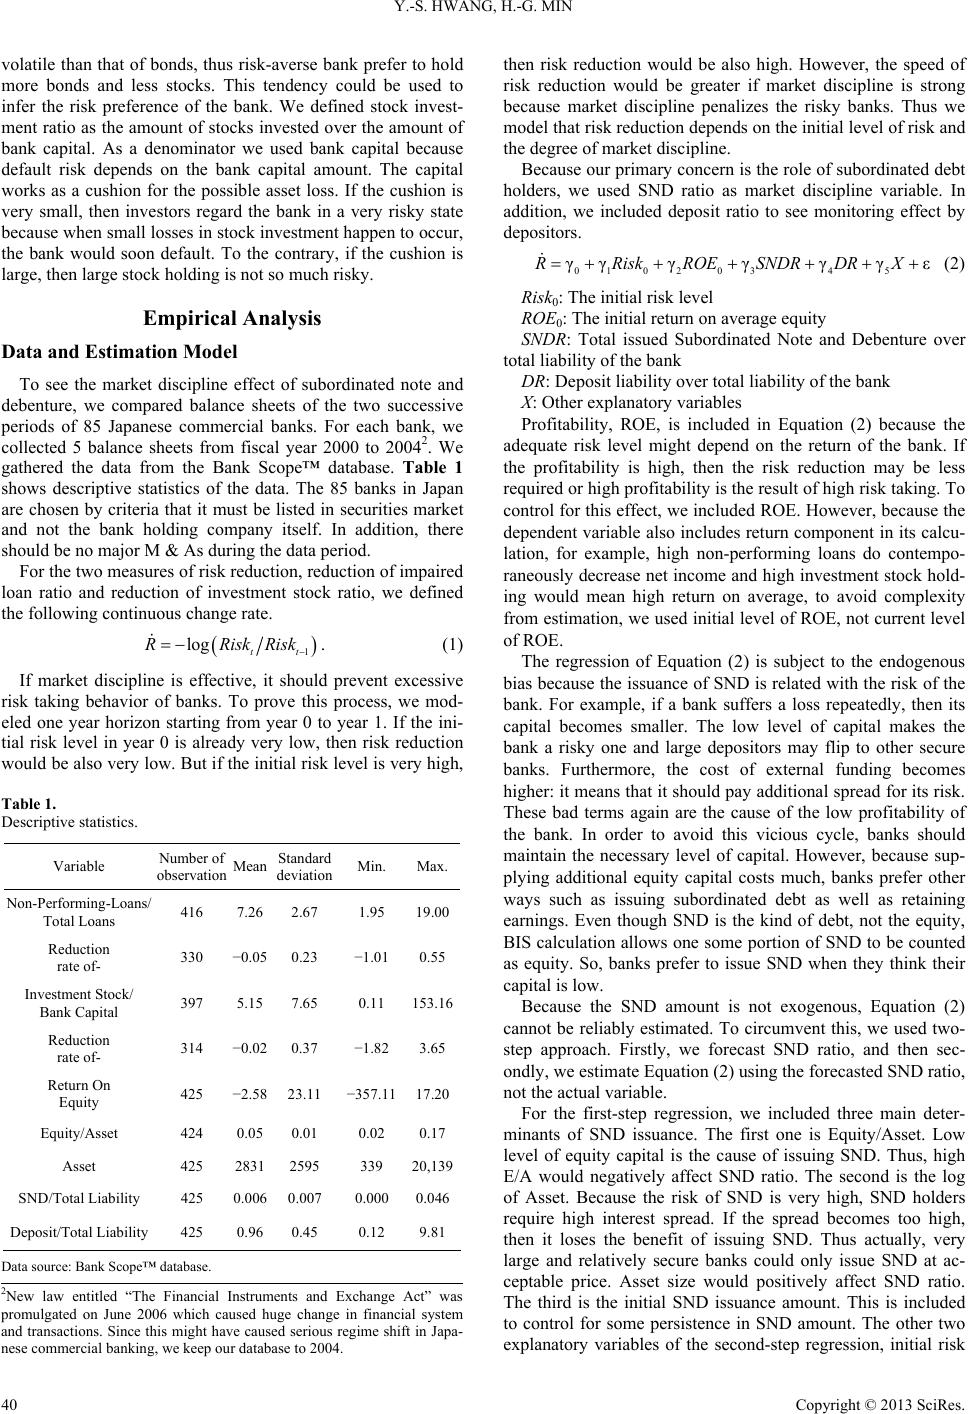 Y.-S. HWANG, H.-G. MIN volatile than that of bonds, thus risk-averse bank prefer to hold more bonds and less stocks. This tendency could be used to infer the risk preference of the bank. We defined stock invest- ment ratio as the amount of stocks invested over the amount of bank capital. As a denominator we used bank capital because default risk depends on the bank capital amount. The capital works as a cushion for the possible asset loss. If the cushion is very small, then investors regard the bank in a very risky state because when small losses in stock investment happen to occur, the bank would soon default. To the contrary, if the cushion is large, then large stock holding is not so much risky. Empirical Analysis Data and Estimation Model To see the market discipline effect of subordinated note and debenture, we compared balance sheets of the two successive periods of 85 Japanese commercial banks. For each bank, we collected 5 balance sheets from fiscal year 2000 to 20042. We gathered the data from the Bank Scope™ database. Table 1 shows descriptive statistics of the data. The 85 banks in Japan are chosen by criteria that it must be listed in securities market and not the bank holding company itself. In addition, there should be no major M & As during the data period. For the two measures of risk reduction, reduction of impaired loan ratio and reduction of investment stock ratio, we defined the following continuous change rate. 1 log tt R RiskRisk . (1) If market discipline is effective, it should prevent excessive risk taking behavior of banks. To prove this process, we mod- eled one year horizon starting from year 0 to year 1. If the ini- tial risk level in year 0 is already very low, then risk reduction would be also very low. But if the initial risk level is very high, Table 1. Descriptive statistics. Variable Number of observation Mean Standard deviation Min. Max. Non-Performing-Loans/ Total Loans 416 7.26 2.67 1.95 19.00 Reduction rate of- 330 −0.05 0.23 −1.01 0.55 Investment Stock/ Bank Capital 397 5.15 7.65 0.11 153.16 Reduction rate of- 314 −0.02 0.37 −1.82 3.65 Return On Equity 425 −2.58 23.11 −357.11 17.20 Equity/Asset 424 0.05 0.01 0.02 0.17 Asset 425 2831 2595 339 20,139 SND/Total Liability 425 0.006 0.007 0.000 0.046 Deposit/Total Liability 425 0.96 0.45 0.12 9.81 Data source: Bank Scope™ database. then risk reduction would be also high. However, the speed of risk reduction would be greater if market discipline is strong because market discipline penalizes the risky banks. Thus we model that risk reduction depends on the initial level of risk and the degree of market discipline. Because our primary concern is the role of subordinated debt holders, we used SND ratio as market discipline variable. In addition, we included deposit ratio to see monitoring effect by depositors. 01 020345 γγγγγγ εRRiskROESNDR DR X (2) Risk0: The initial risk level ROE0: The initial return on average equity SNDR: Total issued Subordinated Note and Debenture over total liability of the bank DR: Deposit liability over total liability of the bank X: Other explanatory variables Profitability, ROE, is included in Equation (2) because the adequate risk level might depend on the return of the bank. If the profitability is high, then the risk reduction may be less required or high profitability is the result of high risk taking. To control for this effect, we included ROE. However, because the dependent variable also includes return component in its calcu- lation, for example, high non-performing loans do contempo- raneously decrease net income and high investment stock hold- ing would mean high return on average, to avoid complexity from estimation, we used initial level of ROE, not current level of ROE. The regression of Equation (2) is subject to the endogenous bias because the issuance of SND is related with the risk of the bank. For example, if a bank suffers a loss repeatedly, then its capital becomes smaller. The low level of capital makes the bank a risky one and large depositors may flip to other secure banks. Furthermore, the cost of external funding becomes higher: it means that it should pay additional spread for its risk. These bad terms again are the cause of the low profitability of the bank. In order to avoid this vicious cycle, banks should maintain the necessary level of capital. However, because sup- plying additional equity capital costs much, banks prefer other ways such as issuing subordinated debt as well as retaining earnings. Even though SND is the kind of debt, not the equity, BIS calculation allows one some portion of SND to be counted as equity. So, banks prefer to issue SND when they think their capital is low. Because the SND amount is not exogenous, Equation (2) cannot be reliably estimated. To circumvent this, we used two- step approach. Firstly, we forecast SND ratio, and then sec- ondly, we estimate Equation (2) using the forecasted SND ratio, not the actual variable. For the first-step regression, we included three main deter- minants of SND issuance. The first one is Equity/Asset. Low level of equity capital is the cause of issuing SND. Thus, high E/A would negatively affect SND ratio. The second is the log of Asset. Because the risk of SND is very high, SND holders require high interest spread. If the spread becomes too high, then it loses the benefit of issuing SND. Thus actually, very large and relatively secure banks could only issue SND at ac- ceptable price. Asset size would positively affect SND ratio. The third is the initial SND issuance amount. This is included to control for some persistence in SND amount. The other two explanatory variables of the second-step regression, initial risk 2New law entitled “The Financial Instruments and Exchange Act” was promulgated on June 2006 which caused huge change in financial system and transactions. Since this might have caused serious regime shift in Japa- nese commercial banking, we keep our database to 2004. Copyright © 2013 SciRes. 40 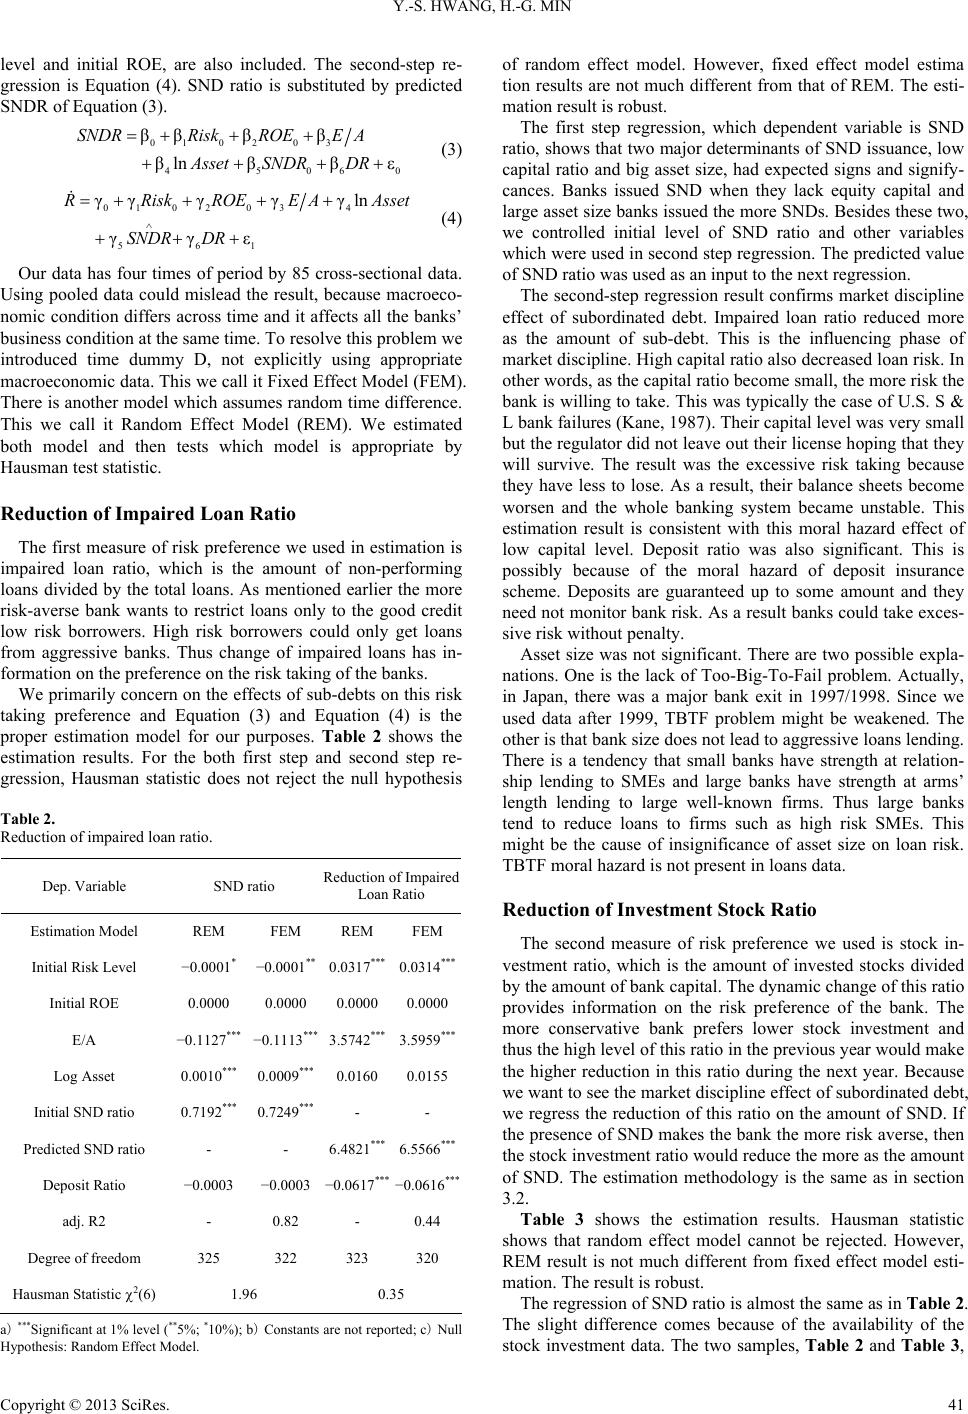 Y.-S. HWANG, H.-G. MIN level and initial ROE, are also included. The second-step re- gression is Equation (4). SND ratio is substituted by predicted SNDR of Equation (3). 01 0203 4506 ββ ββ βln ββ SNDRRiskROEEA Asset SNDRDR 0 (3) 01 02034 561 γγγγ γln γγε R RiskROEE AAsset SNDR DR (4) Our data has four times of period by 85 cross-sectional data. Using pooled data could mislead the result, because macroeco- nomic condition differs across time and it affects all the banks’ business condition at the same time. To resolve this problem we introduced time dummy D, not explicitly using appropriate macroeconomic data. This we call it Fixed Effect Model (FEM). There is another model which assumes random time difference. This we call it Random Effect Model (REM). We estimated both model and then tests which model is appropriate by Hausman test statistic. Reduction of Impaired Loan Ratio The first measure of risk preference we used in estimation is impaired loan ratio, which is the amount of non-performing loans divided by the total loans. As mentioned earlier the more risk-averse bank wants to restrict loans only to the good credit low risk borrowers. High risk borrowers could only get loans from aggressive banks. Thus change of impaired loans has in- formation on the preference on the risk taking of the banks. We primarily concern on the effects of sub-debts on this risk taking preference and Equation (3) and Equation (4) is the proper estimation model for our purposes. Table 2 shows the estimation results. For the both first step and second step re- gression, Hausman statistic does not reject the null hypothesis Table 2. Reduction of impaired loan ratio. Dep. Variable SND ratio Reduction of Impaired Loan Ratio Estimation Model REM FEM REM FEM Initial Risk Level −0.0001* −0.0001** 0.0317*** 0.0314*** Initial ROE 0.0000 0.0000 0.0000 0.0000 E/A −0.1127*** −0.1113*** 3.5742*** 3.5959*** Log Asset 0.0010*** 0.0009*** 0.0160 0.0155 Initial SND ratio 0.7192*** 0.7249*** - - Predicted SND ratio - - 6.4821*** 6.5566*** Deposit Ratio −0.0003 −0.0003 −0.0617***−0.0616*** adj. R2 - 0.82 - 0.44 Degree of freedom 325 322 323 320 Hausman Statistic 2(6) 1.96 0.35 a) ***Significant at 1% level (**5%; *10%); b) Constants are not reported; c) Null Hypothesis: Random Effect Model. of random effect model. However, fixed effect model estima tion results are not much different from that of REM. The esti- mation result is robust. The first step regression, which dependent variable is SND ratio, shows that two major determinants of SND issuance, low capital ratio and big asset size, had expected signs and signify- cances. Banks issued SND when they lack equity capital and large asset size banks issued the more SNDs. Besides these two, we controlled initial level of SND ratio and other variables which were used in second step regression. The predicted value of SND ratio was used as an input to the next regression. The second-step regression result confirms market discipline effect of subordinated debt. Impaired loan ratio reduced more as the amount of sub-debt. This is the influencing phase of market discipline. High capital ratio also decreased loan risk. In other words, as the capital ratio become small, the more risk the bank is willing to take. This was typically the case of U.S. S & L bank failures (Kane, 1987). Their capital level was very small but the regulator did not leave out their license hoping that they will survive. The result was the excessive risk taking because they have less to lose. As a result, their balance sheets become worsen and the whole banking system became unstable. This estimation result is consistent with this moral hazard effect of low capital level. Deposit ratio was also significant. This is possibly because of the moral hazard of deposit insurance scheme. Deposits are guaranteed up to some amount and they need not monitor bank risk. As a result banks could take exces- sive risk without penalty. Asset size was not significant. There are two possible expla- nations. One is the lack of Too-Big-To-Fail problem. Actually, in Japan, there was a major bank exit in 1997/1998. Since we used data after 1999, TBTF problem might be weakened. The other is that bank size does not lead to aggressive loans lending. There is a tendency that small banks have strength at relation- ship lending to SMEs and large banks have strength at arms’ length lending to large well-known firms. Thus large banks tend to reduce loans to firms such as high risk SMEs. This might be the cause of insignificance of asset size on loan risk. TBTF moral hazard is not present in loans data. Reduction of Investment Stock Ratio The second measure of risk preference we used is stock in- vestment ratio, which is the amount of invested stocks divided by the amount of bank capital. The dynamic change of this ratio provides information on the risk preference of the bank. The more conservative bank prefers lower stock investment and thus the high level of this ratio in the previous year would make the higher reduction in this ratio during the next year. Because we want to see the market discipline effect of subordinated debt, we regress the reduction of this ratio on the amount of SND. If the presence of SND makes the bank the more risk averse, then the stock investment ratio would reduce the more as the amount of SND. The estimation methodology is the same as in section 3.2. Table 3 shows the estimation results. Hausman statistic shows that random effect model cannot be rejected. However, REM result is not much different from fixed effect model esti- mation. The result is robust. The regression of SND ratio is almost the same as in Table 2. The slight difference comes because of the availability of the stock investment data. The two samples, Table 2 and Table 3, Copyright © 2013 SciRes. 41 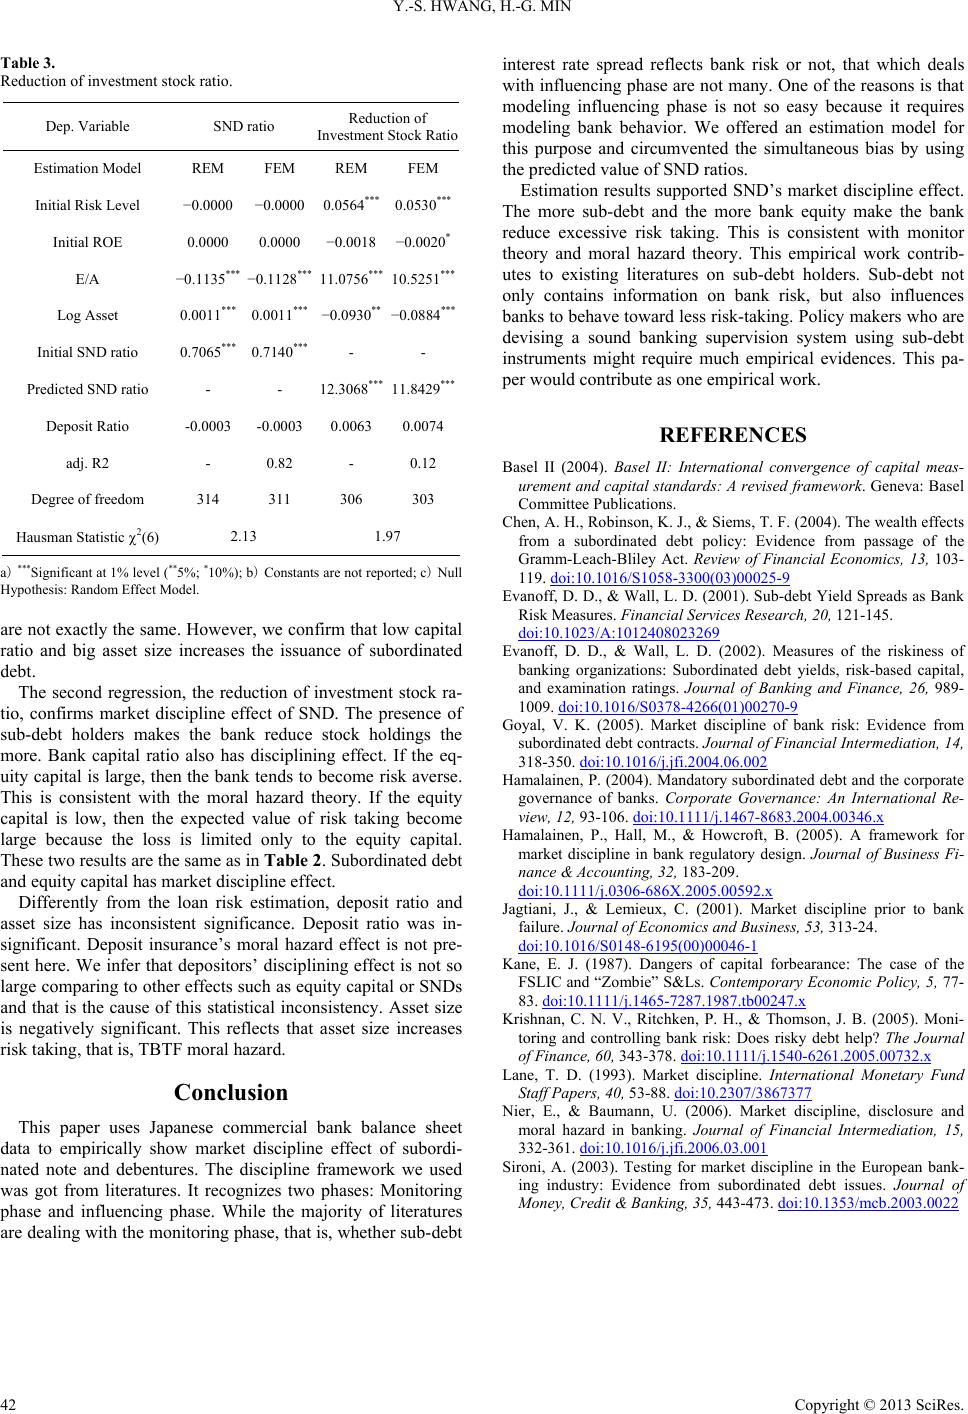 Y.-S. HWANG, H.-G. MIN Copyright © 2013 SciRes. 42 Table 3. Reduction of investment stock ratio. Dep. Variable SND ratio Reduction of Investment Stock Ratio Estimation Model REM FEM REM FEM Initial Risk Level −0.0000 −0.0000 0.0564*** 0.0530*** Initial ROE 0.0000 0.0000 −0.0018 −0.0020* E/A −0.1135*** −0.1128*** 11.0756*** 10.5251*** Log Asset 0.0011*** 0.0011*** −0.0930** −0.0884*** Initial SND ratio 0.7065*** 0.7140*** - - Predicted SND ratio - - 12.3068*** 11.8429*** Deposit Ratio -0.0003 -0.0003 0.0063 0.0074 adj. R2 - 0.82 - 0.12 Degree of freedom 314 311 306 303 Hausman Statistic 2(6) 2.13 1.97 a) ***Significant at 1% level (**5%; *10%); b) Constants are not reported; c) Null Hypothesis: Random Effect Model. are not exactly the same. However, we confirm that low capital ratio and big asset size increases the issuance of subordinated debt. The second regression, the reduction of investment stock ra- tio, confirms market discipline effect of SND. The presence of sub-debt holders makes the bank reduce stock holdings the more. Bank capital ratio also has disciplining effect. If the eq- uity capital is large, then the bank tends to become risk averse. This is consistent with the moral hazard theory. If the equity capital is low, then the expected value of risk taking become large because the loss is limited only to the equity capital. These two results are the same as in Table 2. Subordinated debt and equity capital has market discipline effect. Differently from the loan risk estimation, deposit ratio and asset size has inconsistent significance. Deposit ratio was in- significant. Deposit insurance’s moral hazard effect is not pre- sent here. We infer that depositors’ disciplining effect is not so large comparing to other effects such as equity capital or SNDs and that is the cause of this statistical inconsistency. Asset size is negatively significant. This reflects that asset size increases risk taking, that is, TBTF moral hazard. Conclusion This paper uses Japanese commercial bank balance sheet data to empirically show market discipline effect of subordi- nated note and debentures. The discipline framework we used was got from literatures. It recognizes two phases: Monitoring phase and influencing phase. While the majority of literatures are dealing with the monitoring phase, that is, whether sub-debt interest rate spread reflects bank risk or not, that which deals with influencing phase are not many. One of the reasons is that modeling influencing phase is not so easy because it requires modeling bank behavior. We offered an estimation model for this purpose and circumvented the simultaneous bias by using the predicted value of SND ratios. Estimation results supported SND’s market discipline effect. The more sub-debt and the more bank equity make the bank reduce excessive risk taking. This is consistent with monitor theory and moral hazard theory. This empirical work contrib- utes to existing literatures on sub-debt holders. Sub-debt not only contains information on bank risk, but also influences banks to behave toward less risk-taking. Policy makers who are devising a sound banking supervision system using sub-debt instruments might require much empirical evidences. This pa- per would contribute as one empirical work. REFERENCES Basel II (2004). Basel II: International convergence of capital meas- urement and capital standards: A revised framework. Geneva: Basel Committee Publications. Chen, A. H., Robinson, K. J., & Siems, T. F. (2004). The wealth effects from a subordinated debt policy: Evidence from passage of the Gramm-Leach-Bliley Act. Review of Financial Economics, 13, 103- 119. doi:10.1016/S1058-3300(03)00025-9 Evanoff, D. D., & Wall, L. D. (2001). Sub-debt Yield Spreads as Bank Risk Measures. Financial Services Research, 20 , 121-145. doi:10.1023/A:1012408023269 Evanoff, D. D., & Wall, L. D. (2002). Measures of the riskiness of banking organizations: Subordinated debt yields, risk-based capital, and examination ratings. Journal of Banking and Finance, 26, 989- 1009. doi:10.1016/S0378-4266(01)00270-9 Goyal, V. K. (2005). Market discipline of bank risk: Evidence from subordinated debt contracts. Journal of Financial Intermediation, 14, 318-350. doi:10.1016/j.jfi.2004.06.002 Hamalainen, P. (2004). Mandatory subordinated debt and the corporate governance of banks. Corporate Governance: An International Re- view, 12, 93-106. doi:10.1111/j.1467-8683.2004.00346.x Hamalainen, P., Hall, M., & Howcroft, B. (2005). A framework for market discipline in bank regulatory design. Journal of Business Fi- nance & Accounting, 32, 183-209. doi:10.1111/j.0306-686X.2005.00592.x Jagtiani, J., & Lemieux, C. (2001). Market discipline prior to bank failure. Journal of Ec o n o mi c s a n d Business, 53, 313-24. doi:10.1016/S0148-6195(00)00046-1 Kane, E. J. (1987). Dangers of capital forbearance: The case of the FSLIC and “Zombie” S&Ls. Contemporary Economic Policy, 5, 77- 83. doi:10.1111/j.1465-7287.1987.tb00247.x Krishnan, C. N. V., Ritchken, P. H., & Thomson, J. B. (2005). Moni- toring and controlling bank risk: Does risky debt help? The Journal of Finance, 60, 343-378. doi:10.1111/j.1540-6261.2005.00732.x Lane, T. D. (1993). Market discipline. International Monetary Fund Staff Papers, 40, 53-88. doi:10.2307/3867377 Nier, E., & Baumann, U. (2006). Market discipline, disclosure and moral hazard in banking. Journal of Financial Intermediation, 15, 332-361. doi:10.1016/j.jfi.2006.03.001 Sironi, A. (2003). Testing for market discipline in the European bank- ing industry: Evidence from subordinated debt issues. Journal of Money, Credit & Banking, 35, 443-473. doi:10.1353/mcb.2003.0022 |