 Vol.2, No.11, 1195-1210 (2010) Natural Science http://dx.doi.org/10.4236/ns.2010.211148 Copyright © 2010 SciRes. OPEN ACCESS Contribution to the understanding effects of weak electrical phenomena Józef Mazurkiewicz, Piotr Tomasik* Department of Chemistry and Physics, University of Agriculture, Balicka Street 122, 30 049 Kraków, Poland; *Corresponding author: Received 21 June 2010; revised 25 July 2010; accepted 29 July 2010. ABSTRACT Electronic emission spectra of N2, (N2)2, (N2)5 O2, (O2)2, (O2)5, H2O, (H2O)5, CO2, (CO2)2, CO2..H2O, NH3 and NH3.H2O situated in the electric field of 0.001, 0.005, 0.01 0.05 and 0.1 a.u. were simu- lated involving Monte Carlo optimization fol- lowed by the ZINDO/S approach. The simulated spectra showed irregular dependence on the energy of the electric field applied. Molecules without influence of the electric field emit in the vacuum ultraviolet region. Applied electric field only in case of (O2)5 generated transitions above 200 nm. The mapping of isosurface of the in- vestigated molecules revealed that the electric field applied redistributed the charge densities in the molecules in the manner approximately parallel to the energy of the field. Applied elec- trical field resulted in an increase in the water acidity and ammonia basicity. Keywords: Electronic Emission Spectra; Surface Effect; ZINDO/S Spectra Simulations 1. INTRODUCTION There are numerous papers (see, for instance [1]) de- scribing the effect of electromagnetic field upon bio- logical systems. Particular attention has been paid to electrostimulation of the alcoholic fermentation [2,3]. Electric current changed the fermentation characteristics of yeast. Either the 10 mA direct current (DC) or 100 mA alternating current (AC) applied to the culture broth significantly increased the cell growth and alcohol pro- duction rate. Also accompanied formation of higher al- cohols, esters and organic acids was influenced in such manner although some of them could result from the anodic oxidation of ethanol. Since the phenomena ob- served in the case of electrostimulation were observed in the wort likely the effect could not be assisted by the effect of the external field. Nechitailo and Gordeev [4] related observed effect of an artificial electric field upon growth of plants to perturbations occurred on the plant cell membranes. Another electrical phenomenon known as corona dis- charges have found several practical applications [5,6]. Corona discharges (Saint Elmo’s fire) have a straight- forward physical background [5,7-14]. Recent studies on the effect of corona discharges on granular starch [15] showed that, in contrast to other solid material such as metals and plastics, it penetrated starch granules causing depolymerization of polysaccharides in the granule inte- rior. Liu and Zou [16] presented hydrolysis of starch to mono- and di-saccharides with dielectric barrier dis- charge plasma. They showed that proton layer was formed within the steam layer. Recently, a series of pa- pers on modification of carbon nanotubes with low- temperature glow plasma was published [17-20]. Elec- trical field could be used for regulation of viscosity of liquids and, hence, their flow (see, for instance [21]). There are also weaker electric phenomena which, al- though common, did not find sufficient appreciation. They result from the effect of the surface. Atoms local- ized inside any solid and liquid structure are in different energetic situation than these situated on the surface of these structures i.e. on the phase borderlines. Atoms lo- calized on the surface of the structures, particularly on sharp edges and tips of needles dispose with some ex- cessive energy as their interactions with elements of an- other phase, especially gaseous, are weaker. Such cir- cumstances are responsible for well known catalytic effects of the surface, effect of lightning rod and so on. The non-saturation of interactions of the peripheral at- oms generate a gradient of potential and, in consequence, the electromagnetic field around the object. Molecules residing in this thin layer interact with the surface and with one another. Energy of such molecules is, addition- ally, influenced by external electric field to the extent  J. Mazurkiewicz et al. / Natural Science 2 (2010) 1195-1210 Copyright © 2010 SciRes. OPEN ACCESS 1196 which might be reflected in their electronic spectra. Electromagnetic field is a volume of space around the object in which energy particles called photons can mi- grate either from that object into the space or from the space to that object causing a ionization. In such manner a cold plasma is formed. Properties of the molecules in such plasma remain unknown. In this paper evaluation of differences between mole- cules outside and inside plasma surrounding the surface of inanimate objects is carried out involving electronic emission spectra of simple small molecules as nitrogen, oxygen, water, carbon dioxide and ammonia are simu- lated when placed in an electric field and without appli- cation of that field. There are available in the literature electronic spectra of the same molecules covering the region from 200 to 20 nm and these spectra have been computed with more advanced methods [22-24] but the spectra of these molecules in the electric field are lacking. In this paper, for diagnostic purposes of the effect of the electric field upon the structure of the molecules spectra were calcu- lated using less sophisticated ZINDO/S [25] method which was specially designed by its inventor for simula- tion of the spectra in the UVVIS region. 2. COMPUTATIONS Applying the Monte Carlo method [26] single molecules of N2, O2 (considered as biradical), water, CO2, CO2 with water, ammonia and ammonia in water were brought to temperature of 300 K and with influence of electric field of 0.01 a.u (and electronic spectra were simulated with HyperChem 8.0 involving ZINDO/S semiempirical method. These computations were also performed for 2 and 5 molecules of N2 and O2, 2 molecules of CO2 and 5 molecules of water and, additionally, for single molecules of N2 and O2 in the one-direction electric field varying between 0.005 and 0.1 a.u. (1 a.u. = 1.49x10⁻¹⁰ J = 931 MeV) Visualization of the iusosurface was performed with HyperChem 8, Plot Molecular Graphs, 3D Mapped Isosurface. 3. RESULTS AND DISCUSSION Because of the surface effect, the UV spectra of molecules present in aura surrounding surface of the matter should somehow differ from the spectra of the molecules over the region of aura. Changes in the mo- lecular structure induced by external electric field could be available and visualized in form of electronic spectra simulated involving suitable software. This study should be understood as an approach to the recognition of the effect of electric field upon non-recordable plasma (aura) residing on the surface of inanimate objects. Table 1 presents results of the computations carried out for nitrogen molecules. Computations for small diatomic symmetric molecule Table 1. Simulated electronic spectra of one, two and five nitrogen molecules without exposure and with exposure to external electric field. Transition energy (E) [nm] and its characteristicsa Without electric field With electric field Molecule (total number of transitions) E fb Orbital → orbital (HOMO → LUMO) and total energy [a.u] E fb Orbital → orbital (HOMO → LUMO) and total energy [a.u.] N2 (30) 100.2 100.2 90.8 56.9 23.6 0.2528 0.2528 0.8100 1.2466 0.4178 1→15, 2→6 1→16, 2→7 1→17, 4→7 1→23, 5→8 1→31, 1→8 –16.514669174 100.0c 100.0 90.0 57.0 51.7 23.5 0.2520 0.2520 0.8029 1.2217 0.0001 0.4003 1→15; 2→6 1→16; 2→7 1→17; 4→6, 3→7 1→23; 5→8 1→25; 2→8 1→31; 1→8 –16.531251288 175.0d 175.0 174.7 174.7 100.2 100.2 90.6 56.9 51.7 23.6 0.0001 0.0001 0.0001 0.0001 0.2525 0.2525 0.8087 1.2398 0.0028 0.4150 1→9, 5→7 1→10, 5→6 1→11, 5→7, 4→6, 3→7 1→12, 5→6, 4→7, 3→6 1→15, 2→6 1→16, 2→7 1→17, 4→6, 3→7 1→23, 5→8 1→25, 2→8 1→31, 1→8 –16.517425927 175.4e 175.4 174.8 174.8 0.0003 0.0003 0.0003 0.0003 1→9, 5→7, 4→6 1→10, 5→6, 4→7 1→11, 5→7, 4→6, 3→7 1→12, 5→6, 4→7, 3→6 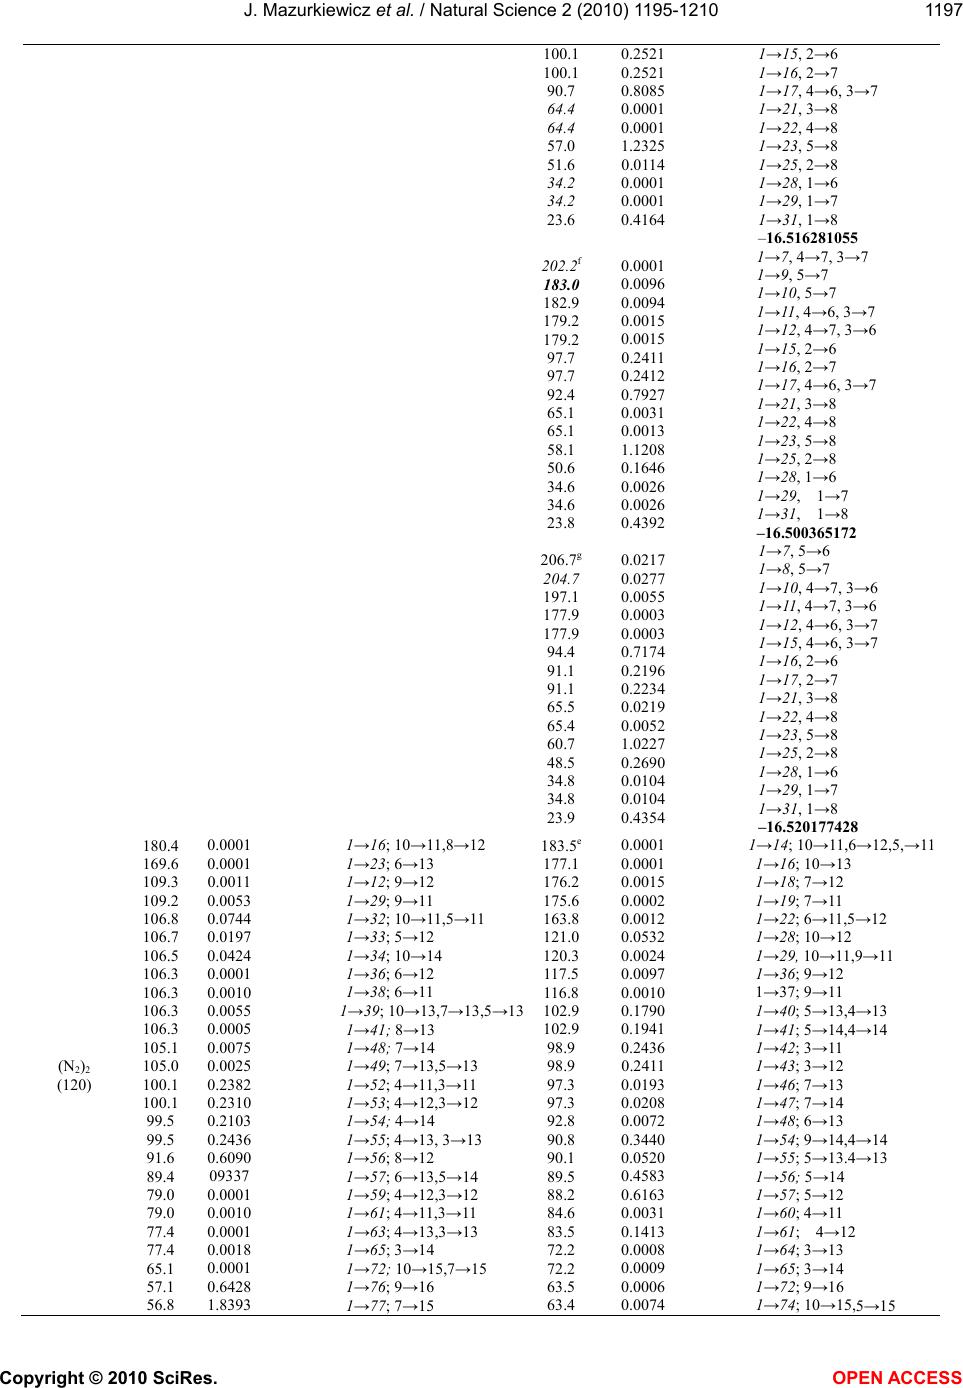 J. Mazurkiewicz et al. / Natural Science 2 (2010) 1195-1210 Copyright © 2010 SciRes. OPEN ACCESS 1197 100.1 100.1 90.7 64.4 64.4 57.0 51.6 34.2 34.2 23.6 0.2521 0.2521 0.8085 0.0001 0.0001 1.2325 0.0114 0.0001 0.0001 0.4164 1→15, 2→6 1→16, 2→7 1→17, 4→6, 3→7 1→21, 3→8 1→22, 4→8 1→23, 5→8 1→25, 2→8 1→28, 1→6 1→29, 1→7 1→31, 1→8 –16.516281055 202.2f 183.0 182.9 179.2 179.2 97.7 97.7 92.4 65.1 65.1 58.1 50.6 34.6 34.6 23.8 0.0001 0.0096 0.0094 0.0015 0.0015 0.2411 0.2412 0.7927 0.0031 0.0013 1.1208 0.1646 0.0026 0.0026 0.4392 1→7, 4→7, 3→7 1→9, 5→7 1→10, 5→7 1→11, 4→6, 3→7 1→12, 4→7, 3→6 1→15, 2→6 1→16, 2→7 1→17, 4→6, 3→7 1→21, 3→8 1→22, 4→8 1→23, 5→8 1→25, 2→8 1→28, 1→6 1→29, 1→7 1→31, 1→8 –16.500365172 206.7g 204.7 197.1 177.9 177.9 94.4 91.1 91.1 65.5 65.4 60.7 48.5 34.8 34.8 23.9 0.0217 0.0277 0.0055 0.0003 0.0003 0.7174 0.2196 0.2234 0.0219 0.0052 1.0227 0.2690 0.0104 0.0104 0.4354 1→7, 5→6 1→8, 5→7 1→10, 4→7, 3→6 1→11, 4→7, 3→6 1→12, 4→6, 3→7 1→15, 4→6, 3→7 1→16, 2→6 1→17, 2→7 1→21, 3→8 1→22, 4→8 1→23, 5→8 1→25, 2→8 1→28, 1→6 1→29, 1→7 1→31, 1→8 –16.520177428 (N2)2 (120) 180.4 169.6 109.3 109.2 106.8 106.7 106.5 106.3 106.3 106.3 106.3 105.1 105.0 100.1 100.1 99.5 99.5 91.6 89.4 79.0 79.0 77.4 77.4 65.1 57.1 56.8 0.0001 0.0001 0.0011 0.0053 0.0744 0.0197 0.0424 0.0001 0.0010 0.0055 0.0005 0.0075 0.0025 0.2382 0.2310 0.2103 0.2436 0.6090 09337 0.0001 0.0010 0.0001 0.0018 0.0001 0.6428 1.8393 1→16; 10→11,8→12 1→23; 6→13 1→12; 9→12 1→29; 9→11 1→32; 10→11,5→11 1→33; 5→12 1→34; 10→14 1→36; 6→12 1→38; 6→11 1→39; 10→13,7→13,5→13 1→41; 8→13 1→48; 7→14 1→49; 7→13,5→13 1→52; 4→11 ,3→11 1→53; 4→12,3→12 1→54; 4→14 1→55; 4→13, 3→13 1→56; 8→12 1→57; 6→13,5→14 1→59; 4→12,3→12 1→61; 4→11 ,3→11 1→63; 4→13,3→13 1→65; 3→14 1→72; 10→15,7→15 1→76; 9→16 1→77; 7→15 183.5e 177.1 176.2 175.6 163.8 121.0 120.3 117.5 116.8 102.9 102.9 98.9 98.9 97.3 97.3 92.8 90.8 90.1 89.5 88.2 84.6 83.5 72.2 72.2 63.5 63.4 0.0001 0.0001 0.0015 0.0002 0.0012 0.0532 0.0024 0.0097 0.0010 0.1790 0.1941 0.2436 0.2411 0.0193 0.0208 0.0072 0.3440 0.0520 0.4583 0.6163 0.0031 0.1413 0.0008 0.0009 0.0006 0.0074 1→14; 10→11,6→12,5,→11 1→16; 10→13 1→18; 7→12 1→19; 7→11 1→22; 6→11 ,5→12 1→28; 10→12 1→29, 10→11, 9→11 1→36; 9→12 1→37; 9→11 1→40; 5→13,4→13 1→41; 5→14,4→14 1→42; 3→11 1→43; 3→12 1→46; 7→13 1→47; 7→14 1→48; 6→13 1→54; 9→14,4→14 1→55; 5→13.4→13 1→56; 5→14 1→57; 5→12 1→60; 4→11 1→61; 4→12 1→64; 3→13 1→65; 3→14 1→72; 9→16 1→74; 10→15,5→15 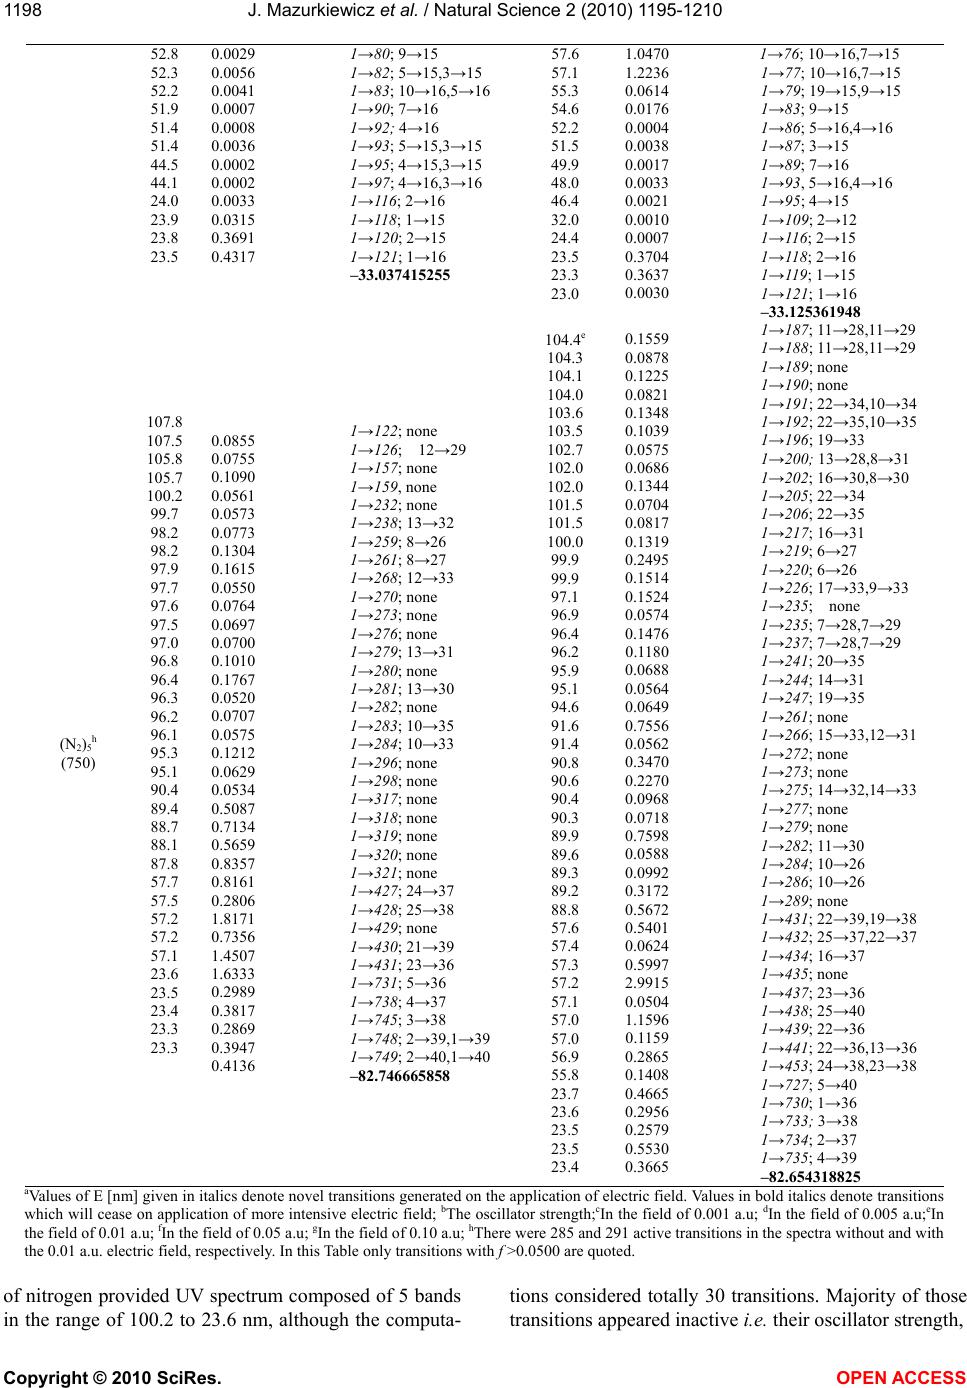 J. Mazurkiewicz et al. / Natural Science 2 (2010) 1195-1210 Copyright © 2010 SciRes. OPEN ACCESS 1198 52.8 52.3 52.2 51.9 51.4 51.4 44.5 44.1 24.0 23.9 23.8 23.5 0.0029 0.0056 0.0041 0.0007 0.0008 0.0036 0.0002 0.0002 0.0033 0.0315 0.3691 0.4317 1→80; 9→15 1→82; 5→15,3→15 1→83; 10→16,5→16 1→90; 7→16 1→92; 4→16 1→93; 5→15,3→15 1→95; 4→15,3→15 1→97; 4→16,3→16 1→116; 2→16 1→118; 1→15 1→120; 2→15 1→121; 1→16 –33.037415255 57.6 57.1 55.3 54.6 52.2 51.5 49.9 48.0 46.4 32.0 24.4 23.5 23.3 23.0 1.0470 1.2236 0.0614 0.0176 0.0004 0.0038 0.0017 0.0033 0.0021 0.0010 0.0007 0.3704 0.3637 0.0030 1→76; 10→16,7→15 1→77; 10→16,7→15 1→79; 19→15,9→15 1→83; 9→15 1→86; 5→16,4→16 1→87; 3→15 1→89; 7→16 1→93, 5→16,4→16 1→95; 4→15 1→109; 2→12 1→116; 2→15 1→118; 2→16 1→119; 1→15 1→121; 1→16 –33.125361948 (N2)5h (750) 107.8 107.5 105.8 105.7 100.2 99.7 98.2 98.2 97.9 97.7 97.6 97.5 97.0 96.8 96.4 96.3 96.2 96.1 95.3 95.1 90.4 89.4 88.7 88.1 87.8 57.7 57.5 57.2 57.2 57.1 23.6 23.5 23.4 23.3 23.3 0.0855 0.0755 0.1090 0.0561 0.0573 0.0773 0.1304 0.1615 0.0550 0.0764 0.0697 0.0700 0.1010 0.1767 0.0520 0.0707 0.0575 0.1212 0.0629 0.0534 0.5087 0.7134 0.5659 0.8357 0.8161 0.2806 1.8171 0.7356 1.4507 1.6333 0.2989 0.3817 0.2869 0.3947 0.4136 1→122; none 1→126; 12→29 1→157; none 1→159, none 1→232; none 1→238; 13→32 1→259; 8→26 1→261; 8→27 1→268; 12→33 1→270; none 1→273; none 1→276; none 1→279; 13→31 1→280; none 1→281; 13→30 1→282; none 1→283; 10→35 1→284; 10→33 1→296; none 1→298; none 1→317; none 1→318; none 1→319; none 1→320; none 1→321; none 1→427; 24→37 1→428; 25→38 1→429; none 1→430; 21→39 1→431; 23→36 1→731; 5→36 1→738; 4→37 1→745; 3→38 1→748; 2→39,1→39 1→749; 2→40,1→40 –82.746665858 104.4e 104.3 104.1 104.0 103.6 103.5 102.7 102.0 102.0 101.5 101.5 100.0 99.9 99.9 97.1 96.9 96.4 96.2 95.9 95.1 94.6 91.6 91.4 90.8 90.6 90.4 90.3 89.9 89.6 89.3 89.2 88.8 57.6 57.4 57.3 57.2 57.1 57.0 57.0 56.9 55.8 23.7 23.6 23.5 23.5 23.4 0.1559 0.0878 0.1225 0.0821 0.1348 0.1039 0.0575 0.0686 0.1344 0.0704 0.0817 0.1319 0.2495 0.1514 0.1524 0.0574 0.1476 0.1180 0.0688 0.0564 0.0649 0.7556 0.0562 0.3470 0.2270 0.0968 0.0718 0.7598 0.0588 0.0992 0.3172 0.5672 0.5401 0.0624 0.5997 2.9915 0.0504 1.1596 0.1159 0.2865 0.1408 0.4665 0.2956 0.2579 0.5530 0.3665 1→187; 11→28,11→29 1→188; 11→28,11→29 1→189; none 1→190; none 1→191; 22→34,10→34 1→192; 22→35,10→35 1→196; 19→33 1→200; 13→28,8→31 1→202; 16→30,8→30 1→205; 22→34 1→206; 22→35 1→217; 16→31 1→219; 6→27 1→220; 6→26 1→226; 17→33,9→33 1→235; none 1→235; 7→28,7→29 1→237; 7→28,7→29 1→241; 20→35 1→244; 14→31 1→247; 19→35 1→261; none 1→266; 15→33,12→31 1→272; none 1→273; none 1→275; 14→32,14→33 1→277; none 1→279; none 1→282; 11→30 1→284; 10→26 1→286; 10→26 1→289; none 1→431; 22→39,19→38 1→432; 25→37,22→37 1→434; 16→37 1→435; none 1→437; 23→36 1→438; 25→40 1→439; 22→36 1→441; 22→36,13→36 1→453; 24→38,23→38 1→727; 5→40 1→730; 1→36 1→733; 3→38 1→734; 2→37 1→735; 4→39 –82.654318825 aValues of E [nm] given in italics denote novel transitions generated on the application of electric field. Values in bold italics denote transitions which will cease on application of more intensive electric field; bThe oscillator strength;cIn the field of 0.001 a.u; dIn the field of 0.005 a.u;eIn the field of 0.01 a.u; fIn the field of 0.05 a.u; gIn the field of 0.10 a.u; hThere were 285 and 291 active transitions in the spectra without and with the 0.01 a.u. electric field, respectively. In this Table only transitions with f >0.0500 are quoted. of nitrogen provided UV spectrum composed of 5 bands in the range of 100.2 to 23.6 nm, although the computa- tions considered totally 30 transitions. Majority of those transitions appeared inactive i. e. their oscillator strength, 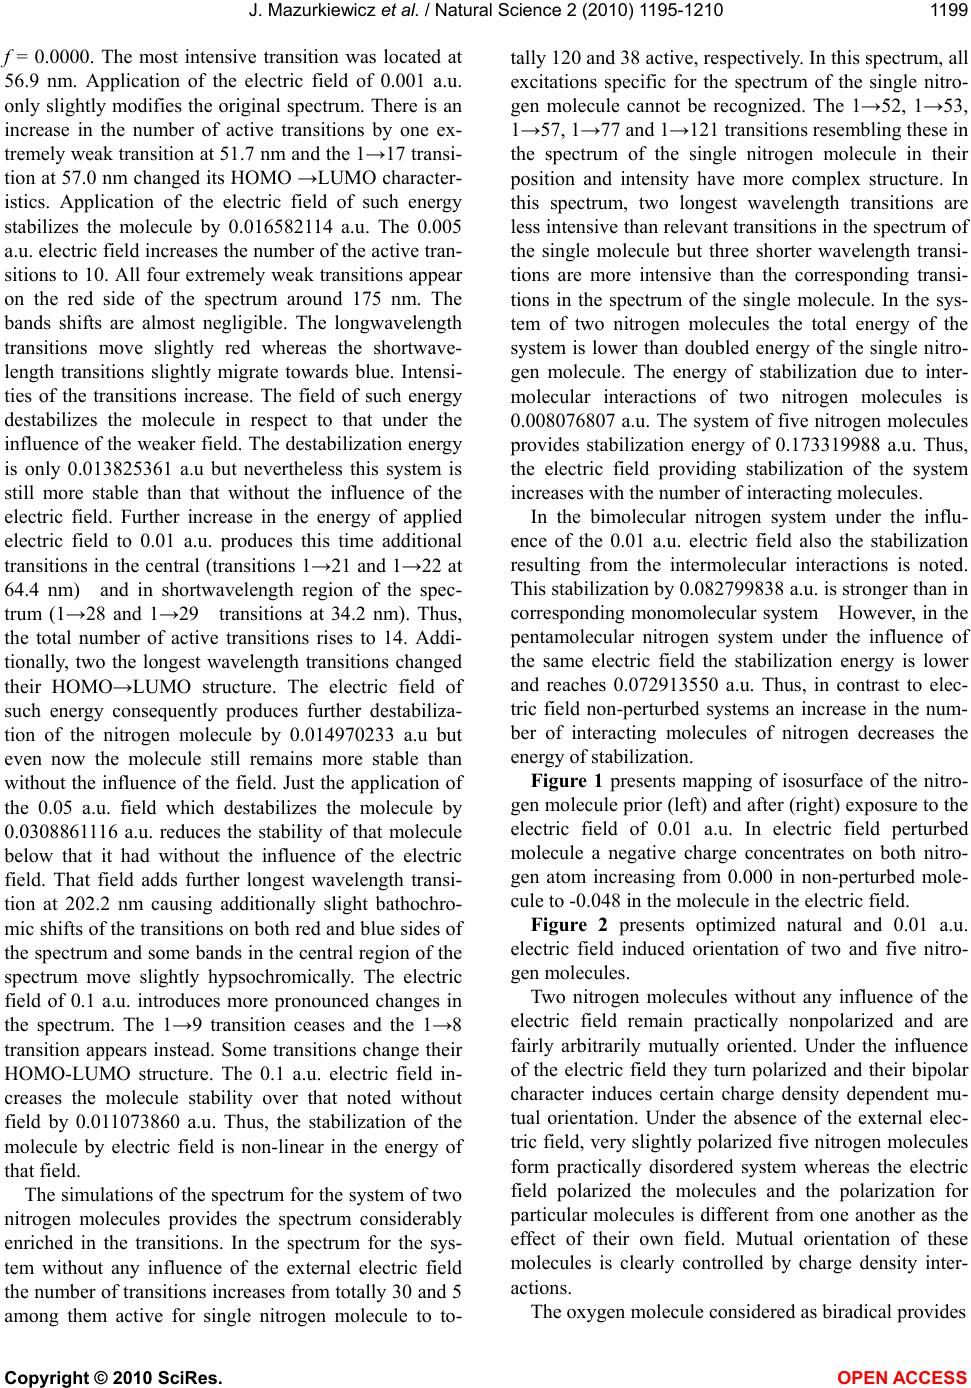 J. Mazurkiewicz et al. / Natural Science 2 (2010) 1195-1210 Copyright © 2010 SciRes. OPEN ACCESS 1199 f = 0.0000. The most intensive transition was located at 56.9 nm. Application of the electric field of 0.001 a.u. only slightly modifies the original spectrum. There is an increase in the number of active transitions by one ex- tremely weak transition at 51.7 nm and the 1→17 transi- tion at 57.0 nm changed its HOMO →LUMO character- istics. Application of the electric field of such energy stabilizes the molecule by 0.016582114 a.u. The 0.005 a.u. electric field increases the number of the active tran- sitions to 10. All four extremely weak transitions appear on the red side of the spectrum around 175 nm. The bands shifts are almost negligible. The longwavelength transitions move slightly red whereas the shortwave- length transitions slightly migrate towards blue. Intensi- ties of the transitions increase. The field of such energy destabilizes the molecule in respect to that under the influence of the weaker field. The destabilization energy is only 0.013825361 a.u but nevertheless this system is still more stable than that without the influence of the electric field. Further increase in the energy of applied electric field to 0.01 a.u. produces this time additional transitions in the central (transitions 1→21 and 1→22 at 64.4 nm) and in shortwavelength region of the spec- trum (1→28 and 1→29 transitions at 34.2 nm). Thus, the total number of active transitions rises to 14. Addi- tionally, two the longest wavelength transitions changed their HOMO→LUMO structure. The electric field of such energy consequently produces further destabiliza- tion of the nitrogen molecule by 0.014970233 a.u but even now the molecule still remains more stable than without the influence of the field. Just the application of the 0.05 a.u. field which destabilizes the molecule by 0.0308861116 a.u. reduces the stability of that molecule below that it had without the influence of the electric field. That field adds further longest wavelength transi- tion at 202.2 nm causing additionally slight bathochro- mic shifts of the transitions on both red and blue sides of the spectrum and some bands in the central region of the spectrum move slightly hypsochromically. The electric field of 0.1 a.u. introduces more pronounced changes in the spectrum. The 1→9 transition ceases and the 1→8 transition appears instead. Some transitions change their HOMO-LUMO structure. The 0.1 a.u. electric field in- creases the molecule stability over that noted without field by 0.011073860 a.u. Thus, the stabilization of the molecule by electric field is non-linear in the energy of that field. The simulations of the spectrum for the system of two nitrogen molecules provides the spectrum considerably enriched in the transitions. In the spectrum for the sys- tem without any influence of the external electric field the number of transitions increases from totally 30 and 5 among them active for single nitrogen molecule to to- tally 120 and 38 active, respectively. In this spectrum, all excitations specific for the spectrum of the single nitro- gen molecule cannot be recognized. The 1→52, 1→53, 1→57, 1→77 and 1→121 transitions resembling these in the spectrum of the single nitrogen molecule in their position and intensity have more complex structure. In this spectrum, two longest wavelength transitions are less intensive than relevant transitions in the spectrum of the single molecule but three shorter wavelength transi- tions are more intensive than the corresponding transi- tions in the spectrum of the single molecule. In the sys- tem of two nitrogen molecules the total energy of the system is lower than doubled energy of the single nitro- gen molecule. The energy of stabilization due to inter- molecular interactions of two nitrogen molecules is 0.008076807 a.u. The system of five nitrogen molecules provides stabilization energy of 0.173319988 a.u. Thus, the electric field providing stabilization of the system increases with the number of interacting molecules. In the bimolecular nitrogen system under the influ- ence of the 0.01 a.u. electric field also the stabilization resulting from the intermolecular interactions is noted. This stabilization by 0.082799838 a.u. is stronger than in corresponding monomolecular system However, in the pentamolecular nitrogen system under the influence of the same electric field the stabilization energy is lower and reaches 0.072913550 a.u. Thus, in contrast to elec- tric field non-perturbed systems an increase in the num- ber of interacting molecules of nitrogen decreases the energy of stabilization. Figure 1 presents mapping of isosurface of the nitro- gen molecule prior (left) and after (right) exposure to the electric field of 0.01 a.u. In electric field perturbed molecule a negative charge concentrates on both nitro- gen atom increasing from 0.000 in non-perturbed mole- cule to -0.048 in the molecule in the electric field. Figure 2 presents optimized natural and 0.01 a.u. electric field induced orientation of two and five nitro- gen molecules. Two nitrogen molecules without any influence of the electric field remain practically nonpolarized and are fairly arbitrarily mutually oriented. Under the influence of the electric field they turn polarized and their bipolar character induces certain charge density dependent mu- tual orientation. Under the absence of the external elec- tric field, very slightly polarized five nitrogen molecules form practically disordered system whereas the electric field polarized the molecules and the polarization for particular molecules is different from one another as the effect of their own field. Mutual orientation of these molecules is clearly controlled by charge density inter- actions. The oxygen molecule considered as biradical provides 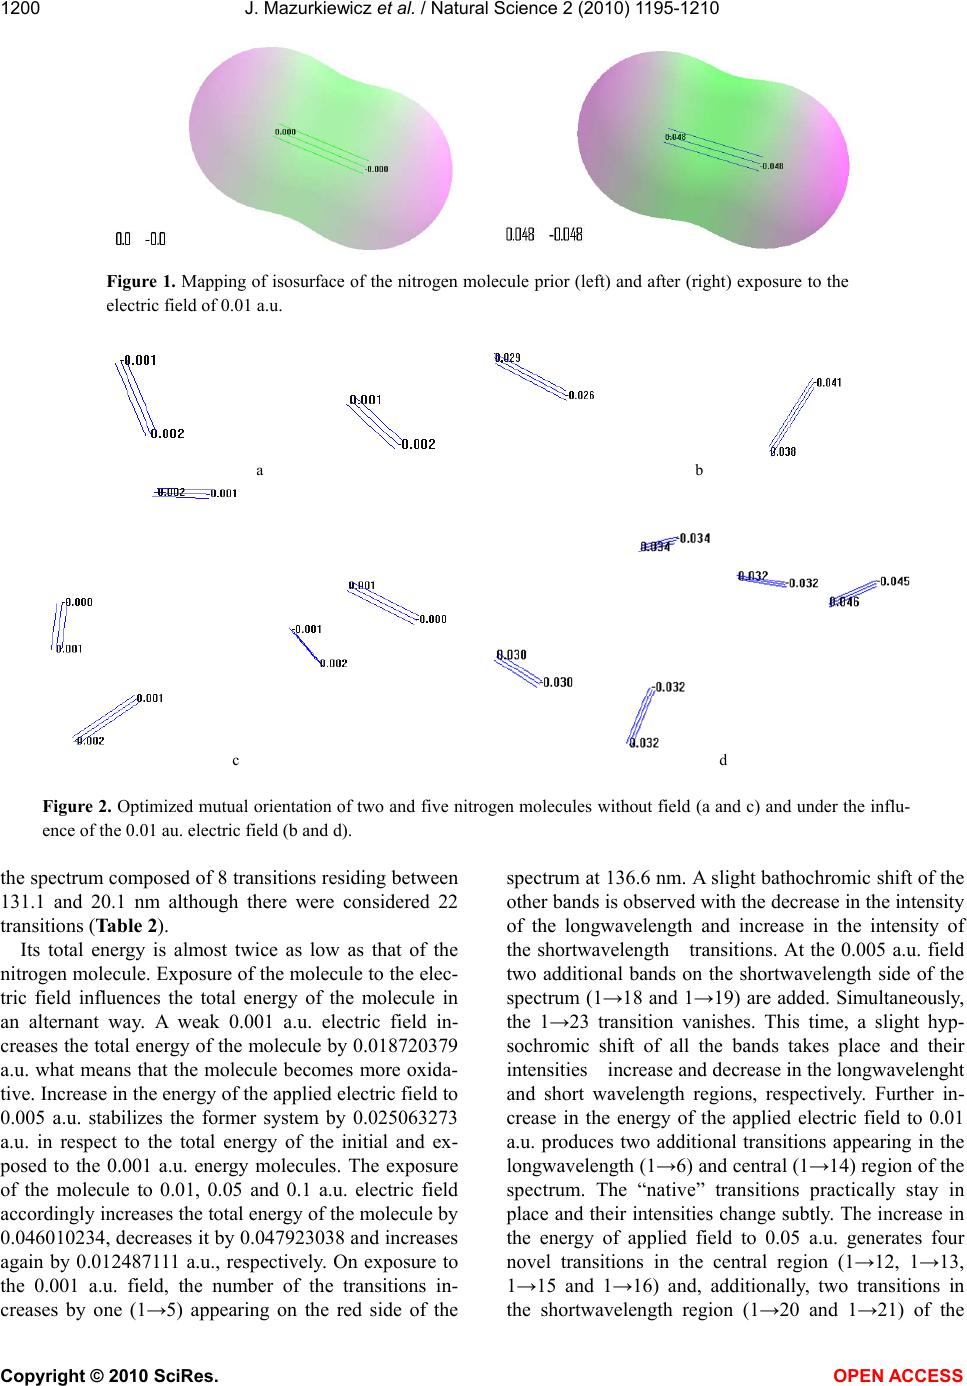 J. Mazurkiewicz et al. / Natural Science 2 (2010) 1195-1210 Copyright © 2010 SciRes. OPEN ACCESS 1200 Figure 1. Mapping of isosurface of the nitrogen molecule prior (left) and after (right) exposure to the electric field of 0.01 a.u. a b c d Figure 2. Optimized mutual orientation of two and five nitrogen molecules without field (a and c) and under the influ- ence of the 0.01 au. electric field (b and d). the spectrum composed of 8 transitions residing between 131.1 and 20.1 nm although there were considered 22 transitions (Table 2). Its total energy is almost twice as low as that of the nitrogen molecule. Exposure of the molecule to the elec- tric field influences the total energy of the molecule in an alternant way. A weak 0.001 a.u. electric field in- creases the total energy of the molecule by 0.018720379 a.u. what means that the molecule becomes more oxida- tive. Increase in the energy of the applied electric field to 0.005 a.u. stabilizes the former system by 0.025063273 a.u. in respect to the total energy of the initial and ex- posed to the 0.001 a.u. energy molecules. The exposure of the molecule to 0.01, 0.05 and 0.1 a.u. electric field accordingly increases the total energy of the molecule by 0.046010234, decreases it by 0.047923038 and increases again by 0.012487111 a.u., respectively. On exposure to the 0.001 a.u. field, the number of the transitions in- creases by one (1→5) appearing on the red side of the spectrum at 136.6 nm. A slight bathochromic shift of the other bands is observed with the decrease in the intensity of the longwavelength and increase in the intensity of the shortwavelength transitions. At the 0.005 a.u. field two additional bands on the shortwavelength side of the spectrum (1→18 and 1→19) are added. Simultaneously, the 1→23 transition vanishes. This time, a slight hyp- sochromic shift of all the bands takes place and their intensities increase and decrease in the longwavelenght and short wavelength regions, respectively. Further in- crease in the energy of the applied electric field to 0.01 a.u. produces two additional transitions appearing in the longwavelength (1→6) and central (1→14) region of the spectrum. The “native” transitions practically stay in place and their intensities change subtly. The increase in the energy of applied field to 0.05 a.u. generates four novel transitions in the central region (1→12, 1→13, 1→15 and 1→16) and, additionally, two transitions in the shortwavelength region (1→20 and 1→21) of the 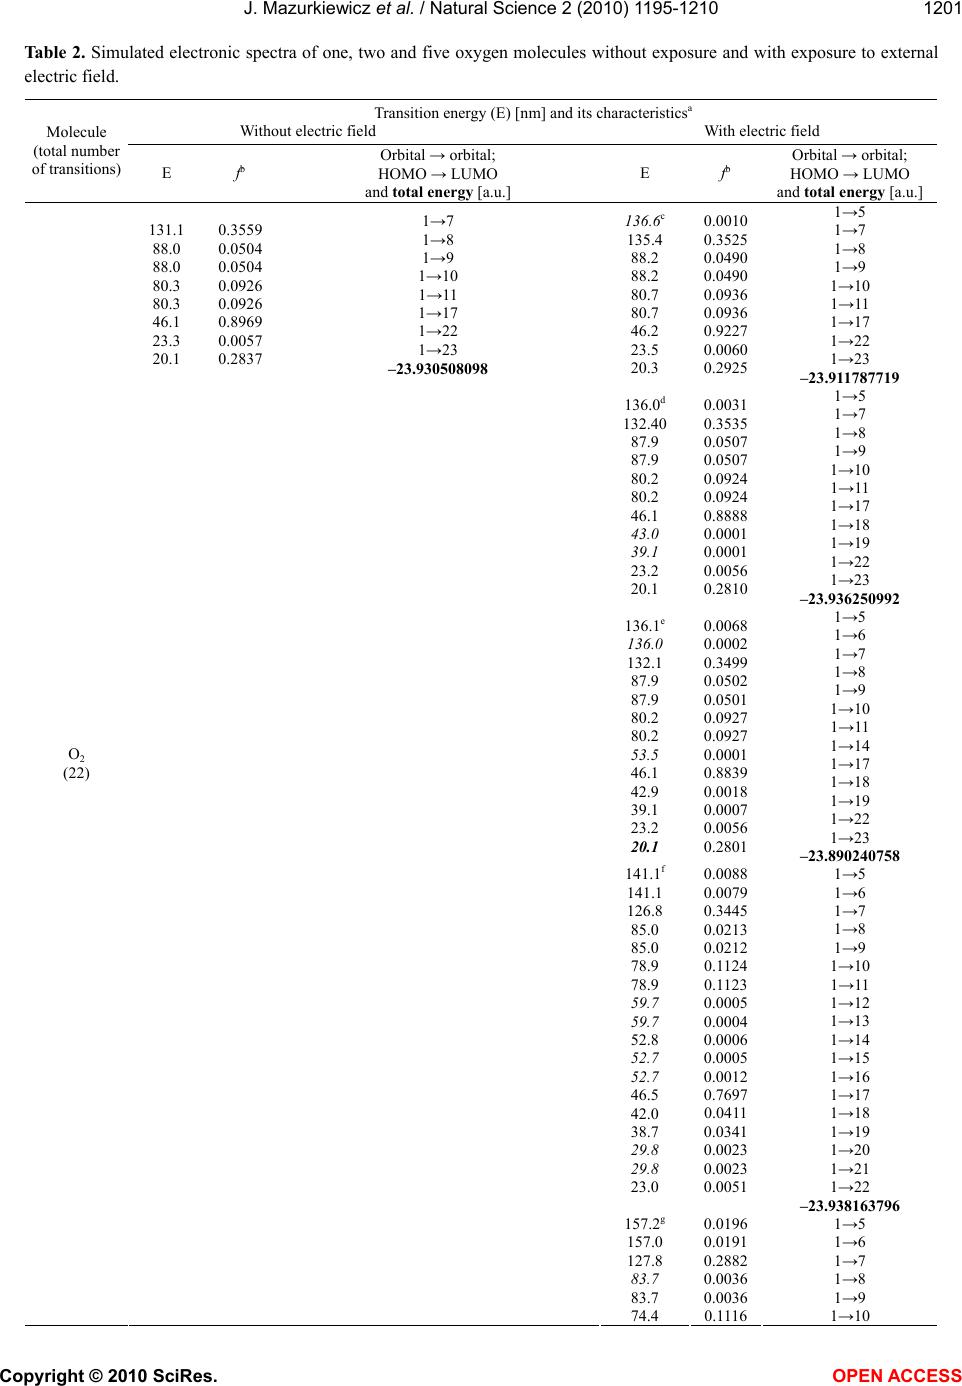 J. Mazurkiewicz et al. / Natural Science 2 (2010) 1195-1210 Copyright © 2010 SciRes. OPEN ACCESS 1201 Table 2. Simulated electronic spectra of one, two and five oxygen molecules without exposure and with exposure to external electric field. Transition energy (E) [nm] and its characteristicsa Without electric field With electric field Molecule (total number of transitions) E fb Orbital → orbital; HOMO → LUMO and total energy [a.u.] E fb Orbital → orbital; HOMO → LUMO and total energy [a.u.] 131.1 88.0 88.0 80.3 80.3 46.1 23.3 20.1 0.3559 0.0504 0.0504 0.0926 0.0926 0.8969 0.0057 0.2837 1→7 1→8 1→9 1→10 1→11 1→17 1→22 1→23 –23.930508098 136.6c 135.4 88.2 88.2 80.7 80.7 46.2 23.5 20.3 0.0010 0.3525 0.0490 0.0490 0.0936 0.0936 0.9227 0.0060 0.2925 1→5 1→7 1→8 1→9 1→10 1→11 1→17 1→22 1→23 –23.911787719 136.0d 132.40 87.9 87.9 80.2 80.2 46.1 43.0 39.1 23.2 20.1 0.0031 0.3535 0.0507 0.0507 0.0924 0.0924 0.8888 0.0001 0.0001 0.0056 0.2810 1→5 1→7 1→8 1→9 1→10 1→11 1→17 1→18 1→19 1→22 1→23 –23.936250992 136.1e 136.0 132.1 87.9 87.9 80.2 80.2 53.5 46.1 42.9 39.1 23.2 20.1 0.0068 0.0002 0.3499 0.0502 0.0501 0.0927 0.0927 0.0001 0.8839 0.0018 0.0007 0.0056 0.2801 1→5 1→6 1→7 1→8 1→9 1→10 1→11 1→14 1→17 1→18 1→19 1→22 1→23 –23.890240758 141.1f 141.1 126.8 85.0 85.0 78.9 78.9 59.7 59.7 52.8 52.7 52.7 46.5 42.0 38.7 29.8 29.8 23.0 0.0088 0.0079 0.3445 0.0213 0.0212 0.1124 0.1123 0.0005 0.0004 0.0006 0.0005 0.0012 0.7697 0.0411 0.0341 0.0023 0.0023 0.0051 1→5 1→6 1→7 1→8 1→9 1→10 1→11 1→12 1→13 1→14 1→15 1→16 1→17 1→18 1→19 1→20 1→21 1→22 –23.938163796 O2 (22) 157.2g 157.0 127.8 83.7 83.7 74.4 0.0196 0.0191 0.2882 0.0036 0.0036 0.1116 1→5 1→6 1→7 1→8 1→9 1→10 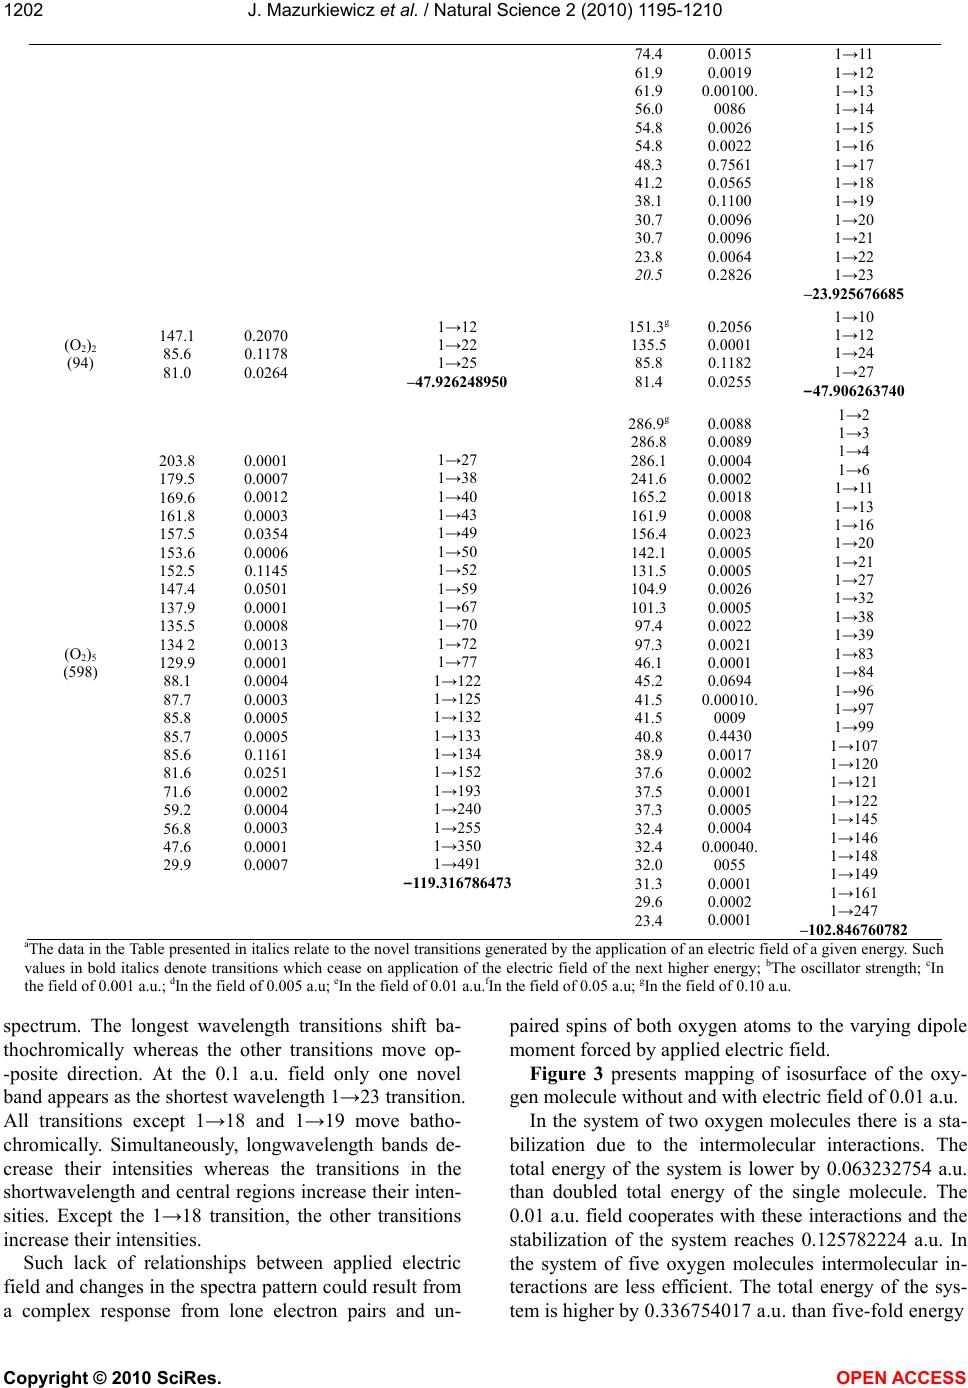 J. Mazurkiewicz et al. / Natural Science 2 (2010) 1195-1210 Copyright © 2010 SciRes. OPEN ACCESS 1202 74.4 61.9 61.9 56.0 54.8 54.8 48.3 41.2 38.1 30.7 30.7 23.8 20.5 0.0015 0.0019 0.00100. 0086 0.0026 0.0022 0.7561 0.0565 0.1100 0.0096 0.0096 0.0064 0.2826 1→11 1→12 1→13 1→14 1→15 1→16 1→17 1→18 1→19 1→20 1→21 1→22 1→23 –23.925676685 (O2)2 (94) 147.1 85.6 81.0 0.2070 0.1178 0.0264 1→12 1→22 1→25 –47.926248950 151.3g 135.5 85.8 81.4 0.2056 0.0001 0.1182 0.0255 1→10 1→12 1→24 1→27 –47.906263740 (O2)5 (598) 203.8 179.5 169.6 161.8 157.5 153.6 152.5 147.4 137.9 135.5 134 2 129.9 88.1 87.7 85.8 85.7 85.6 81.6 71.6 59.2 56.8 47.6 29.9 0.0001 0.0007 0.0012 0.0003 0.0354 0.0006 0.1145 0.0501 0.0001 0.0008 0.0013 0.0001 0.0004 0.0003 0.0005 0.0005 0.1161 0.0251 0.0002 0.0004 0.0003 0.0001 0.0007 1→27 1→38 1→40 1→43 1→49 1→50 1→52 1→59 1→67 1→70 1→72 1→77 1→122 1→125 1→132 1→133 1→134 1→152 1→193 1→240 1→255 1→350 1→491 –119.316786473 286.9g 286.8 286.1 241.6 165.2 161.9 156.4 142.1 131.5 104.9 101.3 97.4 97.3 46.1 45.2 41.5 41.5 40.8 38.9 37.6 37.5 37.3 32.4 32.4 32.0 31.3 29.6 23.4 0.0088 0.0089 0.0004 0.0002 0.0018 0.0008 0.0023 0.0005 0.0005 0.0026 0.0005 0.0022 0.0021 0.0001 0.0694 0.00010. 0009 0.4430 0.0017 0.0002 0.0001 0.0005 0.0004 0.00040. 0055 0.0001 0.0002 0.0001 1→2 1→3 1→4 1→6 1→11 1→13 1→16 1→20 1→21 1→27 1→32 1→38 1→39 1→83 1→84 1→96 1→97 1→99 1→107 1→120 1→121 1→122 1→145 1→146 1→148 1→149 1→161 1→247 –102.846760782 aThe data in the Table presented in italics relate to the novel transitions generated by the application of an electric field of a given energy. Such values in bold italics denote transitions which cease on application of the electric field of the next higher energy; bThe oscillator strength; cIn the field of 0.001 a.u.; dIn the field of 0.005 a.u; eIn the field of 0.01 a.u.fIn the field of 0.05 a.u; gIn the field of 0.10 a.u. spectrum. The longest wavelength transitions shift ba- thochromically whereas the other transitions move op- -posite direction. At the 0.1 a.u. field only one novel band appears as the shortest wavelength 1→23 transition. All transitions except 1→18 and 1→19 move batho- chromically. Simultaneously, longwavelength bands de- crease their intensities whereas the transitions in the shortwavelength and central regions increase their inten- sities. Except the 1→18 transition, the other transitions increase their intensities. Such lack of relationships between applied electric field and changes in the spectra pattern could result from a complex response from lone electron pairs and un- paired spins of both oxygen atoms to the varying dipole moment forced by applied electric field. Figure 3 presents mapping of isosurface of the oxy- gen molecule without and with electric field of 0.01 a.u. In the system of two oxygen molecules there is a sta- bilization due to the intermolecular interactions. The total energy of the system is lower by 0.063232754 a.u. than doubled total energy of the single molecule. The 0.01 a.u. field cooperates with these interactions and the stabilization of the system reaches 0.125782224 a.u. In the system of five oxygen molecules intermolecular in- teractions are less efficient. The total energy of the sys- tem is higher by 0.336754017 a.u. than five-fold energy  J. Mazurkiewicz et al. / Natural Science 2 (2010) 1195-1210 Copyright © 2010 SciRes. OPEN ACCESS 1203 Figure 3. Mapping of isosurface of the oxygen molecule without electric field (left) and at 0.01 a.u. electric field (right). of the single molecule. The 0.1 a.u. electric field intro- duces dramatic destabilization of the system. The cor- res-ponding energy of destabilization is -16.604443008 a.u pointing to a highly oxidative ability of such system. The field-perturbed oxygen molecules are clearly po- lar and, therefore, they form the charge density regulated system. In the system of five molecules their polariza- tion entirely ceases and their orientation is rather arbi- trary. The application of the electric field recovers the polarization of the molecules which influences certain mutual orientation of those molecules. Figure 4. presents optimized orientation of two and five oxygen molecules without intervention of electric field and in the 0.01 a.u. electric field. The simulation provided the UV spectrum of a single water molecule consisting of 7 transitions, all with f >> 0.0000 (Table 3). Nine other transitions are inactive (f = 0.0000). Application of the electric field of 0.01 a.u. modifies the spectral pattern of unperturbed molecule on the red side. Novel transitions appear at 100.1 and 91.8 nm and one transition in original, unperturbed spectrum located at 90.9 nm ceases. The transitions shift slightly towards blue and their intensities vary irregularly. Figure 5 presents the mapping of the isosurface of in- dividual water molecules without and with the influence of electric field of 0.01 a.u. The electric field concentrates the negative charge on the oxygen atom. The negative charge declines from -0.383 to -0.414 and, in the same time, the positive charge increased from 0.191 to 0.207. Thus, water molecule becomes more acidic and more prone to form dimers, trimers and so on. Such behavior can be respon- sible for several peculiar, poorly understood properties of water [27]. This result can be responsible for stabili- zation of the molecule in the 0.01 a.u. field by 0.019448846 a.u. In the spectrum of the system of 5 water molecules totally 400 transitions in the UV region are considered and among them only 199 transitions are characterized by f > 0.0000. (Table 3). The transitions are situated in the region from 111.3 to 27 nm. The five fold increase of (a) (b) (c) (d) Figure 4. Optimized orientation of two and five oxygen molecules without intervention of electric field (a and c) and in the 0.01 a.u. electric field (b and d).  J. Mazurkiewicz et al. / Natural Science 2 (2010) 1195-1210 Copyright © 2010 SciRes. OPEN ACCESS 1204 Figure 5. Mapping of isosurface of the water molecule prior (left) and after (right) expo- sure to the electric field of 0.01 a.u. Table 3. Simulated electronic spectra of one and five water molecules without exposure and with exposure to 0.01 a.u. external electric field. Transition energy (E) [nm] and its characteristicsa Without electric field With electric field Molecule (total number of transitions) E fb Orbital → orbital HOMO → LUMO and total energy [a.u.] E fb Orbital → orbital HOMO → LUMO and total energy [a.u.] H2O (16) 111.3 90.9 84.3 64.5 56.1 29.6 29.0 0.0329 0.0106 0.1866 0.2536 0.3382 0.0909 0.1760 1→3; 4→5 1→8; 3→5 1→9; 3→6 1→12; 2→5 1→13; 2→6 1→16; 1→5 1→17; 1→6 –13.581465020 110.9 100.1 91.8 83.0 62.9 54.4 29.8 28.7 0.0317 0.0034 0.0140 0.1729 0.2860 0.2969 0.0787 0.1817 1→3; 4→5 1→6; 4→6 1→7; 3→5 1→9; 3→6 1→12; 2→5 1→13; 2→6 1→16; 1→5 1→17; 1→6 –13.600913866 (H2O)5c (400) 91.3 85.7 84.9 84.4 84.1 83.9 83.1 83.1 66.2 65.1 63.8 63.4 62.8 58.4 58.1 57.3 57.1 56.3 55.8 54.9 54.6 54.3 30.1 30.0 29.7 29.6 29.5 29.0 29.0 28.8 0.0574 0.1692 0.1205 0.2383 0.0951 0.1172 0.0607 0.1003 0.1030 0.2198 0.0922 0.1638 0.2308 0.0934 0.1485 0.1396 0.0900 0.4467 0.0622 0.0796 0.0880 0.0519 0.0936 0.1125 0.1123 0.0685 0.1576 0.1042 0.1683 0.0947 1→33; none 1→37; 13→26,11→26 1→40; 15→30 1→43; 13→27,11→27 1→45; 19→21 1→46; 12→28 1→50; none 1→51; 16→21 1→181; 10→21 1→191; 9→22 1→199; none 1→204; 13→29 1→208; 8→23 1→219; 10→22,10→26 1→221; 10→22,10→26 1→226; 9→27,7→21 1→228; 7→21 1→233; 10→28 1→238; 10→29 1→247; 8→25 1→250; none 1→255; 6→24 1→313; 4→21, 4→23 1→314; 5→22 1→316; 5→26 1→317; none 1→319; 5→27 1→329; 3→28 1→331; 4→24 1→336; none –67.963599996 110.6 94.5 87.4 86.8 86.6 85.6 84.7 81.8 68.3 65.8 64.6 62.3 62.1 61.8 55.8 55.7 55.7 55.4 55.2 54.6 54.2 53.8 30.3 29.9 29.6 29.6 29.6 28.4 27.8 27.3 0.0510 0.0800 0.1169 0.0950 0.0765 0.1341 0.1493 0.0939 0.0540 0.0775 0.0545 0.1045 0.5283 0.2575 0.5738 0.0652 0.0967 0.0909 0.0635 0.0721 0.0558 0.1820 0.0584 0.0767 0.1206 0.0849 0.1848 0.0722 0.0681 0.0518 1→9; none 1→29; none 1→43; 20→28 1→46; 18→21 1→47; 17→29 1→50; 14→26,13→26 1→52; 17→30 1→59; 11→27 1→156; 12→25 1→172; none 1→179; none 1→198; 11→22,11→23 1→199; 6→21 1→202; 7→23,7→24 1→231, 7→27 1→233; 10→29 1→234; 8→24 1→234; 10→26 1→239; 10→28 1→246; 11→30,10→30 1→252; none 1→254; 6→26 1→319; 4→21,4→22 1→323; 5→29 1→327; 5→26 1→328; 4→24,4→25 1→329; 5→30 1→350; 5→26,3→26 1→358; 3→27,2→27 1→368; 3→27,2→27 –68.055033213 the water molecules makes the system more stable by 0.056274896 a.u. The electric field of. 0.01 a.u. reduces the number of active transitions with f > 0.0000 from 217 to 214. Applied field makes the structure of particu-  J. Mazurkiewicz et al. / Natural Science 2 (2010) 1195-1210 Copyright © 2010 SciRes. OPEN ACCESS 1205 lar transitions entirely different from these in the field-unperturbed spectrum. Application of the 0.01 a,.u. field stabilizes the system of five water molecules in respect to that without influence of the field. The stabi- lization energy reaches relatively high value of 1.091433217 a.u. The stabilization can result from the facilitation of the formation of intermolecular hydrogen bonds. The simulated UV spectrum of carbon dioxide con- sists of totally 64 transitions among whose 26 are active (f > 0.0000) (Table 4). Based on the comparison of the wavelengths and in- tensities of computed transitions, the application of the 0.01 a.u. field eliminates from the spectrum of unper- turbed molecule weak transition at 222.1, changes the structure of the 1→14 transition and adds another weak transitions 1→17, 1→20, 1→44 and 1→55. Comparable transitions in unperturbed and field-perturbed spectra shift irregularly towards blue and red and also their in- tensities vary irregularly. Applied 0.01 a.u. field destabi- lized the molecule by 0.018192592 a.u. Figure 6 presents changes of the electron density in the carbon dioxide molecule prior to and after applica- tion of the field of 0.01 a.u. That Figure shows that after application of the electric field of 0.01 a.u. negative charge non-equivalently con- centrates on the oxygen atoms whereas positive charge on the carbon atom changes negligibly. The destabiliza- tion can result from the effect of the field upon interac- tions with involvement of induced dipoles. Simulation of the system of two CO2 molecules analyzed totally 256 transitions among which 86 are active with f > 0.0000. The bimolecular system of CO2 is less stable by 0.007099722 a.u. Likely this destabilization results from repulsion of the molecules. The 0.01 a.u. field increases the repulsion. The spectrum of the CO2 – H2O system illustrates the state of the well known equilibrium between carbonic acid and its components. As indicated by the total energy of the systems, the 0.01 a.u. field causes destabilization increasing total energy by 0.015102407 a.u. That field entirely changes the spectrum. Except the shortest wavelength 1→145 transition, corresponding transitions which can be recognized in both spectra have different HOMO-LUMO characteristics (Table 4). The simulation of the UVVIS spectrum of the unper- turbed and field perturbed ammonia molecule provids totally 24 transitions among whose only 12 transitions in both cases are active (Table 5). This difference appears in the structure of the transi- Table 4. Simulated electronic spectra of one and two carbon dioxide molecules as well as carbon dioxide – water 1:1 system with- out exposure and with exposure to 0.01 a.u. external electric field. Transition energy (E) [nm] and its characteristicsa Without electric field With electric field Molecule (total number of transi- tions) E fb Orbital → orbital HOMO → LUMO and total energy [a.u.] E fb Orbital → orbital HOMO → LUMO and total energy [a.u.] CO2 (64) 222.1 142.2 138.3 131.8 131.6 130.8 120.3 101.3 97.7 94.9 91.8 91.5 77.2 69.5 61.8 61.7 52.2 48.4 45.6 35.2 33.3 33.2 30.3 29.2 23.8 23.3 0.0004 0.3564 0.0001 0.0014 0.0013 0.2958 0.2605 0.0362 0.1308 0.1582 0.0609 0.0110 1.3488 0.0012 0.0610 0.0618 0.0008 0.0062 0.1242 0.0021 0.0368 0.0406 0.2102 0.0022 0.0060 0.3157 1→7; 8→9,7→10 1→14; 8→9,8→11,7→10 1→15; 6→9,5→10 1→18; 6→10,5→9 1→19; 6→9,5→10 1→21; 8→11 ,4→9 1→24; 4→9 1→29; 3→9 1→30; 3→10 1→31; 3→9 1→33; 6→11 1→34; 5→11 1→36; 4→11 1→37; 3→11 1→40; 8→12 1→41; 7→12 1→45; 5→12 1→47; 4→12 1→49; 3→12 1→52; 2→9 1→57; 1→9 1→58; 1→10 1→60; 2→11 1→61; 1→11 1→64; 2→12 1→65; 1→12 140.8 138.8 133.1 132.7 132.7 122.3 121.9 99.7 97.9 96.3 93.4 93.4 77.5 69.8 61.9 61.8 52.5 52.4 48.4 45.6 35.2 35.2 33.4 33.4 30.4 29.5 0.1730 0.0001 0.6290 0.0059 0.0091 0.0032 0.0705 0.0325 0.1030 0.0906 0.0743 0.0858 1.3979 0.0092 0.0605 0.0606 0.0002 0.0003 0.0085 0.1209 0.0007 0.0002 0.0397 0.0406 0.2180 0.0030 1→14; 8→11 1→17; 7→11 1→18; 8→9, 8→11,7→10 1→19; 6→10,5→9 1→20; 6→9 1→23; 4→10 1→24; 4→9 1→29; 3→9 1→30; 3→10 1→31; 3→9 1→33; 6→11 1→34; 5→11 1→36; 4→11 1→37; 3→11 1→40; 8→12 1→41; 7→12 1→44; 6→12 1→45; 5→12 1→47; 4→12 1→49; 3→12 1→53; 2→9 1→55; 2→10 1→57; 1→9 1→58; 1→10 1→60; 2→11 1→61; 1→11  J. Mazurkiewicz et al. / Natural Science 2 (2010) 1195-1210 Copyright © 2010 SciRes. OPEN ACCESS 1206 –29.238512694 23.8 23.4 0.0006 0.3206 1→64; 2→12 1→65; 1→12 –29.220320102 (CO2)2c (256) 134.6 133.9 132.9 98.5 98.3 98.0 98.0 96.4 93.0 92.9 92.8 92.6 77.6 77.5 61.7 61.7 61.7 45.6 45.6 33.3 33.3 30.4 23.4 0.0688 0.6023 0.9910 0.0585 0.0924 0.1127 0.1165 0.0520 0.0723 0.0772 0.0611 0.0659 2.5980 0.1587 0.1185 0.0574 0.0661 0.1312 0.1142 0.0772 0.0755 0.4096 0,5414 1→34; 16→17 1→35; 16→20 1→38; 13→17 1→72; 6→20 1→73; 5→17 1→74; 5→18 1→75; 6→19 1→82; 16→22,13→22 1→88; 10→21 1→89; 11→22 1→90; 12→21,9→21 1→91; 12→22,9→22 1→118; 8→22,7→21 1→119; 8→22 1→150; 16→23,13→24 1→152; 15→24 1→153; 14→23 1→176; 5→23 1→177; 6→24 1→209; 2→18,1→18 1→211; 2→20,1→17 1→230; 4→21,3→22 1→248; 2→23,1→24 –58.470925666 140.9 140.6 134.1 132.6 121.9 98.1 97.6 95.8 94.0 93.9 93.0 77.6 77.5 61.9 61.9 61.8 61.8 45.5 45.5 30.5 30.4 23.5 23.4 0.2113 0.0587 0.8054 0.5640 0.0994 0.0870 0.1054 0.1055 0.1002 0.1033 0.0832 1.6660 1.1105 0.0603 0.0610 0.06910 .0603 0.1249 0 .1115 0.2172 0.2118 0.3406 0.2747 1→34; 14→21 1→35; 16→22 1→42; 16→19,15→20 1→45; 14→17,14→21,13→18 1→55; 7→17 1→86; 6→20 1→87; 5→18 1→93; 3→17 1→96; 12→22;11→22,6→19 1→97; 12→22,11→22,6→20 1→99; 9→21 1→126; 10→22 1→127; 7→21 1→148; 16→24 1→149; 15→24 1→150; 14→23 1→151; 13→23 1→182; 6→24 1→183; 5→23 1→226; 4→22 1→227; 2→21 1→250; 3→24 1→251; 1→23 –58.434944686 CO2+H2O (144) 138.8 132.9 96.4 95.8 92.6 92.4 91.0 86.6 84.3 76.7 65.6 63.1 61.7 61.7 56.9 55.5 45.2 30.1 29.3 28.8 23.3 0.0772 0.7053 0.0840 0.0772 0.1133 0.0866 0.0901 0.1552 0.1701 1.1481 0.0577 01478 0.0511 0.0858 0.0663 0.2342 0.0938 0.1839 0.0502 0.1674 0.3009 1→14; 12→13,10→15 1→24; 11→14,10→13 1→46; 4→14 1→47; 4→13 1→49; 8→15,7→15 1→50; 8→15,7→15 1→51; 9→15,9→16 1→53; 9→15,9→16 1→54; 9→17 1→64; 6→15 1→72; 5→15 1→76; 5→15,5→16 1→77; 11→18,10→18 1→78; 11→18,10→18 1→85; 8→17 1→91; 5→17 1→107; 4→18 1→128; 2→15 1→129; 3→16 1→131; 3→17 1→145; 1→18 –42.851775857 138.6 129.9 121.5 100.7 99.1 89.8 84.2 78.4 74.0 65.4 61.3 61.3 56.8 46.1 30.1 29.5 29.4 23.1 0.3129 0.0001 0.2548 0.0623 0.0971 0.0798 0.1528 1.1594 0.1325 0.2515 0.0632 0.0629 0.3200 0.0782 0.2431 0.0606 0.0950 0.2562 1→14; 12→15,11→14 1→21; 12→15 1→25; 6→13 1→36; 9→13,5→13 1→50; 9→14,5→14 1→53; 8→15,7→15,5→14 1→55; 9→17 1→62; 9→15,6→15 1→64; 9→15,6→15 1→78; 4→16 1→87; 12→18 1→88; 11→18 1→93; 4→17 1→105; 9→18,5→18 1→127; 3→16,2→15 1→128; 3→15,3→17,2→15 1→129; 3→17 1→145; 1→18 –42.836673450 aThe data in the Table presented in italics relate to the novel transitions generated by the application of an electric field of a given energy. Such val- ues in bold italics denote transitions which cease on application of the electric field of the next higher energy; bThe oscillator strength; cIn this Table only transitions of f ≥0.0500 are given. The total number of the transitions with; f > 0.0000 is 86 and 82 in the spectra of one and two carbon diox- ide without and with electric field, respectively. In the carbon dioxide – water system the relevant numbers are 67 and 68, respectively. Values of E [nm] given in italics denote novel transitions generated on the application of electric field. Values in bold italics denote transitions which will cease on application of more intensive electric field. Table 5. Simulated electronic spectra of single molecule of ammonia without exposure and with exposure to 0.01 a.u. external electric field and analogous computations for the ammonia-water system. Transition energy (E) [nm] and its characteristics Without electric field With electric field Molecule (total number of transitions) E fa Orbital → orbital HOMO → LUMO and total energy [a.u.] E fa Orbital → orbital HOMO → LUMO and total energy [a.u.] NH3 (24) 123.3 111.7 106.0 71.2 0.0270 0.0532 0.0643 0.0112 1→3; 4→5 1→6; 4→6 1→7; 4→7 1→11; 3→5 120.9 109.9 105.9 71.2 0.0191 0.0682 0.0738 0.0189 1→3; 4→5 1→6; 4→6 1→7; 4→7 1→11; 3→5  J. Mazurkiewicz et al. / Natural Science 2 (2010) 1195-1210 Copyright © 2010 SciRes. OPEN ACCESS 1207 67.6 65.9 62.9 62.0 54.5 32.5 31.6 31.1 0.0050 0.0107 0.4495 0.4795 0.1984 0.0196 0.1124 0.1380 1→14; 2→5 1→15; 3→7,2→6 1→17; 3→6,2→7 1→18; 3→7,2→6 1→19; 3→6,2→7 1→23; 1→5 1→24; 1→6 1→25; 1→7 –10.944414844 69.7 67.5 63.9 63.5 55.7 32.8 32.1 31.7 0.0030 0.0012 0.4548 0.4811 0.2366 0.0278 0.1187 0.1347 1→14; 2→5 1→15; 3→7,2→6 1→17, 3→6,3→7,2→6 1→18; 3→6,2→6 1→19; 3→2,2→7 1→23; 1→5 1→24; 1→6 1→25; 1→7 –10.905433106 NH3 + H2O (80) 128.3 110.8 109.6 109.3 103.1 89.6 88.8 83.5 83.3 80.3 73.7 71.7 69.5 69.0 66.9 64.4 64.3 63.7 62.0 60.1 59.9 58.2 57.4 56.3 56.1 54.3 53.5 52.5 51.6 50.4 33.1 31.4 31.2 31.0 30.0 29.2 28.6 28.6 27.1 26.8 0.0520 0.0300 0.0300 0.0342 0.0019 0.0149 0.0026 0.1751 0.0094 0.0034 0.0061 0.0082 0.0025 0.0108 0.0268 0.1634 0.0589 0.0410 0.0178 0.4280 0.5103 0.0107 0.0024 0.3176 0.0012 0.0241 0.1057 0.0002 0.0044 0.0011 0.0069 0.1313 0.1521 0.0003 0.0150 0.0866 0.0164 0.1480 0.0019 0.0003 1→3; 8→9 1→7; 8→12 1→8; 7→10 1→9; 8→13 1→11; 7→11 1→14; 8→10,6→10 1→16; 8→10,6→10 1→18; 6→11 1→19; 7→9 1→21; 8→11 1→25; 6→9 1→28; 7→12 1→31; 7→13 1→33; 5→9 1→34; 4→9 1→37; 6→12,3→10 1→38; 6→12,3→10 1→40; 6→13,5→13,4→12 1→42; 6→13,4→12 1→44; 5→12,4→13 1→45; 5→13,4→12 1→47; 5→10 1→49; 3→9 1→50; 5→11,3→11 1→52; 4→10 1→54; 5→11 ,3→11 1→55; 5→12,4→13 1→57; 4→11 1→59; 3→12 1→61; 3→13 1→65; 2→9 1→67; 2→12 1→69; 2→13 1→70; 2→10 1→72; 2→11 1→74; 1→10 1→76; 1→9 1→77; 1→11 1→79; 1→12 1→81; 1→13 –24.567018796 115.7 108.9 107.4 102.4 102.4 95.4 89.0 84.8 78.5 75.6 73.6 70.9 69.2 68.3 67.8 66.8 66.2 65.0 64.2 63.4 63.2 61.5 61.0 60.7 57.3 55.9 55.6 54.0 51.6 49.9 32.2 31.8 31.7 31.2 30.8 29.1 28.6 27.8 27.1 26.7 0.0063 0.0679 0.0316 0.0362 0.0588 0.0649 0.0593 0.0040 0.1286 0.0013 0.0027 0.0006 0.0197 0.0387 0.0005 0.0119 0.0073 0.3505 0.3906 0.2631 0.0268 0.0298 1.0054 0.0076 0.0394 0.4434 0.1134 0.0016 0.0042 0.0008 0.0137 0.0975 0.0475 0.1456 0.0080 0.0745 0.1713 0.0050 0.0034 0.0022 1→5; 8→10 1→7; 8→12 1→9; 7→9 1→10; 8→13,7→11 1→11; 8→13,7→11 1→13; 8→9 1→15; 8→11 ,6→11 1→17; 6→9 1→21; 8→11 ,6→11 1→23; 7→23 1→25; 5→10 1→28; 7→12 1→30; 5→13 1→33; 5→12. 4→10 1→35; 7→13 1→38; 6→10 1→39; 5→9 1→41; 5→12,4→10 1→42; 4→12 1→43; 3→9 1→45; 6→12 1→46; 3→11 1→49; 4→9 1→51; 6→13 1→52; 4→11 1→54; 3→11 1→55; 4→13 1→57; 3→10 1→59; 3→12 1→61; 3→13 1→66; 2→9,2→10 1→67; 2→12 1→68; 2→9,2→10 1→71; 2→13 1→72; 2→11 1→74; 1→9 1→75; 1→11 1→77; 1→10 1→79; 1→12 1→81; 1→13 –24.547055634 aThe oscillator strength Figure 6. Changes of the electron density in the carbon dioxide molecule prior to (left) and after applica- tion (right) of the field of 0.01 a.u.  J. Mazurkiewicz et al. / Natural Science 2 (2010) 1195-1210 Copyright © 2010 SciRes. OPEN ACCESS 1208 tions in the central part of the spectrum (transitions 1→17, 1→18 and 1→19). Applied electric field destabi- lizes the system. Energy of destabilization is 0.038981738 a.u. i.e. the total energy of the molecule in the field is higher than the total energy of field-unperturbed mole- cule. Figure 7 presents mapping of isosurface of the am- monia molecule in unperturbed state and after its expo- sure to the 0.01 a.u. electric field. Applied electric field concentrates the charge on the lone electron pair orbital of the nitrogen atom making ammonia a stronger base. Corresponding data showed that the negative charge on the nitrogen atom declined from –0.415 into -0.420. Totally 80 transitions were analyzed on simulation of the UVVIS spectrum of the ammonia-water system (Ta- ble 5). Forty of them appears active in the spectra with- out and with the field of 0.01 a.u. Because in the electric field water and ammonia turn into stronger acid and base, respectively, their mutual interactions introduce a com- plex spectral changes. Only in the most blue part of the spectrum these changes appear minute. The electric field of 0.01 a.u. destabilized also this sys- tem. The energy of destabilization reaching 0.019963162 a.u. is lower than that in single ammonia molecule placed in this field. Figure 8 presents mapping of isosurface of the am- monia – water system One can see that in that system out of the electric field the negative charge (–0.432) is more pronounced at the nitrogen atom of ammonia than at the oxygen atom of the partnering water molecule (–0.428). After the appli- cation of the 0.01 a.u. electric field, the negative charge is more concentrated at the water oxygen atom (–0.452) than at the ammonia nitrogen atom (-0.420). It provides an evidence that in the electric field enhanced acidic and basic properties of water and ammonia molecules, re- spectively, result in the acid-base interactions in which water is hydrogen donor and ammonia its acceptor. Thus, except CO2, all investigated single small mole- cules out of aura emit UV light in the area of the vacuum ultraviolet. In the spectrum of CO2 one weak transition appears at 221.1 in order to cease after application of the 0.01 a.u. electric field. In the system of two molecules checked for nitrogen the first transitions appear at 180.4 and 169.6 nm, however, they are very weak. The transi- Figure 7. Mapping of isosurface of the ammonia molecule in unperturbed state and after its exposure to the 0.01 a.u. electric field. Figure 8. Mapping of isosurface of the ammonia water molecules system in unperturbed state (two left images) and after its exposure (two right images) to the 0.01 a.u. electric field.  J. Mazurkiewicz et al. / Natural Science 2 (2010) 1195-1210 Copyright © 2010 SciRes. OPEN ACCESS 1209 tions of the intensity comparable to these in the spectrum of the single nitrogen molecule are met also at 100 nm. In the spectrum of two oxygen molecules the first inten- sive transition resides at the wavelength by 16 nm higher than in the spectrum of the single molecule. However, majority of the shorter wavelength transitions com- pletely ceases. The spectrum of two CO2 entirely differ from the spectrum of the single molecule. Anyway, the longest wavelength transitions disappears. Further in- crease in the number of molecules in the systems checked for N2, O2 and H2O provides diverse results. In the spectra of five nitrogen and five water molecules the longest wavelength transitions seen in their spectrum of two molecules are now absent. In contrast to them in the spectrum of five O2 molecules longwavelength transi- tions are added. The effect of the electric field and on a given mole- cule and their sets depends on the energy of the field and it is not linear in that energy. Moreover, that effect is specific for particular molecules. Only in the spectrum of (O2)5 the electric field of 0.01 a.u. can generate long- wavelength transitions beyond the vacuum ultraviolet region. Also in the spectrum of N2 in the field of 0.05 a.u. a weak transition at 202.2 nm can be seen. In no case emission in the visible region can be found. Since all transitions of the molecules under considera- tions situated in the electric field are observed in the vacuum ultraviolet region only spectrum of oxygen would be observed for genuine plasma containing all the molecules considered in this project. 4. CONCLUSIONS Electric field over surfaces of inanimate objects rather insignificantly change the electronic transitions in the molecules constituting aura (N2, O2, H2O, CO2 and NH3). All these molecules emit in the region of vacuum ultra- violet. Only a system of 5 oxygen molecules in the field of 0.01 a.u. exhibits weak transitions above 200 nm. REFERENCES [1] Ponne, C.T, and Bartels, P.V. (1995) Interaction of elec- tromagnetic energy with biological material, relation to food processing. Radiation Physics and Chemistry, 45 591-607. [2] Grosse, H.-H., Bauer E. and Berg H. (1988) Elec- trostimulation during fermentation. Bioelectrochem Bio- energetics, 20, 219-285. [3] Nakanishi, K., Tokuda, H., Soga, T., Yoshinaga, T. and Takeda, M. (1998) Effect of electric current on growth and alcohol production by yeast cells. Journal of Fermentation and Bioengineering, 85, 250-253. [4] Nechitailo, G. and Gordeev, A. (2001) Effect of artificial electric fields on plants grown under microgravity condi- tions. Advances in Space Research, 28, 629-631. [5] Goldman, M., Goldman, A. and Sigmond, R.S. (1985) The corona discharge, its properties and specific uses. Pure and Applied Chemistry, 57, 1353-1362. [6] van Veldhuizen, E.M. (1999) Electrical discharges for environmental purposes: Fundamentals and applications. Nova Science Publishers, New York. [7] Penney, G.W. and Hummert, G.T. (1970) Photoionization measurements in air, oxygen and nitrogen. Journal of Applied Physics, 41, 572-577. [8] Raether, H. (1939) The development of electron ava- lanche in a spark channel (from observations in a cloud chamber). Zeitschrift fur Physik, 112, 464-472. [9] van Veldhuizen, E.M., Baede, A.H.F.M., Hayashi, D. and Rutgers, W.R. (2001) Fast imaging of streamer propaga- tion. Proceedings of APP Spring Meeting, Bad Honnef, 2001, 231-234. [10] Starikovskaia, S.M., Starikovskii, A.Y. and Zatsepin, D.V. (1998) The development of a spatially uniform fast ioni- zation wave in a large discharge volume. Journal of Physics D: Applied Physics, 31, 1118-1125. [11] Mesyats, G.A., Bychkov, Y.I. and Kremnev, V.V. (1972) Pulsed nanosecond electric discharges in gases. Soviet Physics Uspekhi, 15, 282-297. [12] Creyghton, Y.L.M., van Veldhuizen, E.M. and Rutgers, W.R. (1993) Electrical and optical study of pulsed posi- tive corona. In: Penetrante, B.M. and Schultheis, S.E. Eds., Non-Thermal Plasmas for Pollution Control, NATO ASI Series, Subseries G, 34, p. 205. [13] Kondo, K. and Ikuta, N. (1980) Highly resolved observa- tion of the primary wave emission in atmospheric posi- tive-streamer corona. Journal of Physics D: Applied Physics, 13, L33. [14] Tochikubo, F. and Teich, T.H. (2000) Optical emission from a pulsed corona discharge and its associated reac- tions. Japanese Journal of Applied Physics, 39, 1343- 1350. [15] Lii, C.Y., Liao, G.D., Stobinski, L. and Tomasik, P. (2003) Effect of corona discharges on granular starches. Journal of Food Agriculture and Environment, 1, 143-149. [16] Liu, C.J. and Zou, J.J. (2004) Hydrolysis of starch cata- lyzed by dielectric barrier discharge plasma and definition of plasma acid. Chemical Abstracts Service, 142, 189-192 [17] Oohara, W., Nakahata, M. and Hatakeyama, R. (2006) Alkali-halogen plasma generation using alkali salt. Japanese Journal of Applied Physics, Part 1, 45, 8075- 8079. [18] Hong, Y.C. Shin, D.H. and Uhm, H.S. (2007) Su- per-hydrophobicity of multi-walled carbon nanotubes treated by a glow discharge. Surface and Coatings Tech- nology. 201, 5025-5029. [19] Oohara, W., Nakahata, M. and Hatakeyama, R. (2006), Alkali-halogen plasma generation by dc magnetron dis- charge. Applied Physics Letters, 88, 191501-191501-3. [20] Khare, B., Wilhite, P., Tran, B., Teixeira, E., Fresquez, K., Mvondo, D.N., Bauschlicher, C. and Meyyappan, M (2005) Functionalization of carbon nanotubes via nitro- gen glow discharge. The Journal of Physical Chemistry B, 109, 23466-23472. [21] Mazurkiewicz, J. and Tomasik, P. (1996) Perestroika effect, a novel example of electroviscosity. Bulletin of the Chemical Society Belges, 105, 173-180.  J. Mazurkiewicz et al. / Natural Science 2 (2010) 1195-1210 Copyright © 2010 SciRes. OPEN ACCESS 1210 [22] Keller-Rudek, H. and Moortget, G.K. (2010) MPI-Mainz- UV-VIS spectral atlas of gaseous molecules. http://www.atmosphere.mpg.de/enid/974q119a844eae7e6 b33851ca499,o/Spectral/Catalogue_Spectra_5p4.html [23] Vieitez, M.O., Ivanov, T.I., Ubachs, W., Lewis, B.R. and de Lange, C.A. (2008) On the complexity of the absorp- tion spectrum of molecular nitrogen. Journal of Molecu- lar Liquids, 141, 110-117. [24] Bernath, P.F. (2002) The spectroscopy of water vapour: Experiment, theory and applications. Physics Chemistry Chemical Physics, 4, 1501-1509. [25] Zerner, M.C. (1991) Reviews of computational chemistry. In: Lipkowitz, K.B. and Boyd, D.B. Eds., VCH Publish- ing, New York, 2, 313-366. [26] Brzozowski, K., Rodziewicz-Motowidło, S., Łęgowska, A. and Rolka, K. (2002) Conformational solution studies of selective agonist of NK-2 receptor - NAA, using NMR spectroscopy and global Monte Carlo analysis. Polish Journal Chemistry, 76, 807-814. [27] M. Chaplin (2010) Water structure and science, http:// www1.bbu.ac.uk/water/vibrat.html
|

