

Paper Menu >>
Journal Menu >>
 Open Journal of Respiratory Diseases, 2013, 3, 73-78 http://dx.doi.org/10.4236/ojrd.2013.32012 Published Online May 2013 (http://www.scirp.org/journal/ojrd) The Diagnostic and Prognostic Value of Serum Procalcitonin among Ventilator Associated Pneumonia Patients* Ashraf Abd El Halim1, Adel Attia1#, Taysser Zytoun2, Hosam Eldeen Salah3 1Chest Department, Faculty of Medicine, Zagazig University, Zagazig, Egypt 2Critical Care Department, Faculty of Medicine, Alexandria University, Alexandria, Egypt 3Clinical Pathology Department, Faculty of Medicine, Zagazig University, Zagazig, Egypt Email: #[email protected] Received April 2, 2013; revised May 3, 2013; accepted May 10, 2013 Copyright © 2013 Ashraf Abd El Halim et al. This is an open access article distributed under the Creative Commons Attribution License, which permits unrestricted use, distribution, and reproduction in any medium, provided the original work is properly cited. ABSTRACT Ventilator-associated pneumonia (VAP) is a complication in as many as 28% of patients who receive mechanical venti- lation. Studies have consistently shown that a delay in diagnosis and treatment increases the mortality risk. The aim of this work was to clarify the role of the serum procalcitonin (PCT) in the diagnosis and the prognosis of ventilator asso- ciated pneumonia. Methods: Forty two VAP patients, 20 non VAP-ICU (on mechanical ventilation) admitted patients and 20 healthy control subjects of similar age and sex were included in the study. PCT levels in serum samples were measured in all subjects. Results: There was a highly statistically significant difference (p value < 0.001) between VAP patients on one side and non VAP-ICU patients and healthy control subjects on the other side regarding the mean values of PCT. Also, the mean values of PCT were statistically significantly higher (p < 0.001) among died VAP group than the survivor VAP group. There was a statistically positive correlation (p < 0.01) between mortality prediction scores (APACHE II (R = 0.449), CRIP (R = 0.403) and SOFA (R = 0.437)) and initial PCT serum levels. Conclusions: This study found that the increased PCT serum level is an important diagnostic tool for VAP and the PCT serum levels can predict the outcome of VAP patients. We recommend other larger studies to augment our findings. Keywords: Ventilator-Associated Pneumonia (VAP); Procalcitonin (PCT); Acute Physiology and Chronic Health Evaluation II (APACHE II); The Sequential Organ Failure Assessment Score (SOFA); Clinical Pulmonary Infection Score (CPIS) 1. Introduction Ventilator-associated pneumonia (VAP) is pneumonia that develops 48 hours or longer after mechanical venti- lation is given by means of an endotracheal tube or tra- cheostomy. Ventilator-associated pneumonia (VAP) re- sults from the invasion of the lower respiratory tract and lung parenchyma by microorganisms. Intubation com- promises the integrity of the oropharynx and trachea and allows oral and gastric secretions to enter the lower air- ways [1]. Ventilator associated pneumonia (VAP) is a complication in as many as 28% of patients who receive mechanical ventilation. The incidence of VAP increases with the duration of mechanical ventilation. Estimated rates are 3% per day for the first 5 days, 2% per day for days 6 - 10, and 1% per day after day 10 [2]. The crude mortality rate of VAP is 27% - 76%. Studies have con- sistently shown that a delay in starting appropriate and adequately dosed antibiotic therapy increases the mortal- ity risk. One of the causes of the high mortality rate is the di- agnosis delay [1]. Unlike community-acquired pneumonia, it may be dif- ficult to determine whether pneumonia has developed in a hospitalized ventilator-dependent patient. Symptoms and signs usually are not conclusive. Although the plain chest roentgenogram remains an important component in the evaluation of hospitalized patients with suspected pneumonia, it is most helpful when it is normal and rules out pneumonia. Microscopy evaluation and culture of tracheal secretions and/or expectorated sputum are also frequently inconclusive for patients clinically suspected of having pneumonia, because the upper respiratory tract *The authors declare no conflict of interest. #Corresponding author. C opyright © 2013 SciRes. OJRD  A. ABD EL HALIM ET AL. 74 of most patients in the ICU is colonized with potential pulmonary pathogens, whether or not parenchymal pul- monary infection is present [3]. Procalcitonin (PCT) is a peptide precursor of the hormone calcitonin, the latter being involved with calcium homeostasis. It is composed of 116 amino acids and is produced by parafollicular cells (C cells) of the thyroid and by the neuroendocrine cells of the lung and the intestine. The level of procalci- tonin raises in a response to a proinflammatory stimulus, especially of bacterial origin [4]. Measurement of pro- calcitonin can be used as a marker of sepsis caused by bacteria and generally grades well with the degree of sep- sis [5]. PCT has the greatest sensitivity (85%) and speci- ficity (91%) for differentiating patients with systemic inflammatory response syndrome (SIRS) from those with sepsis [6]. The aim of the work: was to clarify the role of the serum procalcitonin in the diagnosis and the prognosis of ventilator associated pneumonia. 2. Subjects and Methods This study was conducted at the ICU of King Fahad Spe- cialist Hospital, Dammam, Kingdom of Saudi Arabia. The study was approved by Ethics and Research Com- mittee. All patients or their families and control subjects gave their written informed consent before participating in the study. This study included 3 groups of subjects (Ta- ble 1): Group 1: It included 42 VAP patients that were ad- mitted at the ICU. The mean age was 58.09 ± 13.07 years. There were 27 (64.28%) males and 15 (35.72%) fe- males. Group 2: It included 20 non VAP-ICU admitted pa- tients (on mechanical ventilation). The mean age was 56.90 ± 10.54 years. There were 12 (60%) males and 8 (40%) females. Group 3: It included 20 healthy control subjects. The mean age was 53.85 ± 11.26 years. There were 13 (65%) males and 7 (35%) females. The three groups were matched for age and sex (p val- ue > 0.05) All subjects included in this study were undergone for the following: 1) Complete history taking and thorough physical ex- amination. 2) Chest x ray examination. 3) Complete blood picture (CBC), C reactive protein (CRP), liver and kidney functions tests. 4) Arterial blood gases analysis (ABGs). 5) Acute Physiology and Chronic Health Evaluation II (APACHE II) score was calculated for patient groups only. 6) The Sequential Organ Failure Assessment score Table 1. Some basal characteristic data for the subjects in- cluded in this study. VAP patients (No = 42) Non VAP patients (No = 20) Healthy Subjects (No = 20) Age (Mean ±SD) Sex (Male/Female) CRP (mg/L) WBC (×103/µL) APACHE II SOFA 58.09 ± 13.07 27/15 160.4 ± 4.7 14.5 ± 3.53 24.11 ± 4.57 7.88 ± 2.92 56.90 ± 10.54 12/8 28.53 ± 2.6 9.6 ± 0.45 16 ± 3.25 3.56 ± 2.04 53.85 ± 11.26 13/7 5.38 ± 1.1 6.5 ± 1.04 Na Na Associated conditions COPD DM Renal failure Heart diseases Malignancy Neurologic diseases Liver cirrhosis 8 10 3 11 7 3 3 5 4 2 5 2 1 2 0 0 0 0 0 0 0 (SOFA) was calculated for patient groups only. 7) The Clinical Pulmonary Infection Score (CPIS) was calculated for patient groups only. 8) Measurement of procalcitonin: this was done in all subjects included in this study. Blood samples were taken and the sera were separated and stored at −80˚C for fur- ther procalcitonin analysis. Procalcitonin levels were determined with the commercially available automated immunochemistry method (Brahms Kryptor, Brahms Li- aison, Berlin, Germany) [7]. For VAP patients; PCT measurement was done on the first day of diagnosis (for comparisons with other subject groups) and then repeated on the 5th day of diagnosis. Pneumonia was classified as VAP if it occurred after 48 hours of mechanical ventilation and was not incu- bated before the initiation of the mechanical ventilation. Early-onset VAP was defined as that occurring during the first 4 days on mechanical ventilation, whereas VAP developed thereafter was classified as late-onset [8]. A diagnosis of pneumonia was suspected when a new, per- sistent infiltrate, consolidation, cavitation or pleural effu- sion was seen on chest X-rays and at least two of the fol- lowing were observed: a body temperature below 36˚C or above 38˚C; a white blood cell count lower than 4000/mm3 or higher than 11,000/mm3; and macroscopi- cally purulent tracheal aspirate. Tracheal aspirate was classified as purulent or non purulent after visual inspec- tion. Tracheal aspirate for quantitative culture had been obtained before antimicrobial treatment was started. Tra- cheal aspirate cultures yielding ≥105 CFU/ml were con- sidered positive. We calculated the clinical pulmonary infection score (CPIS). Patients were assumed to have VAP when the CPIS was >6. Patients received a diagno- sis of VAP only after other medical conditions to which the presenting symptoms, signs or radiological findings could be attributed had been ruled out. For all patients in Copyright © 2013 SciRes. OJRD  A. ABD EL HALIM ET AL. 75 whom the clinical suspicion of VAP was confirmed, em- pirical antimicrobial therapy was started immediately and modified after culture results if needed. Patients were followed until resolution of pneumonia or death [9]. 2.1. Exclusion Criteria Any patient has any one of the followings was excluded from this study: 1) Age below 18 years; 2) The develop- ment of pneumonia within 48 hours of beginning of me- chanical ventilation; 3) Evidence of bacterial infection elsewhere; 4) Immunosuppression; 5) Expected early death. 2.2. Statistical Analysis Statistical analysis was performed with the Statistical Package for the Social Sciences, version 16 for Windows (SPSS Inc., Chicago, IL, USA). Values of p < 0.05 were considered statistically significant. 3. Results The total duration of mechanical ventilation among pa- tients with VAP was 15.35 ± 9.21 days compared with 10.67 ± 8.52 days in patients without VAP (p value < 0.01). There were 15 (35.71%) early onset VAP patients and 27 (64.29%) late onset VAP patients. The causative microbes among VAP patients were shown in Table 2. There was a highly statistically significant difference (p value < 0.001) between VAP patients on one side and both non VAP-ICU patients and healthy control subjects on the other side regarding the mean values of PCT (1.54 ± 0.50 ng/ml among VAP patients, 0.06 ± 0.03 ng/ml among non VAP patients, and 0.04 ± 0.02 ng/ml among healthy control subjects) (Table 3 and Figure 1). No statistically significant difference (p value > 0.05) in the mean values of PCT was present between non VAP-ICU patients and healthy control subjects (0.06 ± 0.03 ng/ml among non VAP patients and 0.04 ± 0.02 ng/ml among healthy control subjects) (Table 3 and Figure 1). 22 (52.38%) patients out of 42 VAP patients survived while 20 (47.62%) patients died. No patient died in the first 5 days after diagnosis. The mean values of PCT were statistically significantly higher (p value < 0.001) among died VAP group than the survivor VAP group on both first day (1.92 ± 0.41 ng/ml vs 1.19 ± 0.29 ng/ml respectively) and 5th day measurements (4.49 ± 0.59 ng/ml vs 0.81 ± 0.21 ng/ ml respectively) (Table 4 and Figure 2). The mean values of PCT increased signify- cantly from (1.92 ± 0.41 to 4.49 ± 0.59) among died group while decreased significantly from (1.19 ± 0.29 to 0.81 ± 0.21) among the survivor group on repeated test- ing on the 5th day in comparison with the first day meas- urement (Table 4 and Figure 2). There was a high statis- tically positive correlation (p value < 0.01) between mor- Table 2. The microbiological profile among the VAP pa- tients. Microbes No of the VAP patients (%) Staphylococcus aureus Pseudomonas aeruginosa Klebsiella pneumoniae Haemophilus influenzae Acinetobacter Enterobacter Proteus Serratia Mixed Unidentified 7 (16.67%) 5 (11.91%) 4 (9.52%) 3 (7.14%) 2 (4.76%) 1 (2.38%) 1 (2.38%) 1 (2.38%) 2 (4.76%) 16 (38.10%) Table 3. Comparison between the different subject groups regarding initial PCT levels (ng/ml). PCT (ng/ml) Groups ( No) MinimumMaximum Mean ± SD p value 1. VAP patients (No = 42) 0.65 2.82 1.546 ± 0.5091 vs 2 < 0.001 2. Non VAP patient (No = 20)0.01 0.12 0.061 ± 0.0361 vs 3 < 0.001 3. Healthy control subjects (No = 20)0.01 0.09 0.0438 ± 0.0272 vs 3 > 0.05 Table 4. Comparison of some measurements between the survivor and died groups among VAP patients. Outcome APACHEII SOFA CPIS PCT 1 (ng/ml) PCT 5 (ng/ml) Survivors (No=22) (Mean ± SD) 22.31 ± 3.73 6.40 ± 2.90 7.68 ± 1.04 1.198 ± 0.29 0.81 ± 0.21 Died (No = 20) (Mean ± SD) 26.10 ± 4.66 9.50 ± 1.69 9.25 ± 2.02 1.92 ± 0.41 4.49 ± 0.59 p value p < 0.01p < 0.001 p < 0.01 p < 0.001p < 0.001 tality prediction scores (APACHE II (R = 0.449), CRIP (R = 0.403) and SOFA (R = 0.437)) and initial PCT se- rum levels. 4. Discussion In this study, there was a highly statistically significant difference (p value < 0.001) between VAP patients on one side and both non VAP-ICU patients and healthy control subjects on the other side regarding the mean values of PCT (1.54 ± 0.5 ng/ml among VAP patients, 0.06 ± 0.03 ng/ml among non VAP patients, 0.04 ± 0.02 ng/ml among healthy control subjects). These results are in agreement with that of other investigators. Lee JY, et al., [10] found that the PCT level in the patients with pneumonia (2.06 ± 0.60 ng/ml) was significantly higher than that in the healthy controls (0.05 ± 0.02 ng/ml). In case-control study carried out by Polzen et al., [11] which included 26 patients with pneumonia found higher PCT levels among pneumonia patients with a cut-off of Copyright © 2013 SciRes. OJRD  A. ABD EL HALIM ET AL. 76 Figure 1. Comparison between the different subject groups re- garding initial PCT levels (ng/ml). PCT 1 st day PCT 5 th day Figure 2. Comparison of the mean PCT levels between the survivor and died groups among VAP patients (first and 5th days respec- tively). 0.5 ng/ml. Another study done by Müller and his col- leagues [12] with a cohort of 373 subjects demonstrated that PCT with an AUC of 0.85 (0.80 - 0.91) was associ- ated with a diagnosis of pneumonia and that PCT im- proved the ability of clinical findings to diagnose pneu- monia (p < 0.001). This study postulated that a PCT < 0.1 ng/ml indicates another diagnosis than pneumonia even with an infiltrate on X-ray. Bafadhel et al. [13] con- ducted a cohort trial with 319 patients of whom 96 had pneumonia. Patients with pneumonia had a higher PCT (p < 0.0001) than those with acute exacerbation of chronic obstructive pulmonary disease (AECOPD). At a cut-off of 0.08 ng/ml, PCT had an AUC of 0.93 (0.88 - 0.98) for differentiation between pneumonia and COPD; sensitivity 89% (95% CI 78 - 95) and specificity 78% (95% CI 72 - 82). Likewise Seligman and his group [14] found the biomarkers procalcitonin, MR-proANP, and copeptin are increased among VAP patients and can pre- dict mortality in VAP, as can the SOFA score. Procalci- tonin alone has the greatest predictive power for such mortality. There are accumulating data that explain our and other researchers’ results. The investigations identified PCT as part of the complex pro-inflammatory response of the innate immune system [15]. In vitro stimulation of macrophages with either bacteria or endotoxin results in rapid synthesis and release of PCT within 4 hours [16]. In a hamster model of Escherichia coli peritonitis, tran- scription and translation of PCT synthesis was demon- strated in virtually all organs tested and in macrophages [17]. In vitro , endotoxin stimulated adipocytes to synthe- size PCT in the absence of macrophages, but synthesis was augmented if adipocytes were incubated with en- dotoxin-sensitized macrophages [18]. PCT differs from other biomarkers of the invasion by bacterial pathogens by several aspects. Serum PCT serum levels are detect- able as early as 3 - 4 h after invasion, which is much ear- lier than the increase in the C-reactive protein level or erythrocyte sedimentation rate [19]. Also, elevated PCT levels have not been noted for other inflammatory condi- tions, such as acute respiratory distress syndrome, pol- yarteritis nodosa, systemic lupus erythematosis [8-20]. Available data also indicate that PCT levels are not in- fluenced by therapy with glucocorticoids or nonsteroidal anti-inflammatory agents. PCT levels do not increase in patients with infection due to respiratory viruses [15]. Our study revealed that the mean values of PCT were statistically significantly higher (p value < 0.001) among died VAP group than the survivor VAP group on both first day (1.92 ± 0.41 ng/ml vs 1.19 ± 0.29 ng/ml respectively) and 5th day measurements (4.49 ± 0.59 ng/ml vs 0.81 ± 0.21 ng/ml respectively). Other studies found similar results. Duflo et al. [21] found PCT was significantly elevated in non-survivors: the best cut-off for serum PCT in the non-survivors in the VAP group was 2.6 ng/ml with a sensitivity of 74% and a specificity of 75%. Like- wise, Luyt et al. [22] found high median PCT levels of about 3 ng/ml at Day 1 in patients with unfavorable out- comes during the clinical course of microbiologically proven VAP (n = 63). These results are explained intui- tively by that the severe and non respondent pneumonia among the died patients are associated with high bacte- rial and toxin loads that stimulate excess release of the PCT. In this study the mean values of PCT increased signi- ficantly (from (1.92 ± 0.41 to 4.49 ± 0.59) among died group while decreased significantly (from 1.19 ± 0.29 to 0.81 ± 0.21 among the survivor group on repeated testing on the 5th day in comparison with the first day measure- ment. Other studies showed similar results. Harbarth et al., [23] and Jensen and his colleagues [24] found that unsuccessful source control and poor outcome is associ- ated with persistent elevated PCT levels. Also Bloos et al., [25] found that high PCT levels are associated with increased severity of illness in patients with severe pneu- monia and appears to be a prognostic marker mortality comparable to the APACHE II score. These results are explained by that the severe and non respondent pneu- Copyright © 2013 SciRes. OJRD 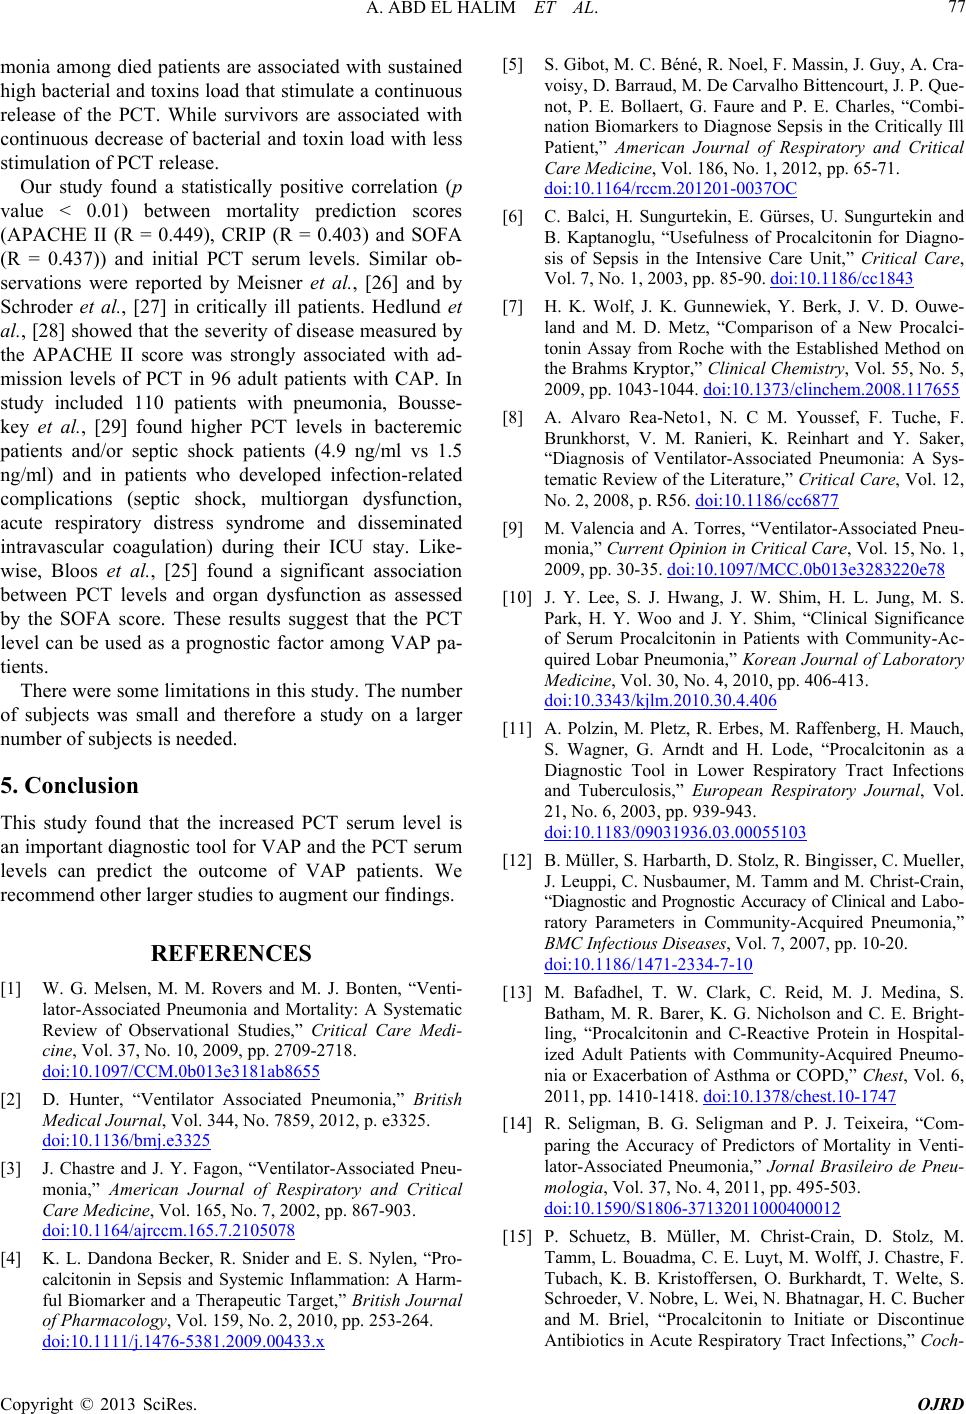 A. ABD EL HALIM ET AL. 77 monia among died patients are associated with sustained high bacterial and toxins load that stimulate a continuous release of the PCT. While survivors are associated with continuous decrease of bacterial and toxin load with less stimulation of PCT release. Our study found a statistically positive correlation (p value < 0.01) between mortality prediction scores (APACHE II (R = 0.449), CRIP (R = 0.403) and SOFA (R = 0.437)) and initial PCT serum levels. Similar ob- servations were reported by Meisner et al., [26] and by Schroder et al., [27] in critically ill patients. Hedlund et al., [28] showed that the severity of disease measured by the APACHE II score was strongly associated with ad- mission levels of PCT in 96 adult patients with CAP. In study included 110 patients with pneumonia, Bousse- key et al., [29] found higher PCT levels in bacteremic patients and/or septic shock patients (4.9 ng/ml vs 1.5 ng/ml) and in patients who developed infection-related complications (septic shock, multiorgan dysfunction, acute respiratory distress syndrome and disseminated intravascular coagulation) during their ICU stay. Like- wise, Bloos et al., [25] found a significant association between PCT levels and organ dysfunction as assessed by the SOFA score. These results suggest that the PCT level can be used as a prognostic factor among VAP pa- tients. There were some limitations in this study. The number of subjects was small and therefore a study on a larger number of subjects is needed. 5. Conclusion This study found that the increased PCT serum level is an important diagnostic tool for VAP and the PCT serum levels can predict the outcome of VAP patients. We recommend other larger studies to augment our findings. REFERENCES [1] W. G. Melsen, M. M. Rovers and M. J. Bonten, “Venti- lator-Associated Pneumonia and Mortality: A Systematic Review of Observational Studies,” Critical Care Medi- cine, Vol. 37, No. 10, 2009, pp. 2709-2718. doi:10.1097/CCM.0b013e3181ab8655 [2] D. Hunter, “Ventilator Associated Pneumonia,” British Medical Journal, Vol. 344, No. 7859, 2012, p. e3325. doi:10.1136/bmj.e3325 [3] J. Chastre and J. Y. Fagon, “Ventilator-Associated Pneu- monia,” American Journal of Respiratory and Critical Care Medicine, Vol. 165, No. 7, 2002, pp. 867-903. doi:10.1164/ajrccm.165.7.2105078 [4] K. L. Dandona Becker, R. Snider and E. S. Nylen, “Pro- calcitonin in Sepsis and Systemic Inflammation: A Harm- ful Biomarker and a Therapeutic Target,” British Journal of Pharmacology, Vol. 159, No. 2, 2010, pp. 253-264. doi:10.1111/j.1476-5381.2009.00433.x [5] S. Gibot, M. C. Béné, R. Noel, F. Massin, J. Guy, A. Cra- voisy, D. Barraud, M. De Carvalho Bittencourt, J. P. Que- not, P. E. Bollaert, G. Faure and P. E. Charles, “Combi- nation Biomarkers to Diagnose Sepsis in the Critically Ill Patient,” American Journal of Respiratory and Critical Care Medicine, Vol. 186, No. 1, 2012, pp. 65-71. doi:10.1164/rccm.201201-0037OC [6] C. Balci, H. Sungurtekin, E. Gürses, U. Sungurtekin and B. Kaptanoglu, “Usefulness of Procalcitonin for Diagno- sis of Sepsis in the Intensive Care Unit,” Critical Care, Vol. 7, No. 1, 2003, pp. 85-90. doi:10.1186/cc1843 [7] H. K. Wolf, J. K. Gunnewiek, Y. Berk, J. V. D. Ouwe- land and M. D. Metz, “Comparison of a New Procalci- tonin Assay from Roche with the Established Method on the Brahms Kryptor,” Clinical Chemistry, Vol. 55, No. 5, 2009, pp. 1043-1044. doi:10.1373/clinchem.2008.117655 [8] A. Alvaro Rea-Neto1, N. C M. Youssef, F. Tuche, F. Brunkhorst, V. M. Ranieri, K. Reinhart and Y. Saker, “Diagnosis of Ventilator-Associated Pneumonia: A Sys- tematic Review of the Literature,” Critical Care, Vol. 12, No. 2, 2008, p. R56. doi:10.1186/cc6877 [9] M. Valencia and A. Torres, “Ventilator-Associated Pneu- monia,” Current Opinion in Critical Care, Vol. 15, No. 1, 2009, pp. 30-35. doi:10.1097/MCC.0b013e3283220e78 [10] J. Y. Lee, S. J. Hwang, J. W. Shim, H. L. Jung, M. S. Park, H. Y. Woo and J. Y. Shim, “Clinical Significance of Serum Procalcitonin in Patients with Community-Ac- quired Lobar Pneumonia,” Korean Journal of Laboratory Medicine, Vol. 30, No. 4, 2010, pp. 406-413. doi:10.3343/kjlm.2010.30.4.406 [11] A. Polzin, M. Pletz, R. Erbes, M. Raffenberg, H. Mauch, S. Wagner, G. Arndt and H. Lode, “Procalcitonin as a Diagnostic Tool in Lower Respiratory Tract Infections and Tuberculosis,” European Respiratory Journal, Vol. 21, No. 6, 2003, pp. 939-943. doi:10.1183/09031936.03.00055103 [12] B. Müller, S. Harbarth, D. Stolz, R. Bingisser, C. Mueller, J. Leuppi, C. Nusbaumer, M. Tamm and M. Christ-Crain, “Diagnostic and Prognostic Accuracy of Clinical and Labo- ratory Parameters in Community-Acquired Pneumonia,” BMC Infectious Diseases, Vol. 7, 2007, pp. 10-20. doi:10.1186/1471-2334-7-10 [13] M. Bafadhel, T. W. Clark, C. Reid, M. J. Medina, S. Batham, M. R. Barer, K. G. Nicholson and C. E. Bright- ling, “Procalcitonin and C-Reactive Protein in Hospital- ized Adult Patients with Community-Acquired Pneumo- nia or Exacerbation of Asthma or COPD,” Chest, Vol. 6, 2011, pp. 1410-1418. doi:10.1378/chest.10-1747 [14] R. Seligman, B. G. Seligman and P. J. Teixeira, “Com- paring the Accuracy of Predictors of Mortality in Venti- lator-Associated Pneumonia,” Jornal Brasileiro de Pneu- mologia, Vol. 37, No. 4, 2011, pp. 495-503. doi:10.1590/S1806-37132011000400012 [15] P. Schuetz, B. Müller, M. Christ-Crain, D. Stolz, M. Tamm, L. Bouadma, C. E. Luyt, M. Wolff, J. Chastre, F. Tubach, K. B. Kristoffersen, O. Burkhardt, T. Welte, S. Schroeder, V. Nobre, L. Wei, N. Bhatnagar, H. C. Bucher and M. Briel, “Procalcitonin to Initiate or Discontinue Antibiotics in Acute Respiratory Tract Infections,” Coch- Copyright © 2013 SciRes. OJRD  A. ABD EL HALIM ET AL. Copyright © 2013 SciRes. OJRD 78 rane Database of Systematic Reviews, Vol. 9, 2012, Arti- cle ID: CD007498. doi:10.1002/14651858.CD007498.pub2 [16] D. N. Gilbert, “Procalcitonin as a Biomarker in Respira- tory Tract Infection,” Clinical Infectious Diseases, Vol. 52, Suppl. 4, 2011, pp. S346-S350. doi:10.1093/cid/cir050 [17] B. Müller, J. C. White, E. S. Nylén, R. H. Snider, K. L. Becker and J. F. Habener, “Ubiquitous Expression of the Calcitonin-I Gene in Multiple Tissues in Response to Sepsis,” Journal of Clinical Endocrinology & Metabolism, Vol. 86, No. 1, 2001, pp. 396-404. doi:10.1210/jc.86.1.396 [18] P. Linscheid, D. Seboek, E. S. Nylen, I. Langer, M. Schlatter, K. L. Becker, U. Keller and B. Müller, “In Vi- tro and in Vivo Calcitonin I Gene Expression in Paren- chymal Cells: A Novel Product of Human Adipose Tis- sue,” Endocrinology, Vol. 144, No. 12, 2003, pp. 5578- 5584. doi:10.1210/en.2003-0854 [19] K. L. Becker, E. S. Nylén, J. C. White, B. Müller and R. H. Snider Jr, “Clinical Review 167: Procalcitonin and the Calcitonin Gene Family of Peptides in Inflammation, In- fection, and Sepsis: A Journey from Calcitonin Back to Its Precursors,” Journal of Clinical Endocrinology & Me- tabolism, Vol. 89, No. 4, 2004, pp. 1512-1525. doi:10.1210/jc.2002-021444 [20] C. A. Scirè, L. Cavagna, C. Perotti, E. Bruschi, R. Capo- rali and C. Montecucco, “Diagnostic Value of Procalci- tonin Measurement in Febrile Patients with Systemic Autoimmune Diseases,” Clinical and Experimental Rheu- matology, Vol. 24, No. 2, 2006, pp. 123-128. [21] F. Duflo, R. Debon, G. Monneret, J. Bienvenu, D. Chassard and B. Allaouchiche, “Alveolar and Serum Procalcitonin: Diagnostic and Prognostic Value in Ventilator-Associated Pneumonia,” Anesthesiology, Vol. 96, No. 1, 2002, pp. 74-79. doi:10.1097/00000542-200201000-00018 [22] C. E. Luyt, V. Guérin, A. Combes, J. L. Trouillet, S. B. Ayed, M. Bernard, C. Gibert and J. Chastre, “Procalci- tonin Kinetics as a Prognostic Marker of Ventilator-As- sociated Pneumonia,” American Journal of Respiratory and Critical Care Medicine, Vol. 171, No. 1, 2005, pp. 48-53. doi:10.1164/rccm.200406-746OC [23] S. Harbarth, K. Holeckova, C. Froidevaux, D. Pittet, B. Ricou, G. E. Grau, L. Vadas and J. Pugin, “Geneva Sepsis Network Diagnostic Value of Procalcitonin, Interleukin-6, and Interleukin-8 in Critically Ill Patients Admitted with Suspected Sepsis,” American Journal of Respiratory and Critical Care Medicine, Vol. 164, No. 3, 2001, pp. 396- 402. doi:10.1164/ajrccm.164.3.2009052 [24] J. U. Jensen, L. Heslet, T. H. Jensen, K. Espersen, P. Steffensen and M. Tvede, “Procalcitonin Increase in Early Identification of Critically Ill Patients at High Risk of Mortality,” Critical Care Medicine, Vol. 34, No. 10, 2006, pp. 2596-2602. doi:10.1097/01.CCM.0000239116.01855.61 [25] F. Bloos, J. C. Marshall, R. P. Dellinger, J. L. Vincent, G. Gutierrez, E. Rivers, R. A. Balk, P. F. Laterre, D. C. An- gus, K. Reinhart and F. M. Brunkhorst, “Multinational, Observational Study of Procalcitonin in ICU Patients with Pneumonia Requiring Mechanical Ventilation: A Multi- center Observational Study,” Critical Care, Vol. 15, No. 2, 2011, p. R88. doi:10.1186/cc10087 [26] M. Meisner, K. Tschaikowsky, T. Palmaers and J. Schmidt, “Comparison of Procalcitonin (PCT) and C-Reactive Protein (CRP) Plasma Concentrations at Different SOFA Scores during the Course of Sepsis and MODS,” Critical Care, Vol. 3, No. 1, 1999, pp. 45-50. doi:10.1186/cc306 [27] J. Schröder, K. H. Staubach, P. Zabel, F. Stüber and B. Kremer, “Procalcitonin as a Marker of Severity in Septic Shock. Langenbecks,” Archives of Surgery, Vol. 384, No. 1, 1999, pp. 33-38. doi:10.1007/s004230050170 [28] J. Hedlund and L. O. Hansson, “Procalcitonin and C- Reactive Protein Levels in Community-Acquired Pneu- monia: Correlation with Etiology and Prognosis,” Infec- tion, Vol. 28, No. 2, 2000, pp. 68-73. doi:10.1007/s150100050049 [29] N. Boussekey, O. Leroy, H. Georges, P. Devos, T. d’Escrivan and B. Guery, “Diagnostic and Prognostic Val- ues of Admission Procalcitonin Levels in Community- Acquired Pneumonia in an Intensive Care Unit,” Infection, Vol. 33, No. 4, 2005, pp. 257-263. doi:10.1007/s15010-005-4096-2 |