

Paper Menu >>
Journal Menu >>
 Open Journal of Respiratory Diseases, 2013, 3, 63-67 http://dx.doi.org/10.4236/ojrd.2013.32010 Published Online May 2013 (http://www.scirp.org/journal/ojrd) Resistance Measured by Airflow Perturbation Compared with Standard Pulmonary Function Measures* Tania Haque1, Jafar Vossoughi2, Arthur T. Johnson3, Wanda Bell-Farrell1, Thomas Fitzgerald1, Steven M. Scharf1# 1University of Maryland, Baltimore, USA 2Engineering and Scientific Research Associates, Olney, USA 3Fischell Department of Bioengineering University of Maryland, College Park, USA Email: #[email protected] Received March 5, 2013; revised April 5, 2013; accepted April 13, 2013 Copyright © 2013 Tania Haque et al. This is an open access article distributed under the Creative Commons Attribution License, which permits unrestricted use, distribution, and reproduction in any medium, provided the original work is properly cited. ABSTRACT Background: Routine lung function testing requires expensive equipment, or requires maximum expiratory effort. The airflow perturbation device (APD) is a light handheld device, allowing for serial measures of respiratory resistance noninvasively and effortlessly. Methods: In a convenience sample of 398 patients undergoing pulmonary function test- ing, we compared routine spirometric indices (forced expired volume in 1 second (FEV1), peak expiratory flow (PEF)), and airways resistance (Raw-272 patients), to measures of respiratory resistance measured with the APD including in- spiratory (IR), expiratory (ER) and averaged (AR) resistance. Results: Measures of lung function were significantly correlated (p < 0.001). On regression analysis, between 7% - 17% of the variance (R2) for FEV1, PEF, and Raw was explained by APD measurements. Approximately 2/3 of the variance in FEV1 was explained by PEF measurements. Conclusions: APD measurements of lung function correlate with conventional measures. Future studies should be di- rected at exploring the use of the APD device in serial measures of lung function in patients with lung disease. Keywords: Airflow Perturbation Device; Pulmonary Function; Forced Expired Volume in 1 Second; Peak Expiratory Flow; Airway Resistance 1. Introduction Airway resistance is a commonly used measurement of lung function in a variety of respiratory disorders. Resis- tance measurement is also useful in evaluating respira- tory effects of exposure to bronchoconstrictive or bron- chodilatory drugs as well as to airborne pollutants. Whole-body plethysmography is commonly used to measure airways resistance [1]. This technique requires coordinated breathing maneuvers coached by a skilled technician and a large non-portable and expensive appa- ratus. Another technique for measurement of pulmonary resistance (airways resistance and lung tissue resistance) is the technique of von Niergard and Wirz [2]. However, this technique necessitates the subject swallowing an uncomfortable esophageal balloon. Finally, forced oscil- lation, originally designed to measure respiratory imped- ance during tidal breathing [3] has been shown to be sen- sitive to changes in airways resistance [4]. For this tech- nique, sinusoidal oscillations of pressure are superim- posed on tidal breathing. From the ratio of pressure changes to flow changes and the phase angles between them, impedance is calculated [4]. However, forced os- cillation requires expensive equipment and is only suit- able in the pulmonary function laboratory. In the clinical setting, total respiratory resistance is usually assessed indirectly using spirometric indices such as forced ex- pired volume in one second (FEV1) or peak expiratory flow (PEF), the latter often used at home. However, spi- rometric techniques require forced exhalation, require some patient training, and may be difficult or stressful for some patients to perform. Thus, most techniques for measurement of pulmonary resistance require either skilled cooperation on the part of the subject and/or spe- cialized expensive equipment found in pulmonary func- tion laboratories and are not suitable for home measure- ment. The airflow perturbation device (APD—see Figure 1) is a variant of the forced oscillation technique suitable for use in settings outside the pulmonary function laboratory *Funding: NIH NHLBI: 44HL078055. #Corresponding author. C opyright © 2013 SciRes. OJRD 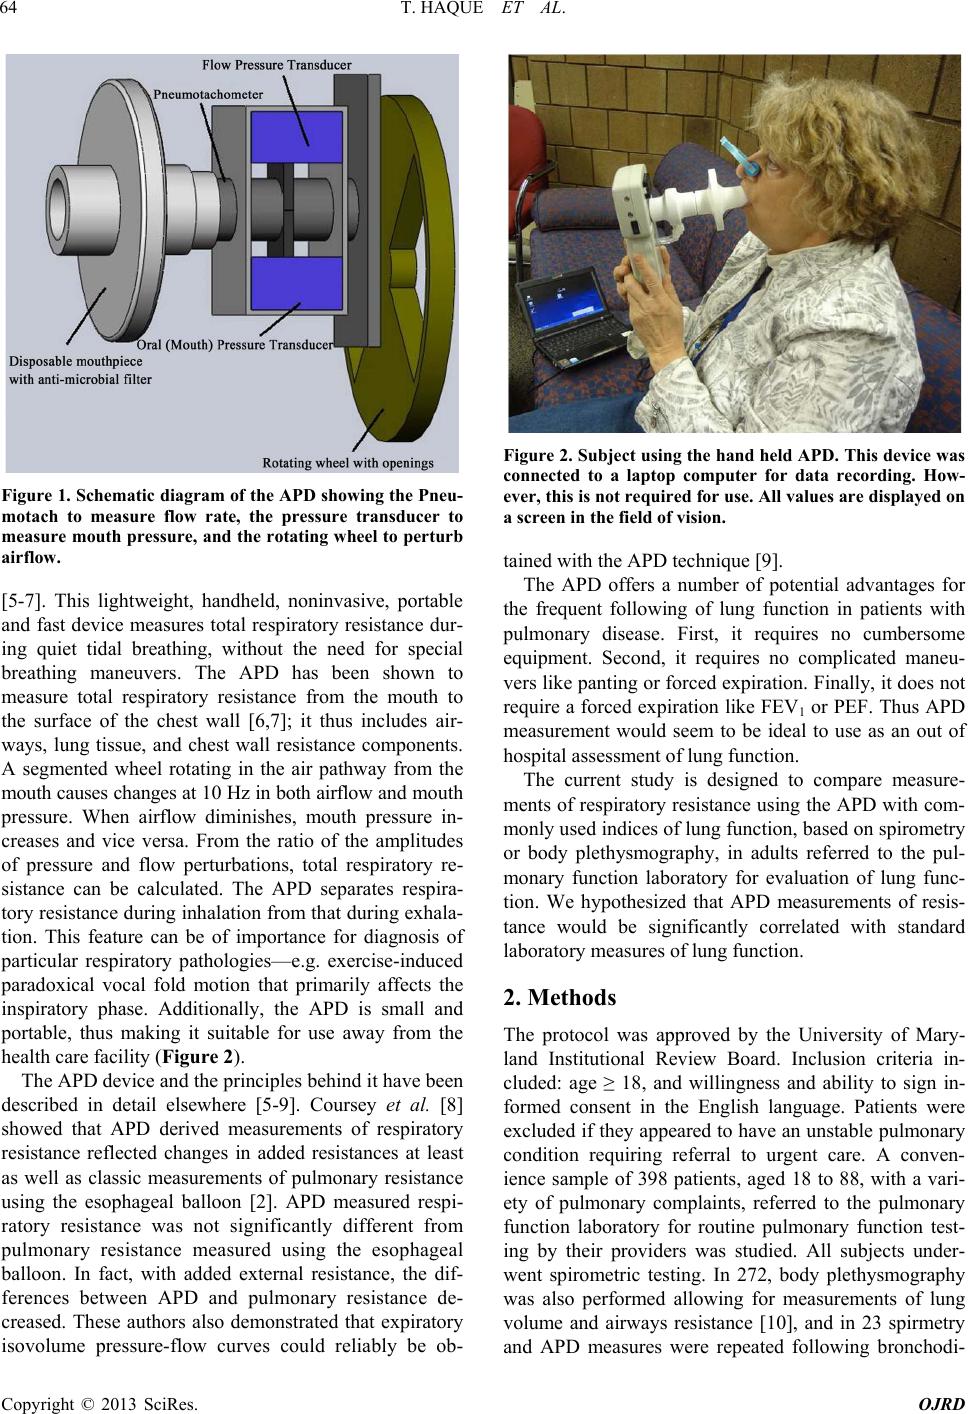 T. HAQUE ET AL. 64 Figure 1. Schematic diagram of the APD showing the Pneu- motach to measure flow rate, the pressure transducer to measure mouth pressure, and the rotating wheel to perturb airflow. [5-7]. This lightweight, handheld, noninvasive, portable and fast device measures total respiratory resistance dur- ing quiet tidal breathing, without the need for special breathing maneuvers. The APD has been shown to measure total respiratory resistance from the mouth to the surface of the chest wall [6,7]; it thus includes air- ways, lung tissue, and chest wall resistance components. A segmented wheel rotating in the air pathway from the mouth causes changes at 10 Hz in both airflow and mouth pressure. When airflow diminishes, mouth pressure in- creases and vice versa. From the ratio of the amplitudes of pressure and flow perturbations, total respiratory re- sistance can be calculated. The APD separates respira- tory resistance during inhalation from that during exhala- tion. This feature can be of importance for diagnosis of particular respiratory pathologies—e.g. exercise-induced paradoxical vocal fold motion that primarily affects the inspiratory phase. Additionally, the APD is small and portable, thus making it suitable for use away from the health care facility (Figure 2). The APD device and the principles behind it have been described in detail elsewhere [5-9]. Coursey et al. [8] showed that APD derived measurements of respiratory resistance reflected changes in added resistances at least as well as classic measurements of pulmonary resistance using the esophageal balloon [2]. APD measured respi- ratory resistance was not significantly different from pulmonary resistance measured using the esophageal balloon. In fact, with added external resistance, the dif- ferences between APD and pulmonary resistance de- creased. These authors also demonstrated that expiratory isovolume pressure-flow curves could reliably be ob- Figure 2. Subject using the hand held APD. This device was connected to a laptop computer for data recording. How- ever, this is not required for use. All values are displayed on a screen in the field of vision. tained with the APD technique [9]. The APD offers a number of potential advantages for the frequent following of lung function in patients with pulmonary disease. First, it requires no cumbersome equipment. Second, it requires no complicated maneu- vers like panting or forced expiration. Finally, it does not require a forced expiration like FEV1 or PEF. Thus APD measurement would seem to be ideal to use as an out of hospital assessment of lung function. The current study is designed to compare measure- ments of respiratory resistance using the APD with com- monly used indices of lung function, based on spirometry or body plethysmography, in adults referred to the pul- monary function laboratory for evaluation of lung func- tion. We hypothesized that APD measurements of resis- tance would be significantly correlated with standard laboratory measures of lung function. 2. Methods The protocol was approved by the University of Mary- land Institutional Review Board. Inclusion criteria in- cluded: age ≥ 18, and willingness and ability to sign in- formed consent in the English language. Patients were excluded if they appeared to have an unstable pulmonary condition requiring referral to urgent care. A conven- ience sample of 398 patients, aged 18 to 88, with a vari- ety of pulmonary complaints, referred to the pulmonary function laboratory for routine pulmonary function test- ing by their providers was studied. All subjects under- went spirometric testing. In 272, body plethysmography was also performed allowing for measurements of lung volume and airways resistance [10], and in 23 spirmetry and APD measures were repeated following bronchodi- Copyright © 2013 SciRes. OJRD 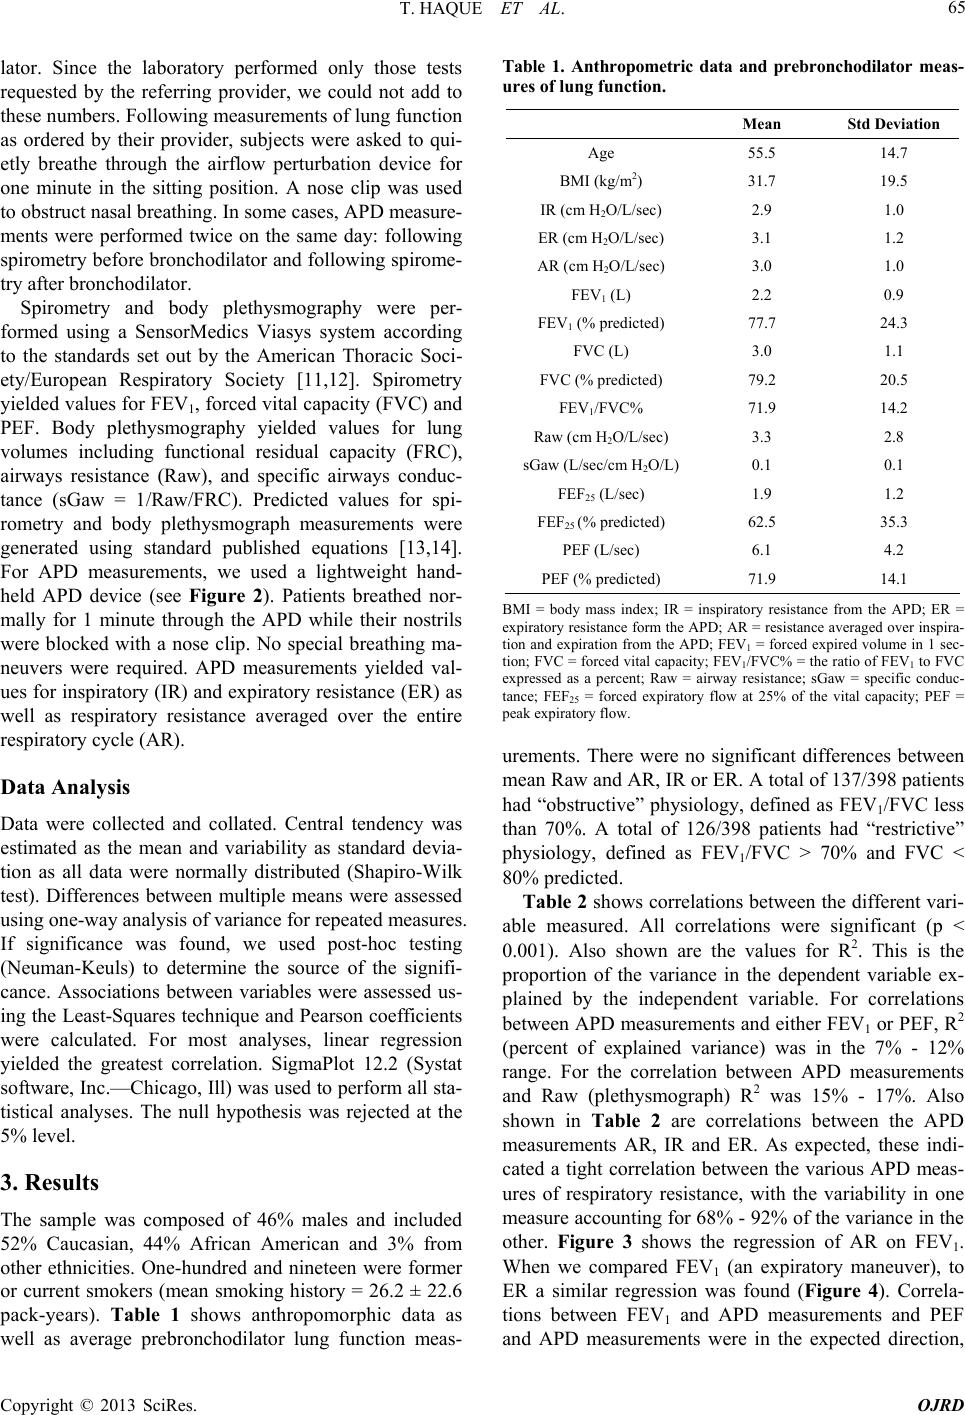 T. HAQUE ET AL. 65 lator. Since the laboratory performed only those tests requested by the referring provider, we could not add to these numbers. Following measurements of lung function as ordered by their provider, subjects were asked to qui- etly breathe through the airflow perturbation device for one minute in the sitting position. A nose clip was used to obstruct nasal breathing. In some cases, APD measure- ments were performed twice on the same day: following spirometry before bronchodilator and following spirome- try after bronchodilator. Spirometry and body plethysmography were per- formed using a SensorMedics Viasys system according to the standards set out by the American Thoracic Soci- ety/European Respiratory Society [11,12]. Spirometry yielded values for FEV1, forced vital capacity (FVC) and PEF. Body plethysmography yielded values for lung volumes including functional residual capacity (FRC), airways resistance (Raw), and specific airways conduc- tance (sGaw = 1/Raw/FRC). Predicted values for spi- rometry and body plethysmograph measurements were generated using standard published equations [13,14]. For APD measurements, we used a lightweight hand- held APD device (see Figure 2). Patients breathed nor- mally for 1 minute through the APD while their nostrils were blocked with a nose clip. No special breathing ma- neuvers were required. APD measurements yielded val- ues for inspiratory (IR) and expiratory resistance (ER) as well as respiratory resistance averaged over the entire respiratory cycle (AR). Data Analysis Data were collected and collated. Central tendency was estimated as the mean and variability as standard devia- tion as all data were normally distributed (Shapiro-Wilk test). Differences between multiple means were assessed using one-way analysis of variance for repeated measures. If significance was found, we used post-hoc testing (Neuman-Keuls) to determine the source of the signifi- cance. Associations between variables were assessed us- ing the Least-Squares technique and Pearson coefficients were calculated. For most analyses, linear regression yielded the greatest correlation. SigmaPlot 12.2 (Systat software, Inc.—Chicago, Ill) was used to perform all sta- tistical analyses. The null hypothesis was rejected at the 5% level. 3. Results The sample was composed of 46% males and included 52% Caucasian, 44% African American and 3% from other ethnicities. One-hundred and nineteen were former or current smokers (mean smoking history = 26.2 ± 22.6 pack-years). Table 1 shows anthropomorphic data as well as average prebronchodilator lung function meas- Table 1. Anthropometric data and prebronchodilator meas- ures of lung function. Mean Std Deviation Age 55.5 14.7 BMI (kg/m2) 31.7 19.5 IR (cm H2O/L/sec) 2.9 1.0 ER (cm H2O/L/sec) 3.1 1.2 AR (cm H2O/L/sec) 3.0 1.0 FEV1 (L) 2.2 0.9 FEV1 (% predicted) 77.7 24.3 FVC (L) 3.0 1.1 FVC (% predicted) 79.2 20.5 FEV1/FVC% 71.9 14.2 Raw (cm H2O/L/sec) 3.3 2.8 sGaw (L/sec/cm H2O/L) 0.1 0.1 FEF25 (L/sec) 1.9 1.2 FEF25 (% predicted) 62.5 35.3 PEF (L/sec) 6.1 4.2 PEF (% predicted) 71.9 14.1 BMI = body mass index; IR = inspiratory resistance from the APD; ER = expiratory resistance form the APD; AR = resistance averaged over inspira- tion and expiration from the APD; FEV1 = forced expired volume in 1 sec- tion; FVC = forced vital capacity; FEV1/FVC% = the ratio of FEV1 to FVC expressed as a percent; Raw = airway resistance; sGaw = specific conduc- tance; FEF25 = forced expiratory flow at 25% of the vital capacity; PEF = peak expiratory flow. urements. There were no significant differences between mean Raw and AR, IR or ER. A total of 137/398 patients had “obstructive” physiology, defined as FEV1/FVC less than 70%. A total of 126/398 patients had “restrictive” physiology, defined as FEV1/FVC > 70% and FVC < 80% predicted. Table 2 shows correlations between the different vari- able measured. All correlations were significant (p < 0.001). Also shown are the values for R2. This is the proportion of the variance in the dependent variable ex- plained by the independent variable. For correlations between APD measurements and either FEV1 or PEF, R2 (percent of explained variance) was in the 7% - 12% range. For the correlation between APD measurements and Raw (plethysmograph) R2 was 15% - 17%. Also shown in Table 2 are correlations between the APD measurements AR, IR and ER. As expected, these indi- cated a tight correlation between the various APD meas- ures of respiratory resistance, with the variability in one measure accounting for 68% - 92% of the variance in the other. Figure 3 shows the regression of AR on FEV1. When we compared FEV1 (an expiratory maneuver), to ER a similar regression was found (Figure 4). Correla- tions between FEV1 and APD measurements and PEF and APD measurements were in the expected direction, Copyright © 2013 SciRes. OJRD 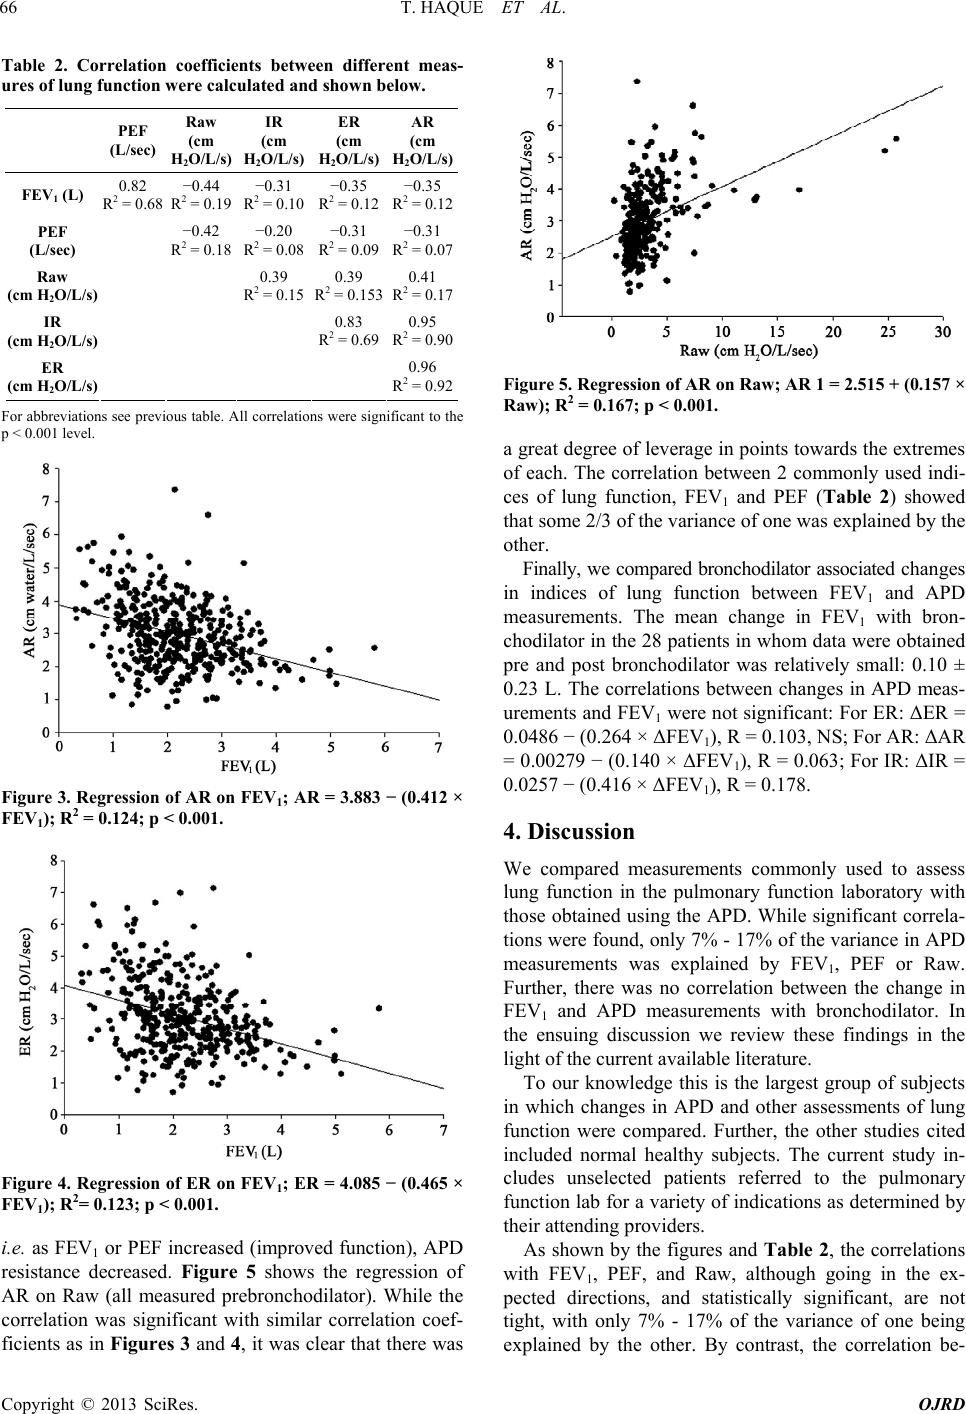 T. HAQUE ET AL. 66 Table 2. Correlation coefficients between different meas- ures of lung function were calculated and shown below. PEF (L/sec) Raw (cm H2O/L/s) IR (cm H2O/L/s) ER (cm H2O/L/s) AR (cm H2O/L/s) FEV1 (L) 0.82 R2 = 0.68 −0.44 R2 = 0.19 −0.31 R2 = 0.10 −0.35 R2 = 0.12 −0.35 R2 = 0.12 PEF (L/sec) −0.42 R2 = 0.18 −0.20 R2 = 0.08 −0.31 R2 = 0.09 −0.31 R2 = 0.07 Raw (cm H2O/L/s) 0.39 R2 = 0.15 0.39 R2 = 0.153 0.41 R2 = 0.17 IR (cm H2O/L/s) 0.83 R2 = 0.69 0.95 R2 = 0.90 ER (cm H2O/L/s) 0.96 R2 = 0.92 For abbreviations see previous table. All correlations were significant to the p < 0.001 level. Figure 3. Regression of AR on FEV1; AR = 3.883 − (0.412 × FEV1); R2 = 0.124; p < 0.001. Figure 4. Regression of ER on FEV1; ER = 4.085 − (0.465 × FEV1); R2= 0.123; p < 0.001. i.e. as FEV1 or PEF increased (improved function), APD resistance decreased. Figure 5 shows the regression of AR on Raw (all measured prebronchodilator). While the correlation was significant with similar correlation coef- ficients as in Figures 3 and 4, it was clear that there was Figure 5. Regression of AR on Raw; AR 1 = 2.515 + (0.157 × Raw); R2 = 0.167; p < 0.001. a great degree of leverage in points towards the extremes of each. The correlation between 2 commonly used indi- ces of lung function, FEV1 and PEF (Table 2) showed that some 2/3 of the variance of one was explained by the other. Finally, we compared bronchodilator associated changes in indices of lung function between FEV1 and APD measurements. The mean change in FEV1 with bron- chodilator in the 28 patients in whom data were obtained pre and post bronchodilator was relatively small: 0.10 ± 0.23 L. The correlations between changes in APD meas- urements and FEV1 were not significant: For ER: ΔER = 0.0486 − (0.264 × ΔFEV1), R = 0.103, NS; For AR: ΔAR = 0.00279 − (0.140 × ΔFEV 1), R = 0.063; For IR: ΔIR = 0.0257 − (0.416 × ΔFEV1), R = 0.178. 4. Discussion We compared measurements commonly used to assess lung function in the pulmonary function laboratory with those obtained using the APD. While significant correla- tions were found, only 7% - 17% of the variance in APD measurements was explained by FEV1, PEF or Raw. Further, there was no correlation between the change in FEV1 and APD measurements with bronchodilator. In the ensuing discussion we review these findings in the light of the current available literature. To our knowledge this is the largest group of subjects in which changes in APD and other assessments of lung function were compared. Further, the other studies cited included normal healthy subjects. The current study in- cludes unselected patients referred to the pulmonary function lab for a variety of indications as determined by their attending providers. As shown by the figures and Table 2, the correlations with FEV1, PEF, and Raw, although going in the ex- pected directions, and statistically significant, are not tight, with only 7% - 17% of the variance of one being explained by the other. By contrast, the correlation be- Copyright © 2013 SciRes. OJRD  T. HAQUE ET AL. Copyright © 2013 SciRes. OJRD 67 tween FEV1 and PEF, that are forced expiratory maneu- vers, was excellent, with some 2/3 of the variance in one explained by the other. It is important to bear in mind that the various meas- ures of pulmonary function actually measure different aspects of respiratory mechanics. FEV1 and PEF are cer- tainly responsive to changes in airways resistance; how- ever, they are also very dependent on patient effort. Raw, measured in the body plethysmograph, is sensitive to changes in flow-resistance of the airways, but excludes lung and chest wall tissue resistance. The APD measures total respiratory resistance, and includes a large compo- nent of upper airways resistance (see [8]). The most practical use for the APD would likely be to follow pa- tients with lung disease serially at home given the ease of use and low cost of this device. We had hoped that the measurement of serial function before and after bron- chodilator would simulate serial measurements for stan- dard spirometry compared with APD. Unfortunately, few patients had bronchodilator studies ordered, and the overall change in FEV1 with bronchodilator was small (approximately 100 cc). Finally, in a recent study [15], the intrasubject variability of APD measurements was assessed. It was found that the largest portion of the variability of measurements was in fact due to changes within the subject and not to changes within the APD, strengthening our argument that the device would be most useful for serial measurements in patients with lung disease. In sum, there are significant correlations between APD derived measures of respiratory resistance and measures derived from standard pulmonary function testing. The variance explained was less than that between commonly used measures of pulmonary function. Studies should be directed at the evaluation of efficacy of serial measure- ments over time in patients with respiratory disease. REFERENCES [1] A. M. Dubois, S. Y. Botelho and J. H. Comroe Jr., “A New Method for Measuring Airway Resistance in Man Using a Body Plethysmograph: Values in Normal Sub- jects and in Patients with Respiratory Disease,” Journal of Clinical Investigation, Vol. 35, No. 3, 1956, pp. 327- 335. doi:10.1172/JCI103282 [2] K. Von Neergard and K. Wirz, “Die Messimg. Der Stromungwiderstande in den Atemwegen des Menschen Insbespondere bie Asthma und Emphysema,” Zeitschrift fur Klinische Medizine, Vol. 105, 1927, pp. 51-82. [3] A. M. DuBois, A. W. Brody, D. H. Lewis and B. F. Bur- gess, “Oscillation Mechanics of Lungs and Chest in Man,” Journal of Applied Physiology, Vol. 8, No. 6, 1956, pp. 587-594. [4] H. J. Smith, P. Reinhold and M. D. Goldman, “Forced Oscillation Technique and Impulse Oscillometry,” Euro- pean Respiratory Journal, Vol. 31, 2005, pp. 72-105. [5] A. T. Johnson, C.-S. Lin and J. N. Hochheimer, “Airflow Perturbation Device for Measuring Airway Resistance of Humans and Animals,” IEEE Transactions on Biomedical Engineering, Vol. 31, No. 9, 1984, pp. 622-626. doi:10.1109/TBME.1984.325306 [6] C. G. Lausted and A. T. Johnson, “Airflow Perturbation Device for Measureing Human Respiratory Resistance,” Proceedings of the IEEE 24th Annual Northeast Confer- ence, 9-10 April 1998, pp. 97-99. [7] A. T. Johnson and M. S. Sahota, “Validation of Airflow Perturbation Device Resistance Measurements in Excised Sheep Lungs,” Physiological Measurement, Vol. 25, No. 5, 2004, pp. 679-690. doi:10.1088/0967-3334/25/3/008 [8] D. C. Coursey, S. M. Scharf and A. T. Johnson, “Com- paring Pulmonary Resistance Measured with an Eso- phageal Balloon to Resistance and Measurements with an Airflow Perturbation Device,” Physiological Measure- ment, Vol. 31, No. 7, 2010, pp. 921-934. doi:10.1088/0967-3334/31/7/004 [9] D. C. Coursey, S. M. Scharf and A. T. Johnson, “Com- parison of the Expiratory Isovolume Pressure Flow Rela- tionship Generated with Stop-Flow and Esophageal Bal- loon Methods,” Respiratory Care, Vol. 56, No. 7, 2011, pp. 969-975. doi:10.4187/respcare.01037 [10] N. K. Silverman, A. T. Johnson, W. H. Scott and F. C. Koh, “Exercise-Induced Respiratory Resistance Changes as Measured with the Airflow Perturbation Device,” Physiological Measurement, Vol. 26, No. 1, 2005, pp. 29- 38. doi:10.1088/0967-3334/26/1/003 [11] M. R. Miller, J. Hankinson, V. Brusasco, F. Burgos, R. Casaburi, A. Coates, R. Crapo, P. Enright, C. P. M. van der Grinten, P. Gustafsson, R. Jensen, D. C. Johnson, N. MacIntyre, R. McKay, D. Navajas, O. F. Pedersen, R. Pellegrino, G. Viegi and J. Wanger, “Standardisation of Lung Function Testing: Standardisation of Spirometry,” European Respiratory Journal, Vol. 26, No. 2, 2005, pp. 319-338. doi:10.1183/09031936.05.00034805 [12] J. Wanger, J. L. Clausen, A. Coates, O. F. Pedersen, V. Brusasco, F. Burgos, R. Casaburi, R. Crapo, P. Enright, C. P. M. van der Grinten, P. Gustafsson, J. Hankinson, R. Jensen, D. Johnson, N. MacIntyre, R. McKay, M. R. Miller, D. Navajas, R. Pellegrino and G. Viegi, “Stan- dardisation of the Measurement of Lung Volumes,” European Respiratory Journal, Vol. 26, No. 3, 2005, pp. 511-522. doi:10.1183/09031936.05.00035005 [13] J. F. Morris, A. Koski and L. C. Johnson, “Spirometric Standards for Healthy Non-Smoking Adults,” American Review of Respiratory Disease, Vol. 103, 1971, pp. 57- 67. [14] R. O. Crapo, A. H. Morris, P. D. Clayton and C. R. Nixon, “Lung Volumes in Healthy Nonsmoking Adults,” Bulletin Européen de Physiopathologie Respiratoire, Vol. 18, No. 3, 1982, pp. 419-425. [15] A. T. Johnson, S. C. Jones, J. J. Pan and J. Vosoughi, “Variation of Respiratory Resistance Suggests Optimiza- tion of Airway Caliber,” IEEE Transactions on Biomedi- cal Engineering, Vol. 59, No. 8, 2012, pp. 2355-2361. doi:10.1109/TBME.2012.2204055 |