

Paper Menu >>
Journal Menu >>
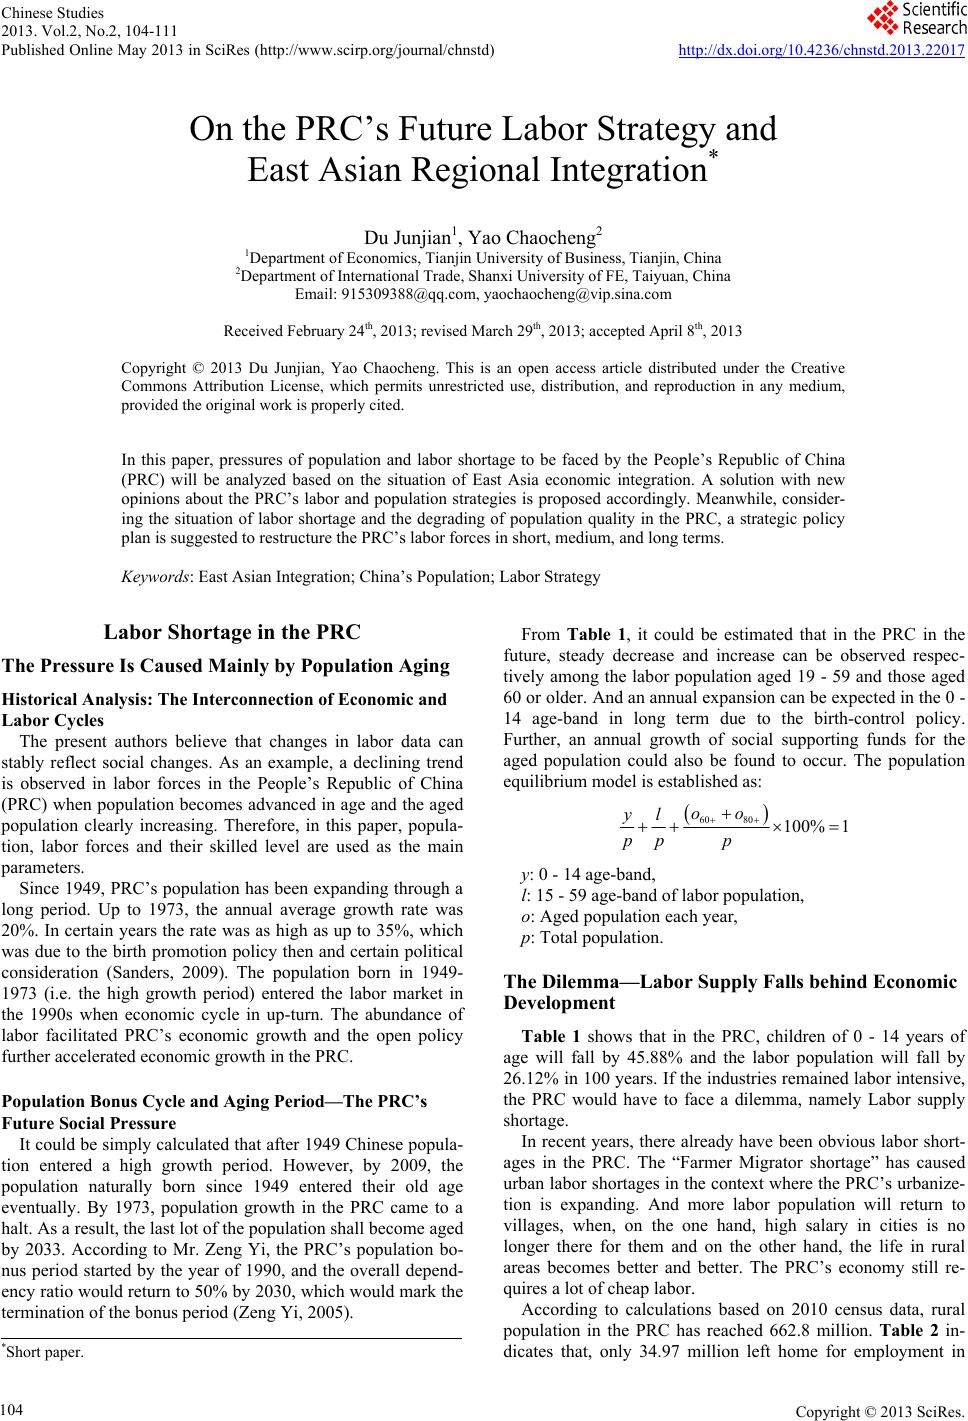 Chinese Studies 2013. Vol.2, No.2, 104-111 Published Online May 2013 in SciRes (http://www.scirp.org/journal/chnstd) http://dx.doi.org/10.4236/chnstd.2013.22017 Copyright © 2013 SciRes. 104 On the PRC’s Future Labor Strategy and East Asian Regional Integration* Du Junjian1, Yao Chaocheng2 1Department of Economics, Tianjin University of Business, Tianjin, China 2Department of International Trade, Shanxi University of FE, Taiyuan, China Email: [email protected], ya[email protected] Received February 24th, 2013; revised March 29th, 2013; accepted April 8th, 2013 Copyright © 2013 Du Junjian, Yao Chaocheng. This is an open access article distributed under the Creative Commons Attribution License, which permits unrestricted use, distribution, and reproduction in any medium, provided the original work is properly cited. In this paper, pressures of population and labor shortage to be faced by the People’s Republic of China (PRC) will be analyzed based on the situation of East Asia economic integration. A solution with new opinions about the PRC’s labor and population strategies is proposed accordingly. Meanwhile, consider- ing the situation of labor shortage and the degrading of population quality in the PRC, a strategic policy plan is suggested to restructure the PRC’s labor forces in short, medium, and long terms. Keywords: East Asian Integration; China’s Population; Labor Strategy Labor Shortage in the PRC The Pressure Is Caused Mainly by Population Aging Historical Analysis: The Interconnection of Economic and Labor Cycles The present authors believe that changes in labor data can stably reflect social changes. As an example, a declining trend is observed in labor forces in the People’s Republic of China (PRC) when population becomes advanced in age and the aged population clearly increasing. Therefore, in this paper, popula- tion, labor forces and their skilled level are used as the main parameters. Since 1949, PRC’s population has been expanding through a long period. Up to 1973, the annual average growth rate was 20%. In certain years the rate was as high as up to 35%, which was due to the birth promotion policy then and certain political consideration (Sanders, 2009). The population born in 1949- 1973 (i.e. the high growth period) entered the labor market in the 1990s when economic cycle in up-turn. The abundance of labor facilitated PRC’s economic growth and the open policy further accelerated economic growth in the PRC. Population Bonus Cycle and Aging Peri od—The P RC’s Future Social Pressure It could be simply calculated that after 1949 Chinese popula- tion entered a high growth period. However, by 2009, the population naturally born since 1949 entered their old age eventually. By 1973, population growth in the PRC came to a halt. As a result, the last lot of the population shall become aged by 2033. According to Mr. Zeng Yi, the PRC’s population bo- nus period started by the year of 1990, and the overall depend- ency ratio would return to 50% by 2030, which would mark the termination of the bonus period (Zeng Yi, 2005). From Table 1, it could be estimated that in the PRC in the future, steady decrease and increase can be observed respec- tively among the labor population aged 19 - 59 and those aged 60 or older. And an annual expansion can be expected in the 0 - 14 age-band in long term due to the birth-control policy. Further, an annual growth of social supporting funds for the aged population could also be found to occur. The population equilibrium model is established as: 6080 100% 1 oo yl pp p y: 0 - 14 age-band, l: 15 - 59 age-band of labor population, o: Aged population each year, p: Total population. The Dilemma—Labor Supply Falls behind Economic Development Table 1 shows that in the PRC, children of 0 - 14 years of age will fall by 45.88% and the labor population will fall by 26.12% in 100 years. If the industries remained labor intensive, the PRC would have to face a dilemma, namely Labor supply shortage. In recent years, there already have been obvious labor short- ages in the PRC. The “Farmer Migrator shortage” has caused urban labor shortages in the context where the PRC’s urbanize- tion is expanding. And more labor population will return to villages, when, on the one hand, high salary in cities is no longer there for them and on the other hand, the life in rural areas becomes better and better. The PRC’s economy still re- quires a lot of cheap labor. According to calculations based on 2010 census data, rural population in the PRC has reached 662.8 million. Table 2 in- dicates that, only 34.97 million left home for employment in *Short paper. 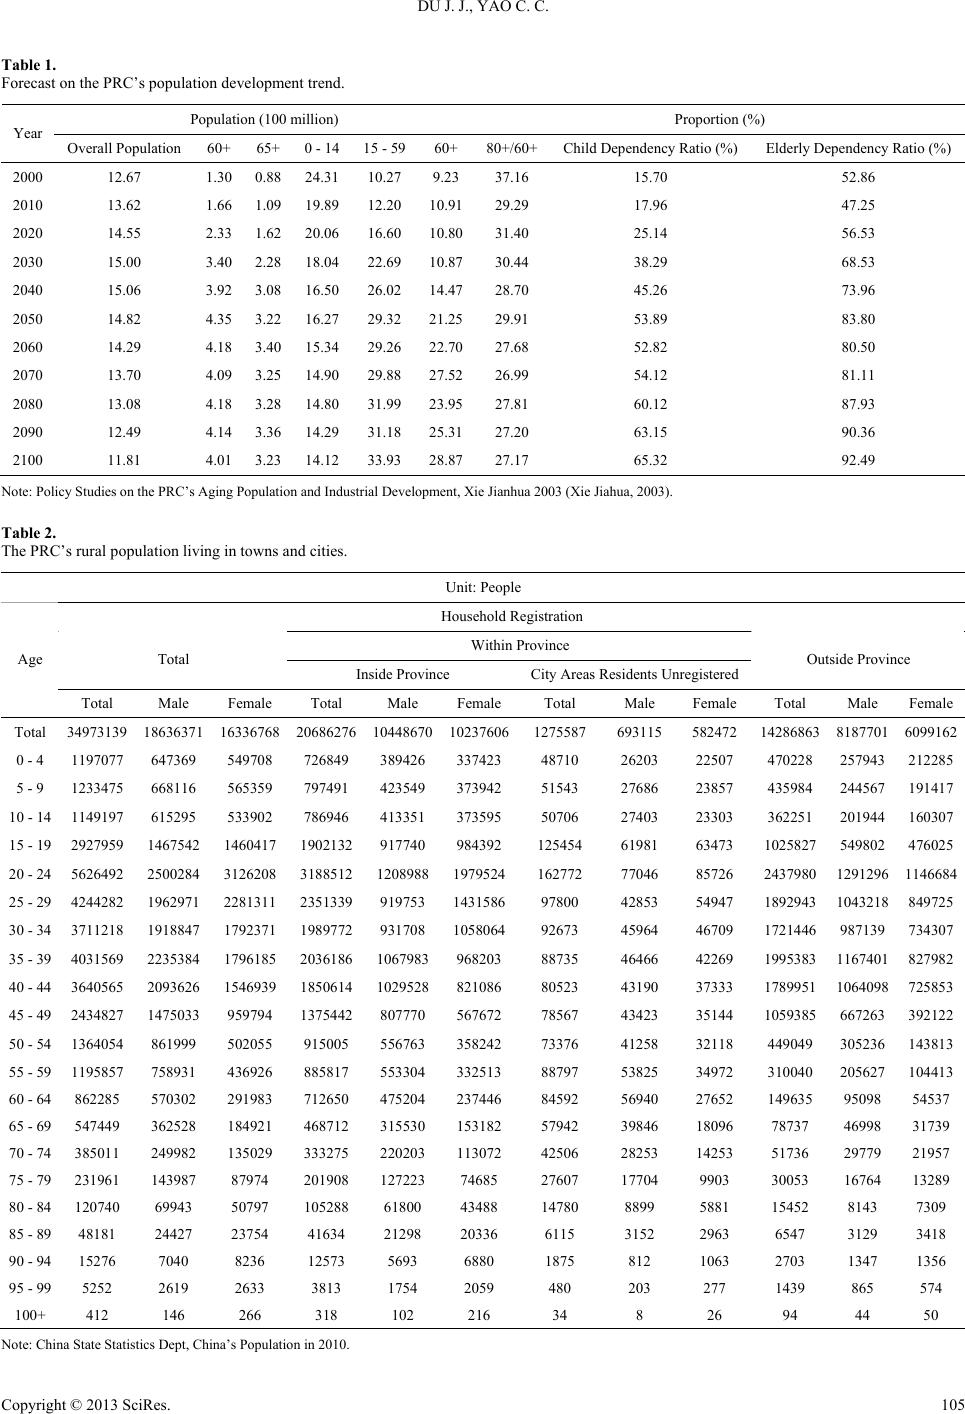 DU J. J., YAO C. C. Table 1. Forecast on the PRC’s population development trend. Population (100 million) Proportion (%) Year Overall Population 60+ 65+ 0 - 14 15 - 5960+ 80+/60+ Child Dependency Ratio (%) Elderly Dependency Ratio (%) 2000 12.67 1.30 0.88 24.31 10.27 9.23 37.16 15.70 52.86 2010 13.62 1.66 1.09 19.89 12.20 10.9129.29 17.96 47.25 2020 14.55 2.33 1.62 20.06 16.60 10.8031.40 25.14 56.53 2030 15.00 3.40 2.28 18.04 22.69 10.8730.44 38.29 68.53 2040 15.06 3.92 3.08 16.50 26.02 14.4728.70 45.26 73.96 2050 14.82 4.35 3.22 16.27 29.32 21.2529.91 53.89 83.80 2060 14.29 4.18 3.40 15.34 29.26 22.7027.68 52.82 80.50 2070 13.70 4.09 3.25 14.90 29.88 27.5226.99 54.12 81.11 2080 13.08 4.18 3.28 14.80 31.99 23.9527.81 60.12 87.93 2090 12.49 4.14 3.36 14.29 31.18 25.3127.20 63.15 90.36 2100 11.81 4.01 3.23 14.12 33.93 28.8727.17 65.32 92.49 Note: Policy Studies on the PRC’s Aging Population and Industrial Development, Xie Jianhua 2003 (Xie Jiahua, 2003). Table 2. The PRC’s rural population living in towns and cities. Unit: People Household Registration Within Province Total Inside Province City Areas Residents Unregistered Outside Province Age Total Male Female Total Male Female Total Male Female Total Male Female Total 34973139 18636371 16336768 20686276 10448670102376061275587 693115 582472 14286863 81877016099162 0 - 4 1197077 647369 549708 726849 389426 337423 48710 26203 22507 470228 257943212285 5 - 9 1233475 668116 565359 797491 423549 373942 51543 27686 23857 435984 244567191417 10 - 14 1149197 615295 533902 786946 413351 373595 50706 27403 23303 362251 201944160307 15 - 19 2927959 1467542 1460417 1902132 917740 984392 125454 61981 63473 1025827 549802476025 20 - 24 5626492 2500284 3126208 3188512 12089881979524162772 77046 85726 2437980 12912961146684 25 - 29 4244282 1962971 2281311 2351339 919753 143158697800 42853 54947 1892943 1043218849725 30 - 34 3711218 1918847 1792371 1989772 931708 105806492673 45964 46709 1721446 987139734307 35 - 39 4031569 2235384 1796185 2036186 1067983968203 88735 46466 42269 1995383 1167401827982 40 - 44 3640565 2093626 1546939 1850614 1029528821086 80523 43190 37333 1789951 1064098725853 45 - 49 2434827 1475033 959794 1375442 807770 567672 78567 43423 35144 1059385 667263392122 50 - 54 1364054 861999 502055 915005 556763 358242 73376 41258 32118 449049 305236143813 55 - 59 1195857 758931 436926 885817 553304 332513 88797 53825 34972 310040 205627104413 60 - 64 862285 570302 291983 712650 475204 237446 84592 56940 27652 149635 95098 54537 65 - 69 547449 362528 184921 468712 315530 153182 57942 39846 18096 78737 46998 31739 70 - 74 385011 249982 135029 333275 220203 113072 42506 28253 14253 51736 29779 21957 75 - 79 231961 143987 87974 201908 127223 74685 27607 17704 9903 30053 16764 13289 80 - 84 120740 69943 50797 105288 61800 43488 14780 8899 5881 15452 8143 7309 85 - 89 48181 24427 23754 41634 21298 20336 6115 3152 2963 6547 3129 3418 90 - 94 15276 7040 8236 12573 5693 6880 1875 812 1063 2703 1347 1356 95 - 99 5252 2619 2633 3813 1754 2059 480 203 277 1439 865 574 100+ 412 146 266 318 102 216 34 8 26 94 44 50 Note: China State Statistics Dept, China’s Population in 2010. Copyright © 2013 SciRes. 105 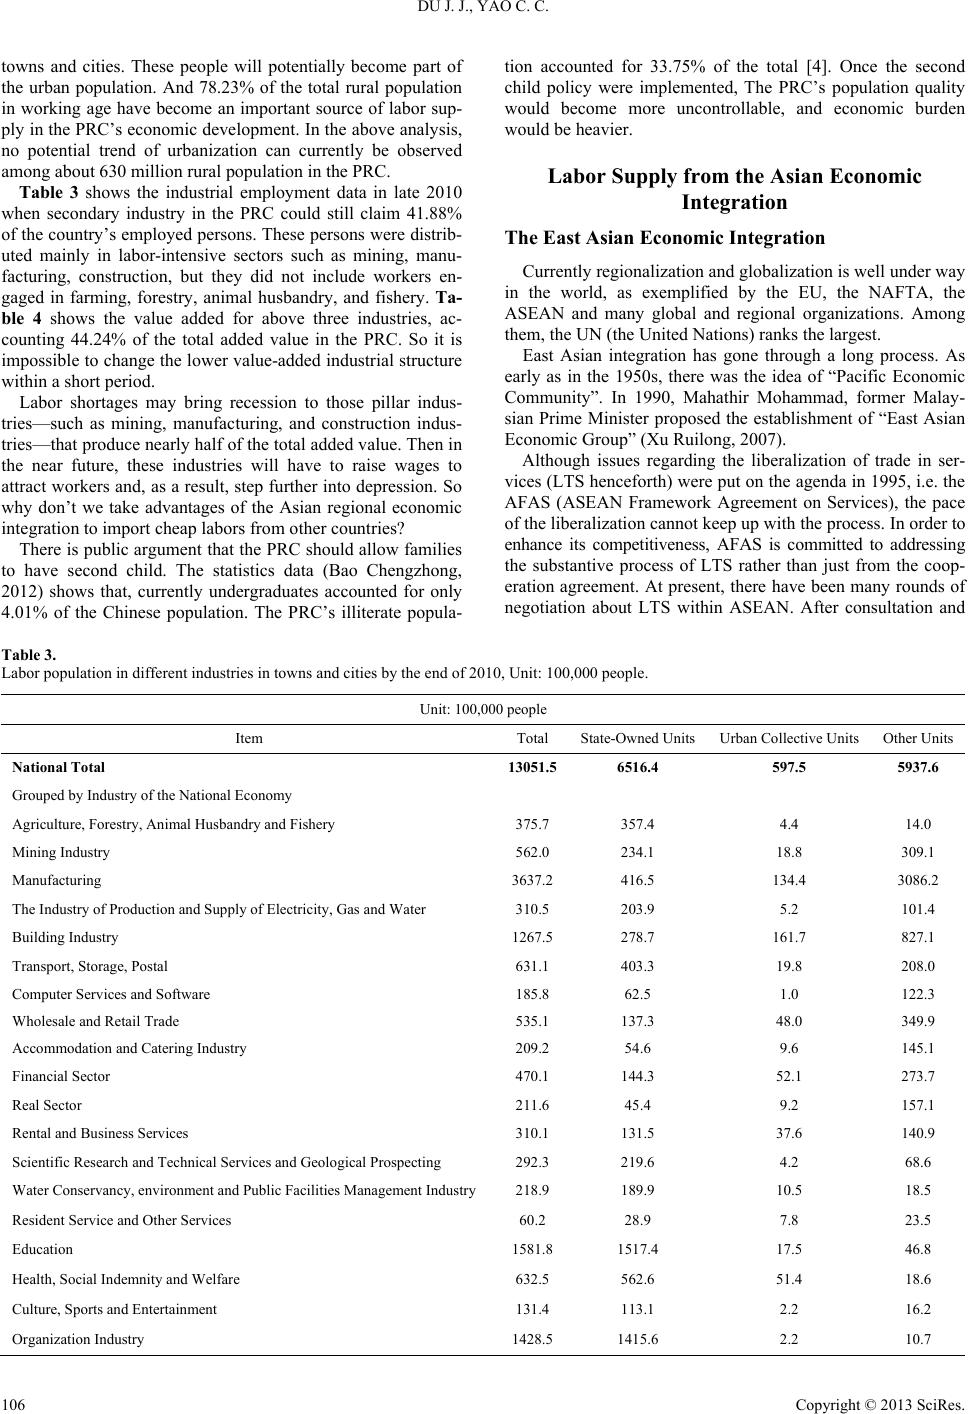 DU J. J., YAO C. C. towns and cities. These people will potentially become part of the urban population. And 78.23% of the total rural population in working age have become an important source of labor sup- ply in the PRC’s economic development. In the above analysis, no potential trend of urbanization can currently be observed among about 630 million rural population in the PRC. Table 3 shows the industrial employment data in late 2010 when secondary industry in the PRC could still claim 41.88% of the country’s employed persons. These persons were distrib- uted mainly in labor-intensive sectors such as mining, manu- facturing, construction, but they did not include workers en- gaged in farming, forestry, animal husbandry, and fishery. Ta- ble 4 shows the value added for above three industries, ac- counting 44.24% of the total added value in the PRC. So it is impossible to change the lower value-added industrial structure within a short period. Labor shortages may bring recession to those pillar indus- tries—such as mining, manufacturing, and construction indus- tries—that produce nearly half of the total added value. Then in the near future, these industries will have to raise wages to attract workers and, as a result, step further into depression. So why don’t we take advantages of the Asian regional economic integration to import cheap labors from other countries? There is public argument that the PRC should allow families to have second child. The statistics data (Bao Chengzhong, 2012) shows that, currently undergraduates accounted for only 4.01% of the Chinese population. The PRC’s illiterate popula- tion accounted for 33.75% of the total [4]. Once the second child policy were implemented, The PRC’s population quality would become more uncontrollable, and economic burden would be heavier. Labor Supply from the Asian Economic Integration The East Asian Economic Integration Currently regionalization and globalization is well under way in the world, as exemplified by the EU, the NAFTA, the ASEAN and many global and regional organizations. Among them, the UN (the United Nations) ranks the largest. East Asian integration has gone through a long process. As early as in the 1950s, there was the idea of “Pacific Economic Community”. In 1990, Mahathir Mohammad, former Malay- sian Prime Minister proposed the establishment of “East Asian Economic Group” (Xu Ruilong, 2007). Although issues regarding the liberalization of trade in ser- vices (LTS henceforth) were put on the agenda in 1995, i.e. the AFAS (ASEAN Framework Agreement on Services), the pace of the liberalization cannot keep up with the process. In order to enhance its competitiveness, AFAS is committed to addressing the substantive process of LTS rather than just from the coop- eration agreement. At present, there have been many rounds of negotiation about LTS within ASEAN. After consultation and Table 3. Labor population in different industries in towns and cities by the end of 2010, Unit: 100,000 people. Unit: 100,000 people Item Total State-Owned UnitsUrban Collective Units Other Units National Total 13051.56516.4 597.5 5937.6 Grouped by Industry of the National Economy Agriculture, Forestry, Animal Husbandry and Fishery 375.7 357.4 4.4 14.0 Mining Industry 562.0 234.1 18.8 309.1 Manufacturing 3637.2 416.5 134.4 3086.2 The Industry of Production and Supply of Electricity, Gas and Water 310.5 203.9 5.2 101.4 Building Industry 1267.5 278.7 161.7 827.1 Transport, Storage, Postal 631.1 403.3 19.8 208.0 Computer Services and Software 185.8 62.5 1.0 122.3 Wholesale and Retail Trade 535.1 137.3 48.0 349.9 Accommodation and Catering Industry 209.2 54.6 9.6 145.1 Financial Sector 470.1 144.3 52.1 273.7 Real Sector 211.6 45.4 9.2 157.1 Rental and Business Services 310.1 131.5 37.6 140.9 Scientific Research and Technical Services and Geological Prospecting 292.3 219.6 4.2 68.6 Water Conservancy, environment and Public Facilities Management Industry 218.9 189.9 10.5 18.5 Resident Service and Other Services 60.2 28.9 7.8 23.5 Education 1581.8 1517.4 17.5 46.8 Health, Social Indemnity and Welfare 632.5 562.6 51.4 18.6 Culture, Sports and Entertainment 131.4 113.1 2.2 16.2 Organization Industry 1428.5 1415.6 2.2 10.7 Copyright © 2013 SciRes. 106 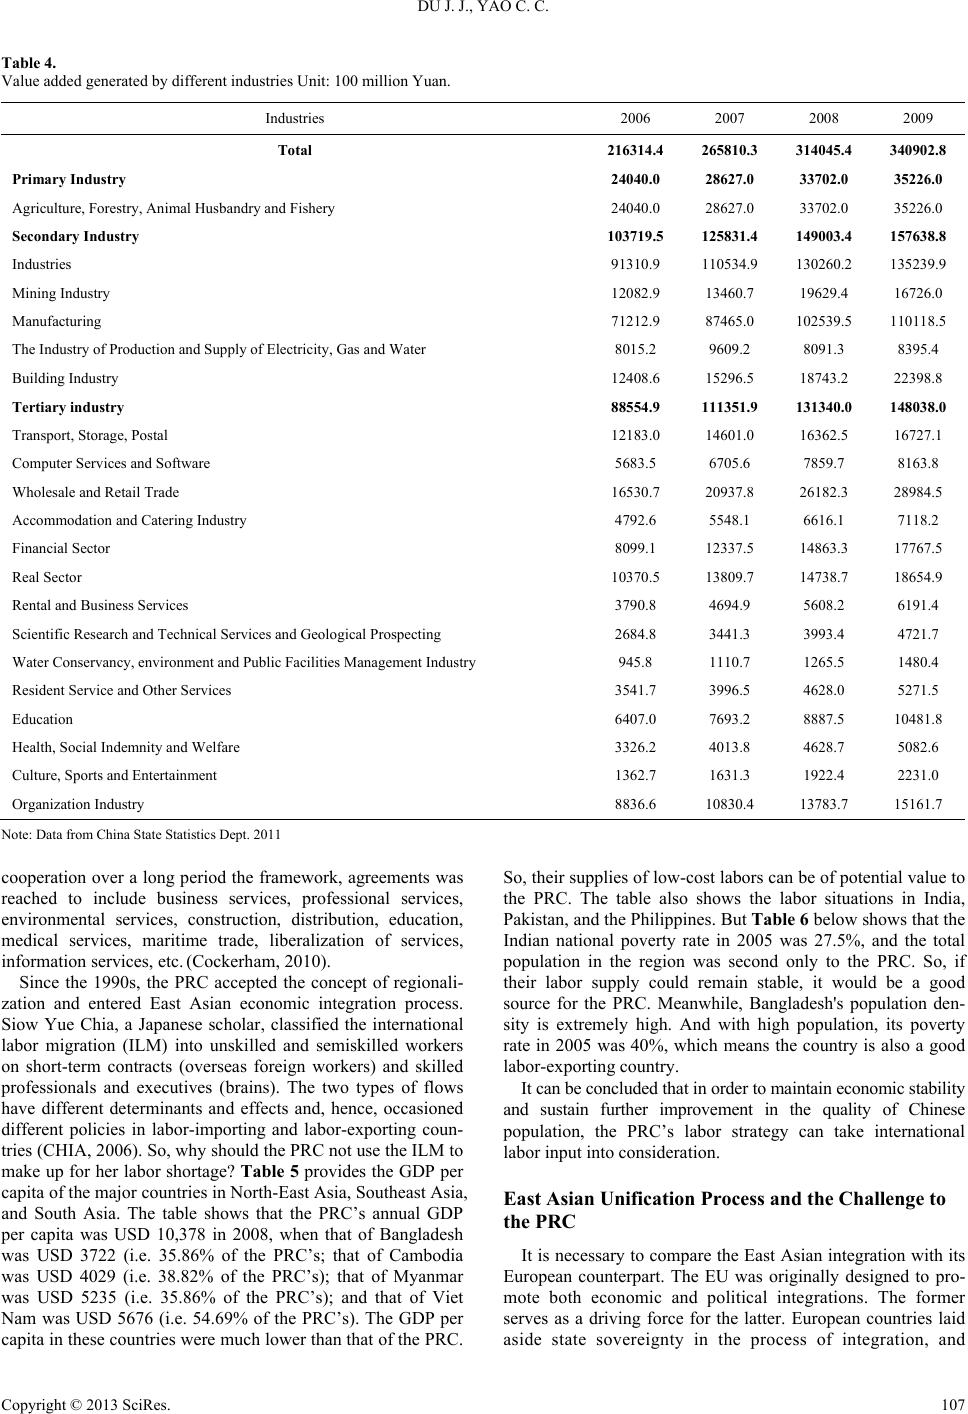 DU J. J., YAO C. C. Table 4. Value added generated by different industries Unit: 100 million Yuan. Industries 2006 2007 2008 2009 Total 216314.4 265810.3 314045.4 340902.8 Primary Indu stry 24040.0 28627.0 33702.0 35226.0 Agriculture, Forestry, Animal Husbandry and Fishery 24040.0 28627.0 33702.0 35226.0 Secondary Industry 103719.5 125831.4 149003.4 157638.8 Industries 91310.9 110534.9 130260.2 135239.9 Mining Industry 12082.9 13460.7 19629.4 16726.0 Manufacturing 71212.9 87465.0 102539.5 110118.5 The Industry of Production and Supply of Electricity, Gas and Water 8015.2 9609.2 8091.3 8395.4 Building Industry 12408.6 15296.5 18743.2 22398.8 Tertiary industry 88554.9 111351.9 131340.0 148038.0 Transport, Storage, Postal 12183.0 14601.0 16362.5 16727.1 Computer Services and Software 5683.5 6705.6 7859.7 8163.8 Wholesale and Retail Trade 16530.7 20937.8 26182.3 28984.5 Accommodation and Catering Industry 4792.6 5548.1 6616.1 7118.2 Financial Sector 8099.1 12337.5 14863.3 17767.5 Real Sector 10370.5 13809.7 14738.7 18654.9 Rental and Business Services 3790.8 4694.9 5608.2 6191.4 Scientific Research and Technical Services and Geological Prospecting 2684.8 3441.3 3993.4 4721.7 Water Conservancy, environment and Public Facilities Management Industry 945.8 1110.7 1265.5 1480.4 Resident Service and Other Services 3541.7 3996.5 4628.0 5271.5 Education 6407.0 7693.2 8887.5 10481.8 Health, Social Indemnity and Welfare 3326.2 4013.8 4628.7 5082.6 Culture, Sports and Entertainment 1362.7 1631.3 1922.4 2231.0 Organization Industry 8836.6 10830.4 13783.7 15161.7 Note: Data from China State Statistics Dept. 2011 cooperation over a long period the framework, agreements was reached to include business services, professional services, environmental services, construction, distribution, education, medical services, maritime trade, liberalization of services, information services, etc. (Cockerham, 2010). Since the 1990s, the PRC accepted the concept of regionali- zation and entered East Asian economic integration process. Siow Yue Chia, a Japanese scholar, classified the international labor migration (ILM) into unskilled and semiskilled workers on short-term contracts (overseas foreign workers) and skilled professionals and executives (brains). The two types of flows have different determinants and effects and, hence, occasioned different policies in labor-importing and labor-exporting coun- tries (CHIA, 2006). So, why should the PRC not use the ILM to make up for her labor shortage? Table 5 provides the GDP per capita of the major countries in North-East Asia, Southeast Asia, and South Asia. The table shows that the PRC’s annual GDP per capita was USD 10,378 in 2008, when that of Bangladesh was USD 3722 (i.e. 35.86% of the PRC’s; that of Cambodia was USD 4029 (i.e. 38.82% of the PRC’s); that of Myanmar was USD 5235 (i.e. 35.86% of the PRC’s); and that of Viet Nam was USD 5676 (i.e. 54.69% of the PRC’s). The GDP per capita in these countries were much lower than that of the PRC. So, their supplies of low-cost labors can be of potential value to the PRC. The table also shows the labor situations in India, Pakistan, and the Philippines. But Table 6 below shows that the Indian national poverty rate in 2005 was 27.5%, and the total population in the region was second only to the PRC. So, if their labor supply could remain stable, it would be a good source for the PRC. Meanwhile, Bangladesh's population den- sity is extremely high. And with high population, its poverty rate in 2005 was 40%, which means the country is also a good labor-exporting country. It can be concluded that in order to maintain economic stability and sustain further improvement in the quality of Chinese population, the PRC’s labor strategy can take international labor input into consideration. East Asian Unification Process and the Challenge to the PRC It is necessary to compare the East Asian integration with its European counterpart. The EU was originally designed to pro- mote both economic and political integrations. The former serves as a driving force for the latter. European countries laid side state sovereignty in the process of integration, and a Copyright © 2013 SciRes. 107  DU J. J., YAO C. C. Table 5. GDP per capita in USD (purchasing power parity averaged, based on USD exchange rate 1990. Unit: USD Country or Area 2000 2004 2005 2006 2007 2008 World 13912 15238 15726 16281 16891 17307 High Income 45259 47801 48374 49004 49503 49952 Middle Income 7161 8679 9206 9811 10516 11020 Upper Middle Income 8052 10075 10747 11537 12483 13158 Lower Middle Income 5850 6656 6997 7371 7764 8071 Low and Middle Income 6658 8026 8504 9049 9687 10137 Low Income 2170 2432 2547 2667 2794 2880 China 4660 7048 7710 8536 9574 10378 Hong Kong, China 45644 51079 53714 56305 58517 58605 Bangladesh 2827 3192 3308 3446 3587 3722 Cambodia 3101 3011 3341 3613 3881 4029 India 5061 5879 6276 6714 7124 7445 Indonesia 7926 9056 9547 9944 10312 10671 Japan 40771 43461 44113 44829 45687 45587 Korea, Rep. 31826 35798 36813 38210 39628 40261 Malaysia 20118 22360 23398 24197 25091 25590 Myanmar 3006 4083 4450 4828 5202 5235 Pakistan 7524 7834 8378 8149 8589 8950 Philippines 7034 7246 7389 7687 8066 8260 Singapore 42940 46082 48821 47771 48274 45786 Sri Lanka 11120 10874 11362 12945 13947 14916 Thailand 12638 13961 14374 14926 15393 15548 Viet Nam 3803 4553 4832 5133 5456 5676 Note: World Bank WDI Database. Authors’ compilation. Table 6. Poverty rates (%). Country or Area Year National Rural Urban China 2005 2.5 Bangladesh 2005 40 43.8 28.4 Cambodia 2007 30.1 34.5 11.8 India 2005 27.5 28.3 25.7 Indonesia 2010 13.3 16.6 9.9 Mongolia 2008 35.2 46.6 26.9 Myanmar 2005 32 22 Nepal 2004 30.9 34.6 9.6 Pakistan 2006 22.3 27 13.1 Philippines 2009 26.5 Viet Nam 2008 14.5 18.7 3.3 N ote: World Bank WDI Database. Compiled by the authors. Copyright © 2013 SciRes. 108  DU J. J., YAO C. C. boosted the regionalization step by step (Mostura & Beuth, 2003). However the ASEAN was aimed more at “economic cooperation” (in an idea of “Open Regionalism”) than at inte- gration in its strict sense. Apart from the ASEAN, the APEC focus more on market facilitated economic cooperation and the promotion of economic development and economic liberaliza- tion, while trying to avoid political and security issues (Sudsa- wasd, 2011). The South-East Asia has a diversified culture including profound religious, ethnic, and linguistic differences. The regional integration in East Asia would be slower than that in Europe. As Michael North and Barnard Turuer pointed out, “Re- gional integration may also be enhanced by growing political, economic, and cultural interdependence and exchange, since the exchange of people, capital, know-how, and innovations are no longer hindered by political borders. The ILM issue belongs to the exchange of people (North, 2010). From Table 7 we can see that, since the ASEAN established in 1967, 54 public service agreements were signed, mainly for industrial projects, energy, transport, education, training, envi- ronment, and so on; but there were no labor supply and service agreements. The PRC could, based on the 10 + 3 cooperation scheme, ease her labor shortage by importing labors and nego- tiating about labor service cooperation agreements, including southern Asian nations (Dent, 2009). With the accession of new members, the cooperation may cover more tasks, including those in labor services. To supply excessive labors to the PRC may largely be in accordance with the original intent of coop- eration. The cooperation, as it deepens, may ease the regional tension to certain extent. Theoretically the idea should be feasible. Of course capital flows (to make international capital investments in lower labor cost regions) can be faster than labor flows in the regional inte- gration process. In accordance with general equilibrium eco- nomic theory, this argument was valid. However, in reality, capital redistribution also involves the cost of time. O days □ C Capital Transition Period ≤ P Population Transition Period Table 7. Types of integration in common services of ASEAN’s principal agreements, 1967-2007. Types of service Number of agreements with types of integration Industrial Projects 8 Energy 7 Transportation 7 Scientific 6 Education and training 4 Environment 3 Tourism 3 Agriculture 3 Telecommunications 3 Public administration 2 Cultural activities 2 Emergency 2 Forestry 2 Water 1 Engineering 1 Architecture 1 Nursing 1 Surveying 1 Legal 1 Investments 1 Finance 1 Customs 1 Cosmetics 1 Health 1 Investments 1 Currency Exchange 1 Total number of agreements 54 Note: Agreement may include more than one type of integration. Copyright © 2013 SciRes. 109  DU J. J., YAO C. C. Obviously, the formula is established. It should be noted that findings in this are derived from a short-range analysis of the PRC’s population strategy rather than an examination of a medium or long term development. So such a fundamental premise of this discussion should be mean- ingful. But it must be pointed out that the PRC needs to open her labor market to the world, and should combine this policy with outsourcing business, industrial restructuring and upgrading. Taking advantage of East Asia regional integration can rebal- ance the human resource supply and demand in the PRC and, in so doing, avoid the international capital investment risks. In a short term, this strategy will be able to fill the gap in labor sup- ply that has emerged in the PRC, a gap that may cause social instability. According to Table 3, there are 57.777 million peo- ple engaged in such four main sectors as mining, manufacturing, construction, electricity gas and water supply. As much as 37.04% of the manufacturing had been restructured by the time of the survey. The other three sectors were still in need of large number of unskilled and semi-skilled labors in long-term. At the same time, the PRC’s secondary industry—mainly the manufacturing industry, an industry that takes up 62.96% of the total workforce—still need to be restructured. This is a huge and difficult task that cannot be fulfilled within one day. Therefore, capital transfers and international labor migration in bilateral initiatives can be of help to circumvent capital idle period before transferring, ensure effective capital utilization, and cover up the labor shortage. At the same time, the Indus- tries can capitalize the employment gap profitably. By that we mean to open the PRC’s labor market, to improve the popula- tion quality in the PRC, to import sufficient qualified labor to the country, to win the time and opportunity over the next dec- ade, and thereby to bring a new economic growth cycle in China. Meanwhile, the strategy would provide the PRC a longer pe- riod of social stability before future explosion of the aged population occurs. The strategy would also help combat the harm caused by unfair employment. The number of skilled and educated workforce decides the optimization of allocation scale of capital. At present, the PRC’s skilled and educated work- force remains limited, and there needs to be a huge amount of finance to support the future aging population. Perhaps in future the PRC may still need manufacturing, for instance the em- ployment number continues to increase in construction industry in recent years when the PRC reaches 50% of urbanization. The PRC may really need short-term international help with regard to labor supply. Walking into the Asian economic unification would be one significant step for the PRC. Conclusion By 2030, the PRC will truly meet 50% of the total population dependency ratio. Now they still have a bonus period of 18 years. One cycle of the skilled population takes at least 30 years to grow up after adequate training. The PRC’s population is currently following a trend of inversed elimination and time is needed to counter-reverse the trend. The improvement in popu- lation qual- ity would need a longer period. At present, the lower income industries excluding farming, forestry, animal husbandry and fishery contributed 44.24% of total added value in the PRC. Therefore, it would be irrational to make massive industrial restructuring. At present, the core target of the family planning policy to stabilize the low fertility level should not be changed. The PRC’s population must be controlled strictly and effectively. Cooperations among Asian nations are all necessary regard- less of the lengths of their terms. The first step should go for short-term to take advantage of the East Asian integration framework and to negotiate labor service cooperation. The barri- ers should be removed and the policy cost and economic cost should be reduced through negotiations. Mutual trust should be built up, so that foreign labor costs can gradually match the do- mestic costs to make up for the current labor shortage in the PRC. Following formulas show the social wealth equilibrium model under the ideal conditions: short shortshort long longlong shortGDP wageshrotstagestage longGDP wagelongstagestage ,1,18 ,min, 18, H H HLLPC HLLPC H—Social wealth generated by skilled population —Annual accumulated social wealth L —Social wealth generated and wages paid from foreign cheap labors C—Training costs for skilled population P—Costs supporting the Aging population , condition exists when rupture of Asian integration and war occur, the factor tending to 0. As the integration process tends to perform better,the factor tending to 1, i.e. [0,1] , refers to the economic return rate contributed by the PRC’s skilled population in a short term of 1 - 18 years on the condition of incompleted employment; , refers to the economic return rate contributed by the PRC’s skilled population in a long term of over 18 years in the condition of completed employment, i.e. ; short stage , refers to uncertain factors,according to situation changes in the PRC. The first formula tells us that when the PRC’s total popula- tion raising rate rises above 50% and ranges 1 - 18 years of short- term population strategy, the PRC’s social total annual wealth volume is balanced by the high expenditures of the skilled population and the expenditures for lower margin of the ageing population, corresponding to the limited industries of high value added limited by number of high quality population, and continuing to maintain huge scale of pillar but low added value industries. The second formula shows that, after implementing the me- dium and long-term population strategy for 18 years, the PRC’s annual accumulated wealth will be balanced by skilled popula- tion and high expenditure, and the expenditure to support the gradually increased older population. REFERENCES Bao Chengzhong 鲍成中(2012). Woguo gaodeng jiaoyu jingfei de baozhang he shiyong 我国高等教育经费的保障和使用. Jiaoyu Zhengce Yanjiu, 9, 9-12. CHIA, S. Y. (2006). Labor mobility and East Asian integration. Asian Copyright © 2013 SciRes. 110  DU J. J., YAO C. C. Economic Policy Review, 1, 349-367. doi:10.1111/j.1748-3131.2006.00042.x Cockerham, G. B. (2010). Institutional design of ASEAN and regional integration. East Asia, 27, 165-185. doi:10.1007/s12140-009-9092-1 Mostura, S., Beuth, H. W. (2003). Europe’s big two may be a model for Asia. South China Morning Post, 2003. Sanders, A. M. K. (2009). Population issue (p. 381). Beijing: Business Books Publisher. Sasatra, S. (2011). Trade integration in East Asia: An empirical assessment. Modern Economy, 3, 319-329. doi:10.4236/me.2012.33042 Xie Jianhua谢建华(2003). Zhongguo laolingchanye fazhan de lilun yu zhengcewenti yanjiu 中国老龄产业发展的理论与政策问题研究. Journal of China Academy of Social Sc i e nce, 8, 16-18. http://www.stats.gov.cn/tjgb/ndtjgb/qgndtjgb/t20110228_402705692. htm Xu Ruilong 许瑞龙(2007). Qianxi yazhou yitihua jincheng huanman de yuanyin 浅析亚洲一体化进程缓慢的原因. Jinri Hubei, 3, 32-33. Zeng Yi曾毅(2005). Zhongguo renkou laohua, tuixiujin quekou yu nongcun yanglaojin baozhang 中国人口老化, 退休金缺口与农村 养老保障. Jingji Xue, 4, 1043-1066. Copyright © 2013 SciRes. 111 |