

Paper Menu >>
Journal Menu >>
 Chinese Studies 2013. Vol.2, No.2, 77-83 Published Online May 2013 in SciRes (http://www.scirp.org/journal/chnstd) http://dx.doi.org/10.4236/chnstd.2013.22011 Copyright © 2013 SciRes. 77 Age Distribution of a Zero-Growth Population: Implications for China Song Jian1,2 1Chinese Academy of Engineering, Beijing, China 2Chinese Academy of Sciences, Beijing, China Email: [email protected] Received December 2nd, 2012; revised February 17th, 2013; accepted March 7th, 2013 Copyright © 2013 Song Jian. This is an open access article distributed under the Creative Commons Attribution License, which permits unrestricted use, distribution, and reproduction in any medium, provided the original work is properly cited. It is generally accepted that zero-growth population would be the long-term destiny of any population. China’s population is expected to reach 1.4 billion with zero-growth around 2030, if the low fertility pol- icy continues up to then. Demographic dynamics indicate that the age composition of a steady zero- growth society would asymptotically approach the population mix of today’s many developed countries. Here we present a brief analysis and some insights into the age composition of a zero-growth society and the connectedness between total fertility rate, net reproduction rate and replacement level of fertility. Other formulas useful for demographic studies are also provided to further the analysis. Our results reveal that the age composition of China’s population in 2050 would be similar to those of some developed countries today. We argue that the misgivings about “population aging” or the fear of a “winter of human- ity” in China stem from rather oversimplified estimations. Keywords: Age Composition; Zero-Growth Population; Total Fertility; Replacement Level; Population Aging; China Introduction It is self-evident that, given the size of the Earth’s surface and its limited resources, the number of human population that the Earth or a country can support cannot be infinite. In 2011, the world population reached 7.0 billion, with an annual growth rate of 1.2% since 2000. It is projected that the world’s total population is likely to exceed 9.3 billion by the middle of the century (United Nations Population Division, 2011). Mainland China (hereafter China) has now 15.2 million newborns every year, a net growth of 5.03 million and a natural growth rate of 0.445 percent in 2011. Under the medium scenario (i.e., total fertility rate ranges from 1.5 - 1.8 in the projection period), China’s population would reach as high as 1.48 billion by the middle of the century. In the context of scarcity in land and water, even one per thousand annual growth is likely to be un- sustainable in the long run. There is a consensus that China has witnessed the demo- graphic transition and achieved a noticeable economic growth within three decades (Hussain, 2002). The success of family planning program has contributed the lion’s share to this de- velopment (Li, 2009). According to the United Nations Popula- tion Division (UNPD) (2011), China’s total fertility rate has dropped from 5.0 in 1970 to around 1.5 - 1.7 at present, which is below the replacement level of fertility for 15 consecutive years. It is projected that China’s population will be stabilized at 1.4 billion in the years of 2025-2030 if the current fertility rate follows its predicted trajectory from a Bayesian Hierarchi- cal Model that captures the world’s fertility evolution trajectory and China’s own historical trend (Raftery et al., 2012; UNPD, 2011). From a long-term perspective, most countries in the world will have to achieve zero population growth eventually. However, lowering total fertility rate, extending life expec- tancy at birth, and heightening the median age of a population would all imply inevitably the increase of the percentage of the elderly population. This is what some Chinese scholars have been concerned about recently. They began talking about “population aging”, “senior boom” and even fears of a “winter of humanity” (e.g., Wang, 2005; Zou & Yang, 2009). The aims of this paper are: 1) to derive the demographic in- dicators, including age distribution, of a zero-growth population from population dynamics; and 2) to compare the age distribu- tion of China’s population in 2050 with that of a zero-growth population given the similar life expectancy. Demographic Dynamics Stationary population, aka zero growth population, has long been extensively discussed in research literature and many textbooks (e.g., Keyfitz, 1973; Preston, Heuveline, & Guillot, 2001; Ryder, 1975). Because a life table or model life table population is a stationary population, previous studies, in most cases, rarely linked it with a real population when they were addressing the age structure of a stationary population, for no real population was (or close to) a stationary population thirty or forty years ago. Instead, they used the distribution in a life table or model life table at a given mortality level. This is justi- fiable and acceptable, although age distribution of a real popu- 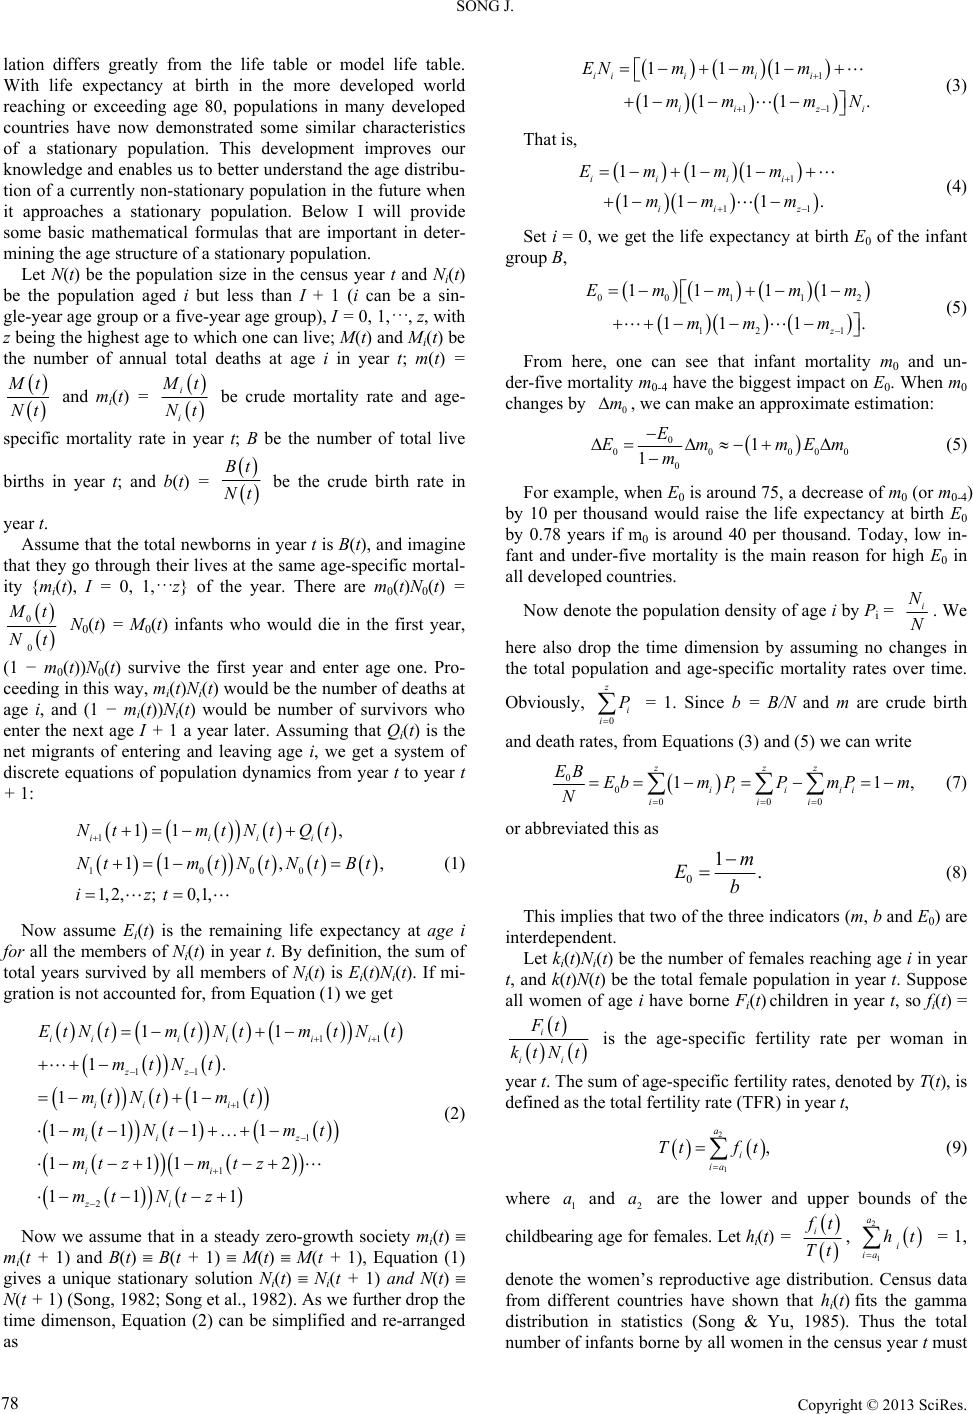 SONG J. lation differs greatly from the life table or model life table. With life expectancy at birth in the more developed world reaching or exceeding age 80, populations in many developed countries have now demonstrated some similar characteristics of a stationary population. This development improves our knowledge and enables us to better understand the age distribu- tion of a currently non-stationary population in the future when it approaches a stationary population. Below I will provide some basic mathematical formulas that are important in deter- mining the age structure of a stationary population. Let N(t) be the population size in the census year t and Ni(t) be the population aged i but less than I + 1 (i can be a sin- gle-year age group or a five-year age group), I = 0, 1,···, z, with z being the highest age to which one can live; M(t) and Mi(t) be the number of annual total deaths at age i in year t; m(t) = M t N t and mi(t) = i i M t N t be crude mortality rate and age- specific mortality rate in year t; B be the number of total live births in year t; and b(t) = B t N t be the crude birth rate in year t. Assume that the total newborns in year t is B(t), and imagine that they go through their lives at the same age-specific mortal- ity {mi(t), I = 0, 1,···z} of the year. There are m0(t)N0(t) = 0 0 M t N t N 0(t) = M0(t) infants who would die in the first year, (1 − m 0(t))N0(t) survive the first year and enter age one. Pro- ceeding in this way, mi(t)Ni(t) would be the number of deaths at age i, and (1 − m i(t))Ni(t) would be number of survivors who enter the next age I + 1 a year later. Assuming that Qi(t) is the net migrants of entering and leaving age i, we get a system of discrete equations of population dynamics from year t to year t + 1: 1 1000 11 , 11 , 1,2,; 0,1, iiii Nt mtNtQt , N tmtNtNtB izt t (1) Now assume Ei(t) is the remaining life expectancy at age i for all the members of Ni(t) in year t. By definition, the sum of total years survived by all members of Ni(t) is Ei(t)Ni(t). If mi- gration is not accounted for, from Equation (1) we get 11 11 1 1 1 2 11 1. 11 1111 111 2 111 iii iii zz ii i ii z ii zi EtNtmt Ntmt Nt mtNt mt Ntmt mtNtm t mt zmt z mt Ntz (2) Now we assume that in a steady zero-growth society mi(t) mi(t + 1) and B(t) B(t + 1) M(t) M(t + 1), Equation (1) gives a unique stationary solution Ni(t) Ni(t + 1) and N(t) N(t + 1) (Song, 1982; Song et al., 1982). As we further drop the time dimenson, Equation (2) can be simplified and re-arranged as 1 11 111 11 1 iiii i ii z ENmm m mm mN . i (3) That is, 1 11 111 11 1 ii ii ii z Em mm mm m . (4) Set i = 0, we get the life expectancy at birth E0 of the infant group B, 001 1 12 1 11 11 11 1 z Emm mm mm m 2 . (5) From here, one can see that infant mortality m0 and un- der-five mortality m0-4 have the biggest impact on E0. When m0 changes by 0 m , we can make an approximate estimation: 0 000 0 1 1 E EmmE m 00 m (5) For example, when E0 is around 75, a decrease of m0 (or m0-4) by 10 per thousand would raise the life expectancy at birth E0 by 0.78 years if m0 is around 40 per thousand. Today, low in- fant and under-five mortality is the main reason for high E0 in all developed countries. Now denote the population density of age i by Pi = i N N . We here also drop the time dimension by assuming no changes in the total population and age-specific mortality rates over time. Obviously, 0 z i i P = 1. Since b = B/N and m are crude birth and death rates, from Equations (3) and (5) we can write 0 0 000 11 zzz ii iii iii EB Ebm PPmPm N , (7) or abbreviated this as 0 1. m Eb (8) This implies that two of the three indicators (m, b and E0) are interdependent. Let ki(t)Ni(t) be the number of females reaching age i in year t, and k(t)N(t) be the total female population in year t. Suppose all women of age i have borne Fi(t) children in year t, so fi(t) = i ii Ft ktNt is the age-specific fertility rate per woman in year t. The sum of age-specific fertility rates, denoted by T(t), is defined as the total fertility rate (TFR) in year t, 2 1 , a i ia Ttf t (9) where and are the lower and upper bounds of the 1 a2 a childbearing age for females. Let hi(t) = i f t Tt , = 1, 2 1 a i ia ht denote the women’s reproductive age distribution. Census data from different countries have shown that hi(t) fits the gamma distribution in statistics (Song & Yu, 1985). Thus the total number of infants borne by all women in the census year t must Copyright © 2013 SciRes. 78 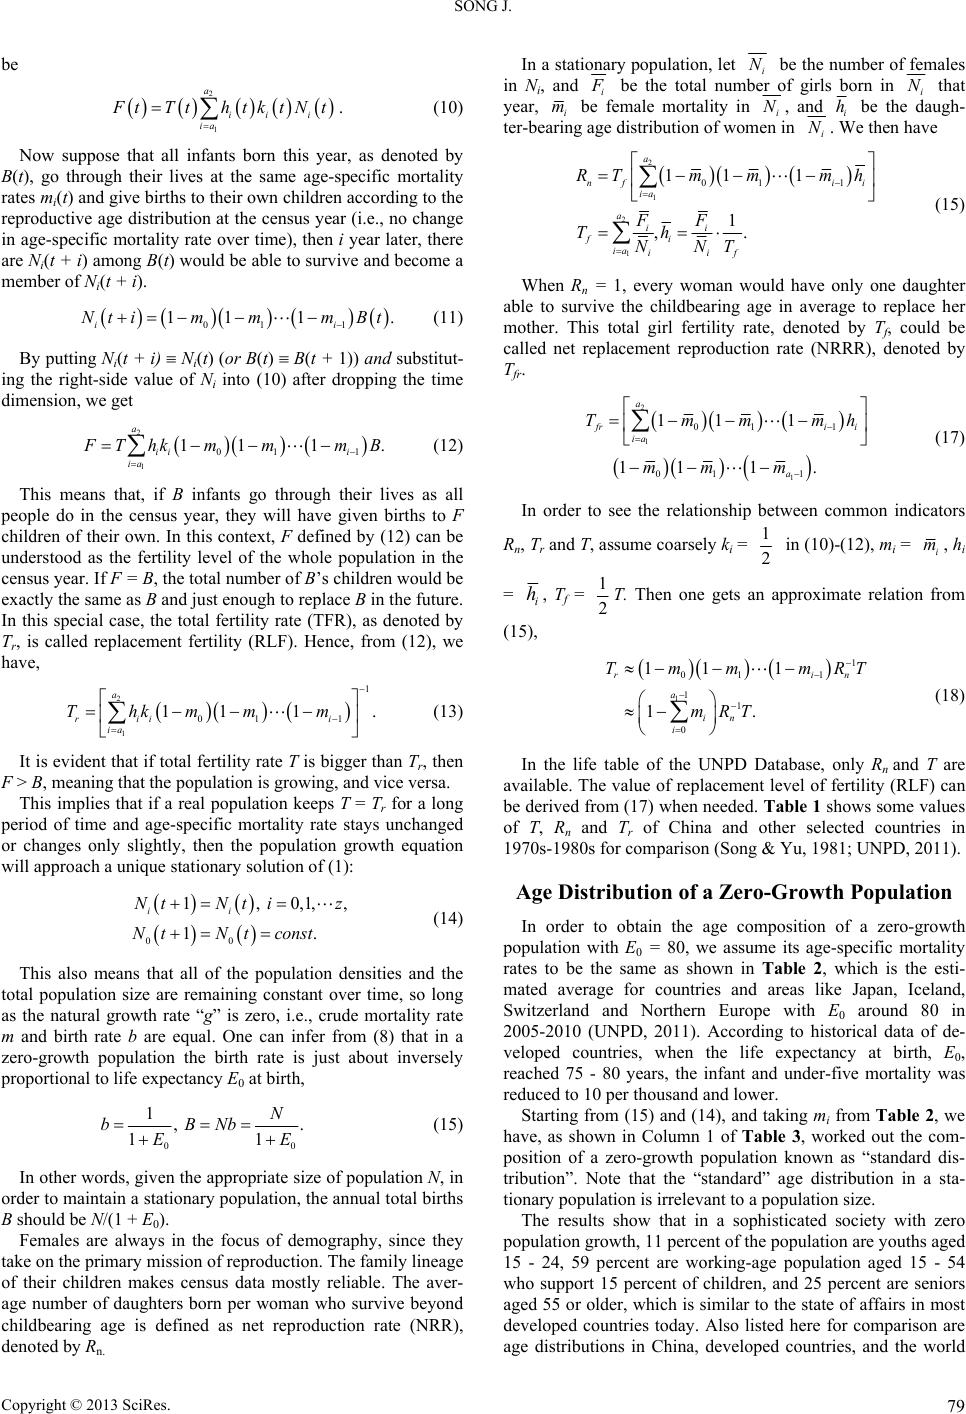 SONG J. be 2 1 a ii i ia FtTth tktNt . (10) Now suppose that all infants born this year, as denoted by B(t), go through their lives at the same age-specific mortality rates mi(t) and give births to their own children according to the reproductive age distribution at the census year (i.e., no change in age-specific mortality rate over time), then i year later, there are Ni(t + i) among B(t) would be able to survive and become a member of Ni(t + i). 011 11 1 i. i N timmm Bt (11) By putting Ni(t + i) Ni(t) (or B(t) B(t + 1)) and substitut- ing the right-side value of Ni into (10) after dropping the time dimension, we get 2 1 011 11 1 a ii i ia FThkmmm B . (12) This means that, if B infants go through their lives as all people do in the census year, they will have given births to F children of their own. In this context, F defined by (12) can be understood as the fertility level of the whole population in the census year. If F = B, the total number of B’s children would be exactly the same as B and just enough to replace B in the future. In this special case, the total fertility rate (TFR), as denoted by Tr, is called replacement fertility (RLF). Hence, from (12), we have, 2 1 1 01 1 11 1 a rii i ia Thkmm m . (13) It is evident that if total fertility rate T is bigger than Tr, then F > B, meaning that the population is growing, and vice versa. This implies that if a real population keeps T = Tr for a long period of time and age-specific mortality rate stays unchanged or changes only slightly, then the population growth equation will approach a unique stationary solution of (1): 00 1, 0,1, 1. ii , N tNti NtNtconst z (14) This also means that all of the population densities and the total population size are remaining constant over time, so long as the natural growth rate “g” is zero, i.e., crude mortality rate m and birth rate b are equal. One can infer from (8) that in a zero-growth population the birth rate is just about inversely proportional to life expectancy E0 at birth, 00 1, . 11 N bBNb EE (15) In other words, given the appropriate size of population N, in order to maintain a stationary population, the annual total births B should be N/(1 + E0). Females are always in the focus of demography, since they take on the primary mission of reproduction. The family lineage of their children makes census data mostly reliable. The aver- age number of daughters born per woman who survive beyond childbearing age is defined as net reproduction rate (NRR), denoted by Rn. In a stationary population, let i N be the number of females in Ni, and i F be the total number of girls born in i N that year, i m be female mortality in i N , and i h be the daugh- ter-bearing age distribution of women in i N . We then have 2 1 2 1 011 11 1 1 ,. a nf ii ia a ii fi ia iif R Tmmm FF Th NNT h (15) When Rn = 1, every woman would have only one daughter able to survive the childbearing age in average to replace her mother. This total girl fertility rate, denoted by Tf, could be called net replacement reproduction rate (NRRR), denoted by Tfr. 2 1 1 01 1 01 1 11 1 111. a f ri ia a Tmmm mm m i h (17) In order to see the relationship between common indicators Rn, Tr and T, assume coarsely ki = 1 2 in (10)-(12), mi = i m, hi = i h, Tf = 1 2T. Then one gets an approximate relation from (15), 1 1 01 1 11 0 11 1 1. ri a in i Tmm mR mRT n T (18) In the life table of the UNPD Database, only Rn and T are available. The value of replacement level of fertility (RLF) can be derived from (17) when needed. Table 1 shows some values of T, Rn and Tr of China and other selected countries in 1970s-1980s for comparison (Song & Yu, 1981; UNPD, 2011). Age Distribution of a Zero-Growth Population In order to obtain the age composition of a zero-growth population with E0 = 80, we assume its age-specific mortality rates to be the same as shown in Table 2, which is the esti- mated average for countries and areas like Japan, Iceland, Switzerland and Northern Europe with E0 around 80 in 2005-2010 (UNPD, 2011). According to historical data of de- veloped countries, when the life expectancy at birth, E0, reached 75 - 80 years, the infant and under-five mortality was reduced to 10 per thousand and lower. Starting from (15) and (14), and taking mi from Table 2, we have, as shown in Column 1 of Table 3, worked out the com- position of a zero-growth population known as “standard dis- tribution”. Note that the “standard” age distribution in a sta- tionary population is irrelevant to a population size. The results show that in a sophisticated society with zero population growth, 11 percent of the population are youths aged 15 - 24, 59 percent are working-age population aged 15 - 54 who support 15 percent of children, and 25 percent are seniors aged 55 or older, which is similar to the state of affairs in most developed countries today. Also listed here for comparison are age distributions in China, developed countries, and the world Copyright © 2013 SciRes. 79 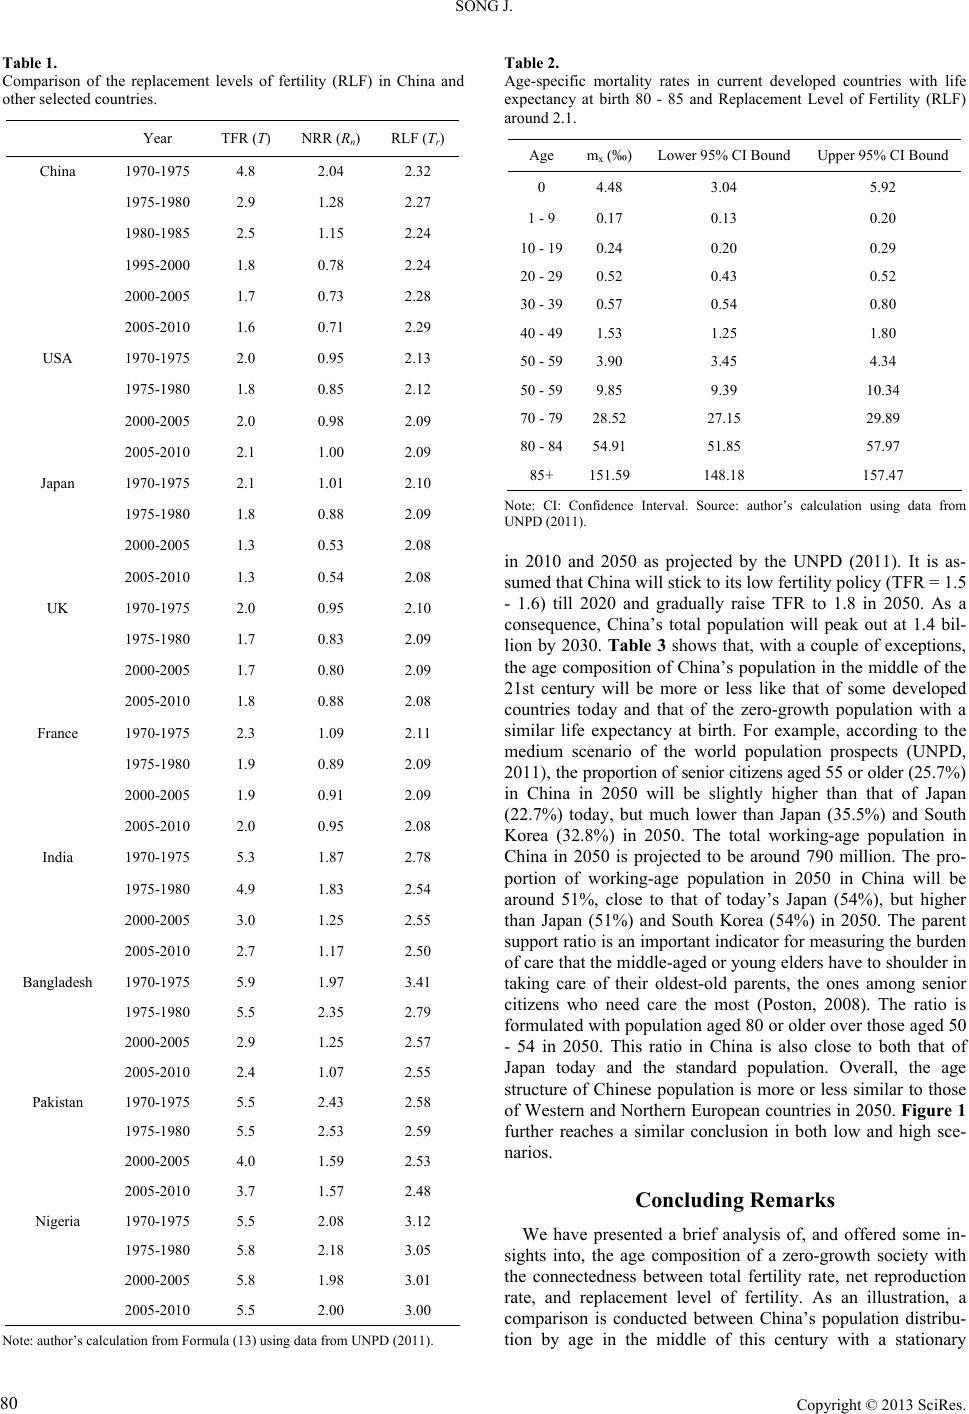 SONG J. Table 1. Comparison of the replacement levels of fertility (RLF) in China and other selected countries. Year TFR (T) NRR (Rn) RLF (Tr) China 1970-1975 4.8 2.04 2.32 1975-1980 2.9 1.28 2.27 1980-1985 2.5 1.15 2.24 1995-2000 1.8 0.78 2.24 2000-2005 1.7 0.73 2.28 2005-2010 1.6 0.71 2.29 USA 1970-1975 2.0 0.95 2.13 1975-1980 1.8 0.85 2.12 2000-2005 2.0 0.98 2.09 2005-2010 2.1 1.00 2.09 Japan 1970-1975 2.1 1.01 2.10 1975-1980 1.8 0.88 2.09 2000-2005 1.3 0.53 2.08 2005-2010 1.3 0.54 2.08 UK 1970-1975 2.0 0.95 2.10 1975-1980 1.7 0.83 2.09 2000-2005 1.7 0.80 2.09 2005-2010 1.8 0.88 2.08 France 1970-1975 2.3 1.09 2.11 1975-1980 1.9 0.89 2.09 2000-2005 1.9 0.91 2.09 2005-2010 2.0 0.95 2.08 India 1970-1975 5.3 1.87 2.78 1975-1980 4.9 1.83 2.54 2000-2005 3.0 1.25 2.55 2005-2010 2.7 1.17 2.50 Bangladesh 1970-1975 5.9 1.97 3.41 1975-1980 5.5 2.35 2.79 2000-2005 2.9 1.25 2.57 2005-2010 2.4 1.07 2.55 Pakistan 1970-1975 5.5 2.43 2.58 1975-1980 5.5 2.53 2.59 2000-2005 4.0 1.59 2.53 2005-2010 3.7 1.57 2.48 Nigeria 1970-1975 5.5 2.08 3.12 1975-1980 5.8 2.18 3.05 2000-2005 5.8 1.98 3.01 2005-2010 5.5 2.00 3.00 Note: author’s calculation from Formula (13) using data from UNPD (2011). Table 2. Age-specific mortality rates in current developed countries with life expectancy at birth 80 - 85 and Replacement Level of Fertility (RLF) around 2.1. Age mx (‰)Lower 95% CI Bound Upper 95% CI Bound 0 4.48 3.04 5.92 1 - 9 0.17 0.13 0.20 10 - 190.24 0.20 0.29 20 - 290.52 0.43 0.52 30 - 390.57 0.54 0.80 40 - 491.53 1.25 1.80 50 - 593.90 3.45 4.34 50 - 599.85 9.39 10.34 70 - 7928.52 27.15 29.89 80 - 8454.91 51.85 57.97 85+ 151.59148.18 157.47 Note: CI: Confidence Interval. Source: author’s calculation using data from UNPD (2011). in 2010 and 2050 as projected by the UNPD (2011). It is as- sumed that China will stick to its low fertility policy (TFR = 1.5 - 1.6) till 2020 and gradually raise TFR to 1.8 in 2050. As a consequence, China’s total population will peak out at 1.4 bil- lion by 2030. Table 3 shows that, with a couple of exceptions, the age composition of China’s population in the middle of the 21st century will be more or less like that of some developed countries today and that of the zero-growth population with a similar life expectancy at birth. For example, according to the medium scenario of the world population prospects (UNPD, 2011), the proportion of senior citizens aged 55 or older (25.7%) in China in 2050 will be slightly higher than that of Japan (22.7%) today, but much lower than Japan (35.5%) and South Korea (32.8%) in 2050. The total working-age population in China in 2050 is projected to be around 790 million. The pro- portion of working-age population in 2050 in China will be around 51%, close to that of today’s Japan (54%), but higher than Japan (51%) and South Korea (54%) in 2050. The parent support ratio is an important indicator for measuring the burden of care that the middle-aged or young elders have to shoulder in taking care of their oldest-old parents, the ones among senior citizens who need care the most (Poston, 2008). The ratio is formulated with population aged 80 or older over those aged 50 - 54 in 2050. This ratio in China is also close to both that of Japan today and the standard population. Overall, the age structure of Chinese population is more or less similar to those of Western and Northern European countries in 2050. Figure 1 further reaches a similar conclusion in both low and high sce- narios. Concluding Remarks We have presented a brief analysis of, and offered some in- sights into, the age composition of a zero-growth society with the connectedness between total fertility rate, net reproduction rate, and replacement level of fertility. As an illustration, a comparison is conducted between China’s population distribu- ion by age in the middle of this century with a stationary t Copyright © 2013 SciRes. 80 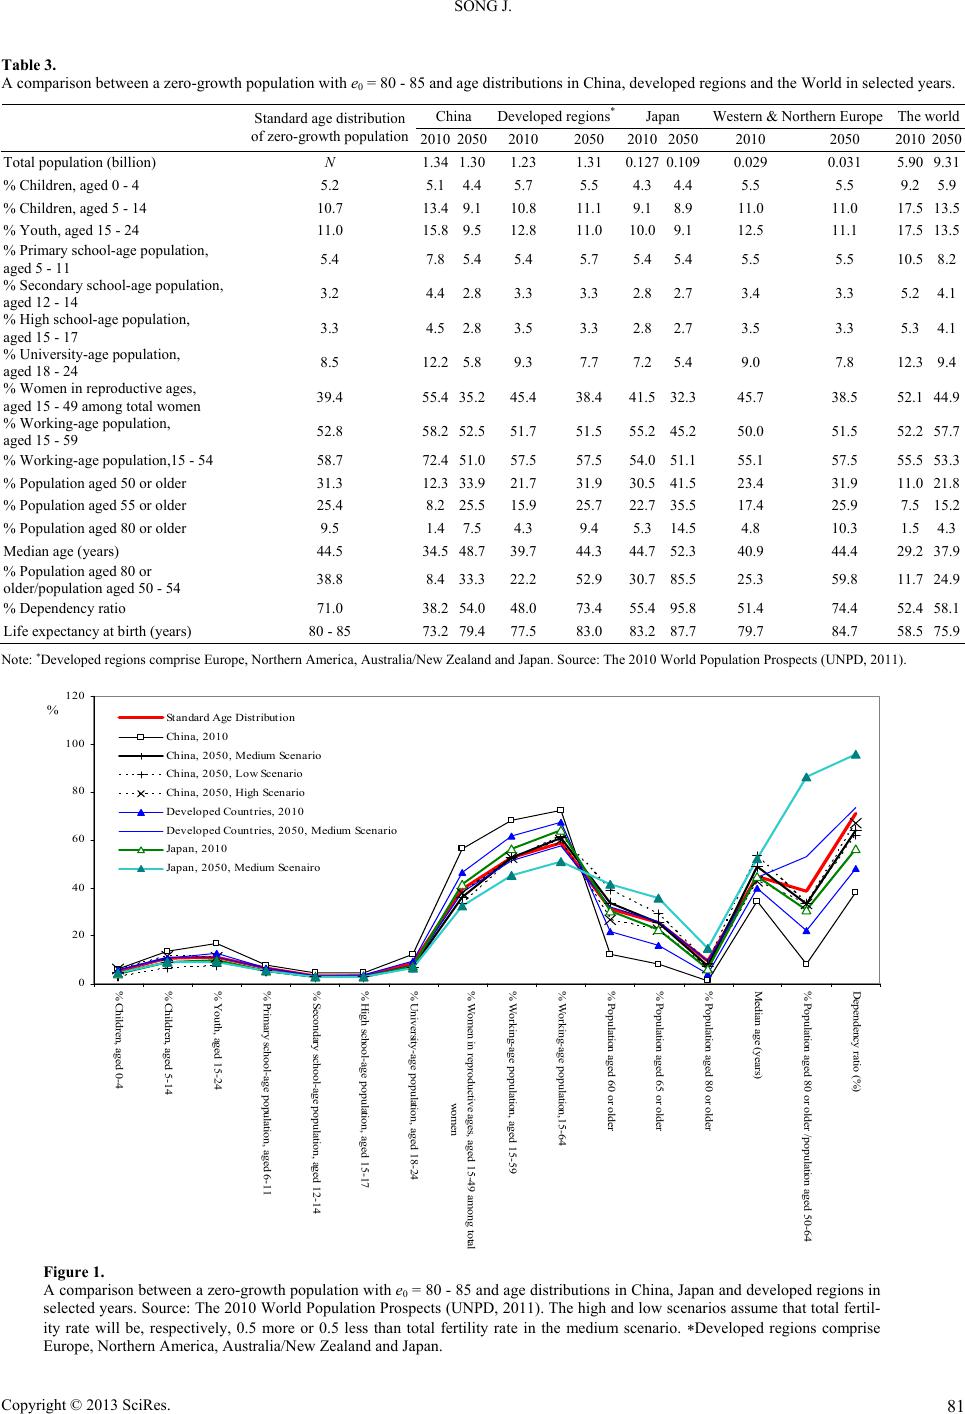 SONG J. Copyright © 2013 SciRes. 81 Table 3. A comparison between a zero-growth population with e0 = 80 - 85 and age distributions in China, developed regions and the World in selected years. China Developed regions*Japan Western & Northern EuropeThe world Standard age distribution of zero-growth population201020502010 2050 201020502010 2050 20102050 Total population (billion) N 1.341.301.23 1.31 0.1270.1090.029 0.031 5.909.31 % Children, aged 0 - 4 5.2 5.14.45.7 5.5 4.34.45.5 5.5 9.25.9 % Children, aged 5 - 14 10.7 13.49.110.8 11.1 9.18.911.0 11.0 17.513.5 % Youth, aged 15 - 24 11.0 15.89.512.8 11.0 10.09.112.5 11.1 17.513.5 % Primary school-age population, aged 5 - 11 5.4 7.85.45.4 5.7 5.45.45.5 5.5 10.58.2 % Secondary school-age population, aged 12 - 14 3.2 4.42.83.3 3.3 2.82.73.4 3.3 5.24.1 % High school-age population, aged 15 - 17 3.3 4.52.83.5 3.3 2.82.73.5 3.3 5.34.1 % University-age population, aged 18 - 24 8.5 12.25.89.3 7.7 7.25.49.0 7.8 12.39.4 % Women in reproductive ages, aged 15 - 49 among total women 39.4 55.435.245.4 38.4 41.532.345.7 38.5 52.144.9 % Working-age population, aged 15 - 59 52.8 58.252.551.7 51.5 55.245.250.0 51.5 52.257.7 % Working-age population,15 - 54 58.7 72.451.057.5 57.5 54.051.155.1 57.5 55.553.3 % Population aged 50 or older 31.3 12.333.921.7 31.9 30.541.523.4 31.9 11.021.8 % Population aged 55 or older 25.4 8.225.515.9 25.7 22.735.517.4 25.9 7.515.2 % Population aged 80 or older 9.5 1.47.54.3 9.4 5.314.54.8 10.3 1.54.3 Median age (years) 44.5 34.548.739.7 44.3 44.752.340.9 44.4 29.237.9 % Population aged 80 or older/population aged 50 - 54 38.8 8.433.322.2 52.9 30.785.525.3 59.8 11.724.9 % Dependency ratio 71.0 38.254.048.0 73.4 55.495.851.4 74.4 52.458.1 Life expectancy at birth (years) 80 - 85 73.279.477.5 83.0 83.287.779.7 84.7 58.575.9 Note: Developed regions comprise Europe, Northern America, Australia/New Zealand and Japan. Source: The 2010 World Population Prospects (UNPD, 2011). 0 20 40 60 80 100 120 % Children, aged 0-4 % Children, aged 5-14 % Youth, aged 15-24 % Primary school-age population, aged 6-11 % Secondary school-age population, aged 12-14 % High school-age population, aged 15-17 % University-age population, aged 18-24 % Women in reproductive ages, aged 15-49 among total women % Working-age population, aged 15-59 % Working-age population,15-64 % Population aged 60 or older % Population aged 65 or older % Population aged 80 or older Median age (years) % Population aged 80 or older /population aged 50-64 Dependency ratio (%) Standard Age Distribution China, 2010 China, 2050, Medium Scenario China, 2050, Low Scenario China, 2050, High Scenario Developed Countries, 2010 Developed Countries, 2050, Medium Scenario Japan, 2010 Japan, 2050, Medium Scenairo % Figure 1. A comparison between a zero-growth population with e0 = 80 - 85 and age distributions in China, Japan and developed regions in selected years. Source: The 2010 World Population Prospects (UNPD, 2011). The high and low scenarios assume that total fertil- ity rate will be, respectively, 0.5 more or 0.5 less than total fertility rate in the medium scenario. Developed regions comprise Europe, Northern America, Australia/New Zealand and Japan.  SONG J. population and its corresponding demographic parameters in some developed countries. We have found that the age compo- sition of China’s population in 2050 will be close to that of some developed countries today, many of developed countries then; and it will also be close to the age composition of a sta- tionary population if the fertility level follows its historical trend with linkage to the world’s fertility evolution trajectory. This finding helps us better understand how the age structure changes from a non-stationary population today to a state close to a zero-population growth in the future. Our results further demonstrate that the proportion of old adults aged 55 or older in the middle of the 21st century is close to that of Japan today but lower than those of Japan and South Korea in 2050. Some researchers recently argued that the ef- fects of changing age structure on economic growth mainly depend on support ratio, a ratio of the effective number of pro- ducers to the effective number of consumers (Lee & Mason, 2011). Considering that 1) health condition of elderly popula- tion is improving (Gu et al., 2009); 2) the postponement of retirement age has recently received increasing attention from both scholars and governments (Gu, 2000; Li, 2012; Zeng, 2007; Zhang, 2012); and 3) productivity would improve in the future, the actual support ratio in China in 2050 would expect to be higher than what some scholar has projected (Miller, 2011). Thus, we argue that the worries of “aging”, a “senior boom”, or a “winter of humanity” lack solid evidence. However, this does not mean that China does not need to pay attention to popula- tion aging. In the contrary, China needs to speed up her devel- opment of policies and facilities to meet elderly care needs, not only because of its sheer size, but also due to the rapid growth (Gu & Vlosky, 2008; Zeng & George, 2010). The roots of the rapid population aging in China do not simply lie in the current fertility policy, but in a combination of a low fertility rate, ris- ing life expectancy, and the cumulative effect of past changes in birth and death rates (Banister, Bloom, & Rosenberg, 2010). How large a population a country can support should be studied comprehensively and systematically by the scientific commu- nity and decided by legislative institutions that are well in- formed of political, economic, resource, and environmental backgrounds and technical factors (Cohen, 1995; Mahadevan et al., 1994; Qian, 1982). However, it is almost certain that having more people will put additional pressure on an already fragile environment (Banister, 1998; Edmonds, 1994; Niu & Harris, 1995). As Confucianism believes, health, longevity, wealth, be- nevolence, and natural death are the five great blessings for human being. It is the eternal pursuit of human societies to improve welfare and healthcare, to reduce mortality rates, and to extend longevity thereby. If everyone lives longer, the aver- age age (median) and the proportion of elders and seniors will increase inevitably. Aging of people does not mean senescence of the whole society after all. A society will become more ma- ture, more experienced, knowledgeable and intelligent (Ogawa, 2008). The youths can share their elders’ accumulated knowl- edge and wisdom, and the old is keen to care the young. This has been the triumphant way of evolution of man and it should be a best frame for an ideal harmonious society in the future. REFERENCES Banister, J. (1998). Population, public health and the environment in China. The China Quarterly, 155, 985-1015. Banister, J., Bloom, D. E., & Rosenberg, L. (2010). Population aging and economic growth in China. Program on the Global Demography of Aging Working Paper No. 53. Boston: Harvard University. http://www.hsph.harvard.edu/pgda/WorkingPapers/2010/PGDA_WP _53.pdf Cai, F., & Wang, M. (2005). Challenge facing China’s economic growth in its aging but not affluent era. China & World Economy, 14, 20-31. doi:10.1111/j.1749-124X.2006.00035.x Cohen, J. E. (1995). How many people can the earth support? New York: Norton & Co. George, A. (2009). 7 billion and counting… New Scientist, 203, 23-24. doi:10.1016/S0262-4079(09)62564-1 Gu, D. & Vlosly, D. A. (2008). Long-term care needs and related issues in China. In J. B. Garner, & T. C. Christiansen (Eds.), Social sci- ences in health care and medicine (pp. 51-84). New York: Nova Publisher. Gu, D. (2000). Thoughts on the redefinition of the old people. Chinese Journal of Population Science, 3, 42-51. doi:10.1016/j.socscimed.2009.03.031 Gu, D., Dupre, M. E., Warner, D., & Zeng, Y. (2009). Changing health status and health expectancies among older adults in China: Gender differences from 1992 to 2002. Social Science and Medicine, 58, 2170-2179. Hussain, A. (2002). Demographic transition in China and its implica- tions. World Development, 30, 1823-1834. doi:10.1016/S0305-750X(02)00070-0 Lee, R., & Mason, A. (2011). Population aging and the generational economy: A global perspective (pp. 151-184). Northampton, MA: Edward Elgar Publishing, Inc. Li, B. (2009). To overcome the greatest pass of the world. An interview with a Minister. Guang-Ming Daily, 15 September 2009 (In Chi- nese). Li, J. (2012). Commission head seeks to raise retirement age. China Daily. http://www.chinadailyapac.com/article/commission-head-seeks-raise -retirement-age Mahadevan, K., Tuan, C.-H., Yu, J., Krishnan, P., & Sumangala, M. (1994). Differential development and demographic dilemma: Per- spectives from China and India. Delhi: B.R. Publishing Corporation. Miller, T. (2011). The rise of the intergenerational state: Aging and development. In R. Lee & A. Mason (Eds.), Population aging and the generational economy: A global perspective (pp. 151-184). Northampton, MA: Edward Elgar Publishing, Inc. Niu, W.-Y., & Harris, W. M. (1995). China: The forecast of its envi- ronmental situation in the 21st century. Journal of Environmental Management, 47, 101-114. doi:10.1006/jema.1996.0039 Ogawa, N. (2008). The Japanese elderly as a social safety set. Asia-Pacific Population Journal, 23, 105-113. www.unescap.org/esid/psis/population/journal/Articles/2008/V23N1 D1.pdf Poston Jr., D. L., & Zeng, Y. (2008). Introduction: Aging and aged dependency in China. In Y. Zeng, D. L. Poston Jr., D. Vlosky, & D. Gu (Eds.), Healthy longevity in China: Demographic, socioeconomic, and psychological dimensions (pp. 1-18). Dordrecht: Springer Pub- lisher. Preston, S. H., Heuveline, P., & Guillot, M. (2001). Demography: Measuring and modeling population processes. Oxford: Blackwell Publishers Ltd. Qian, X. (1982). On system engineering. Beijing: Hunan Science and Technology Press (In Chinese). Raftery, A. E., N. Li, H. Ševčíková, P. Gerland, & Heilig, G. K. (2012). Bayesian probabilistic population projections for all countries. Pro- ceedings of the National Academy of Sciences, 109, 13915-13921. doi:10.1073/pnas.1211452109 Ryder, N. (1975). Notes on stationary populations. Population Index, 41, 3-28. doi:10.2307/2734140 Song, J., & Yu, J. (1985). Population control theory. New York: Springer-Verlag. Song, J., & Yu, J. (1991). Double-edged limit of total fertility rates. Copyright © 2013 SciRes. 82  SONG J. Science China Chemistry, 34, 1354-1361. Song, J., (1982). Some developments in mathematical demography and their application to the People’s Republic of China. Theoretical Population Biology, 22, 470-479. Song, J., Yu, J., Wang, Y., Hu, S., Zhao, Z., Lia, J., Feng, D., & Zhu, G. (1982). Spectral properties of population operators and asymptotic behaviour of population semigroup. Acta Mathematica Scientia, 2, 480-489. United Nations Economic and Social Commission for Asia and the Pacific (ESCAP) (2009). Fifth APPC-Progress in implementation and contribution to development goals. Asia-Pacific Population Journal, 24, 1-228. United Nations Population Division (UNPD) (2011). World population prospect 2010. New York: United Nations. http://esa.un.org/unpd/wpp/index.htm Wang, F. (2005). Can China afford to continue its one-child policy? Asian Pacific Issues. No. 77. Honolulu, HI: East-West Center: www.eastwestcenter.org/fileadmin/stored/pdfs//api077.pdf Zeng, Y. (2007). Options of fertility policy transition in China. Population and Development Review, 33, 215-245. doi:10.1111/j.1728-4457.2007.00168.x Zeng, Y., & George, L. (2010). Population ageing and old-age insur- ance in china. In D. Dannefer, & C. Phillipson (Eds.), The SAGE handbook of social gerontology (pp. 420-430). London: SAGE Pub- lications Ltd. Zhang, J. (2012). Proposal to push retirement age to 55. China.org.cn http://www.china.org.cn/china/2012-07/02/content_25785258.htm Zou, X., & Yang, X. (2009). The long-term impact on the Chinese economy of an aging population. Social Sciences in China, 30, 197-208. doi:10.1080/02529200802704027 Copyright © 2013 SciRes. 83 |