

Paper Menu >>
Journal Menu >>
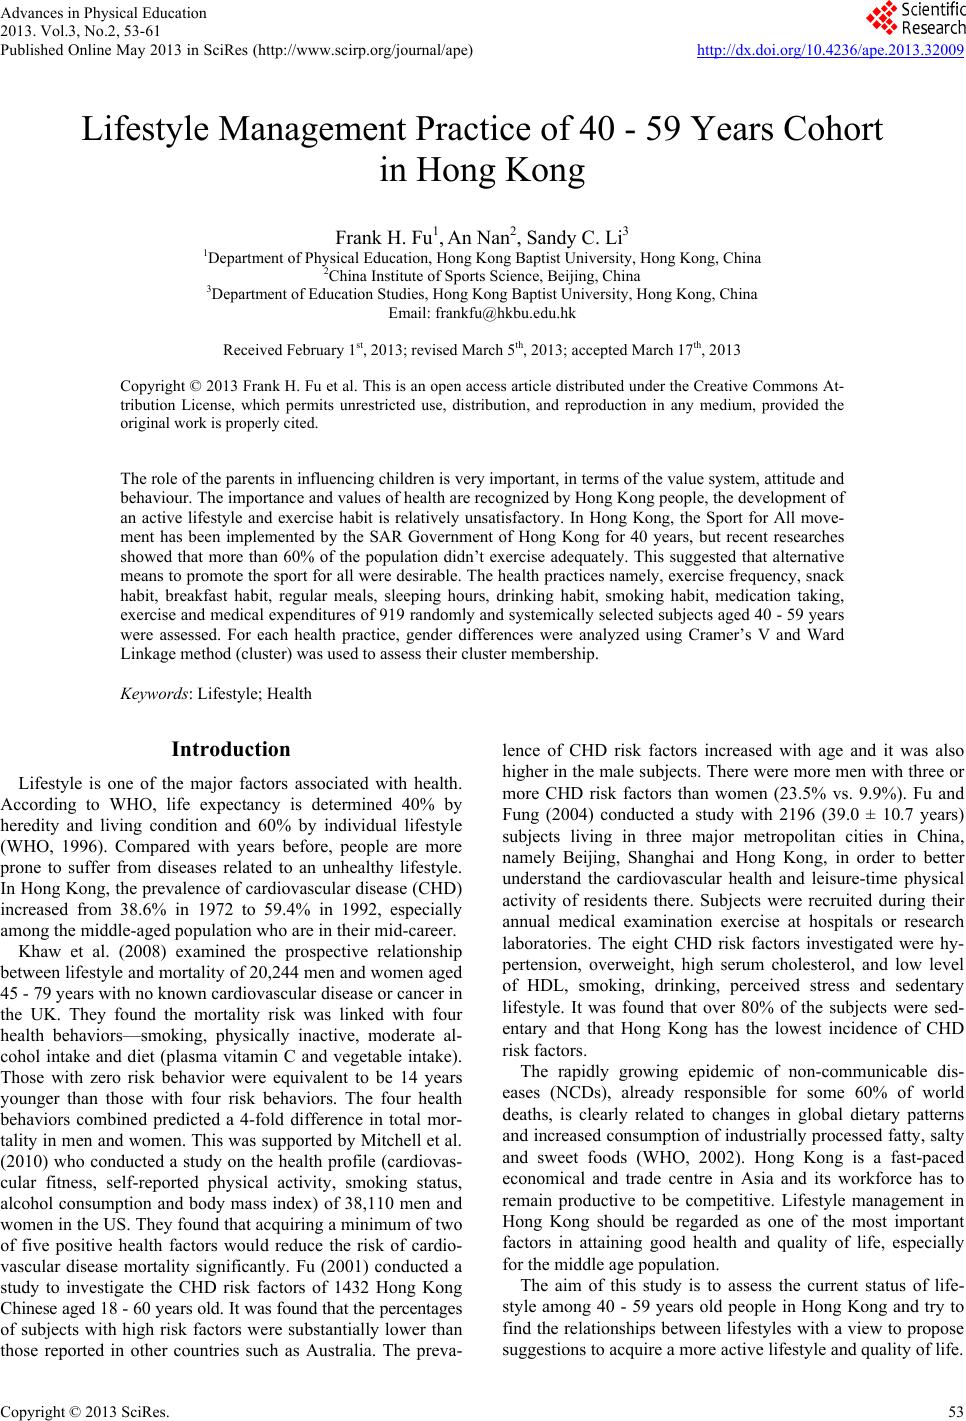 Advances in Physical Education 2013. Vol.3, No.2, 53-61 Published Online May 2013 in SciRes (http://www.scirp.org/journal/ape) http://dx.doi.org/10.4236/ape.2013.32009 Copyright © 2013 SciRes. 53 Lifestyle Management Practice of 40 - 59 Years Cohort in Hong Kong Frank H. Fu1, An Nan2, Sandy C. Li3 1Department of Physical Education, Hong Kong Baptist University, Hong Kong, China 2China Institute of Sports Science, Beijing, China 3Department of Education Studies, Hong Kong Baptist University, Hong Kong, China Email: [email protected] Received February 1st, 2013; revised March 5th, 2013; accepted March 17th, 2013 Copyright © 2013 Frank H. Fu et al. This is an open access article distributed under the Creative Commons At- tribution License, which permits unrestricted use, distribution, and reproduction in any medium, provided the original work is properly cited. The role of the parents in influencing children is very important, in terms of the value system, attitude and behaviour. The importance and values of health are recognized by Hong Kong people, the development of an active lifestyle and exercise habit is relatively unsatisfactory. In Hong Kong, the Sport for All move- ment has been implemented by the SAR Government of Hong Kong for 40 years, but recent researches showed that more than 60% of the population didn’t exercise adequately. This suggested that alternative means to promote the sport for all were desirable. The health practices namely, exercise frequency, snack habit, breakfast habit, regular meals, sleeping hours, drinking habit, smoking habit, medication taking, exercise and medical expenditures of 919 randomly and systemically selected subjects aged 40 - 59 years were assessed. For each health practice, gender differences were analyzed using Cramer’s V and Ward Linkage method (cluster) was used to assess their cluster membership. Keywords: Lifestyle; Health Introduction Lifestyle is one of the major factors associated with health. According to WHO, life expectancy is determined 40% by heredity and living condition and 60% by individual lifestyle (WHO, 1996). Compared with years before, people are more prone to suffer from diseases related to an unhealthy lifestyle. In Hong Kong, the prevalence of cardiovascular disease (CHD) increased from 38.6% in 1972 to 59.4% in 1992, especially among the middle-aged population who are in their mid-career. Khaw et al. (2008) examined the prospective relationship between lifestyle and mortality of 20,244 men and women aged 45 - 79 years with no known cardiovascular disease or cancer in the UK. They found the mortality risk was linked with four health behaviors—smoking, physically inactive, moderate al- cohol intake and diet (plasma vitamin C and vegetable intake). Those with zero risk behavior were equivalent to be 14 years younger than those with four risk behaviors. The four health behaviors combined predicted a 4-fold difference in total mor- tality in men and women. This was supported by Mitchell et al. (2010) who conducted a study on the health profile (cardiovas- cular fitness, self-reported physical activity, smoking status, alcohol consumption and body mass index) of 38,110 men and women in the US. They found that acquiring a minimum of two of five positive health factors would reduce the risk of cardio- vascular disease mortality significantly. Fu (2001) conducted a study to investigate the CHD risk factors of 1432 Hong Kong Chinese aged 18 - 60 years old. It was found that the percentages of subjects with high risk factors were substantially lower than those reported in other countries such as Australia. The preva- lence of CHD risk factors increased with age and it was also higher in the male subjects. There were more men with three or more CHD risk factors than women (23.5% vs. 9.9%). Fu and Fung (2004) conducted a study with 2196 (39.0 ± 10.7 years) subjects living in three major metropolitan cities in China, namely Beijing, Shanghai and Hong Kong, in order to better understand the cardiovascular health and leisure-time physical activity of residents there. Subjects were recruited during their annual medical examination exercise at hospitals or research laboratories. The eight CHD risk factors investigated were hy- pertension, overweight, high serum cholesterol, and low level of HDL, smoking, drinking, perceived stress and sedentary lifestyle. It was found that over 80% of the subjects were sed- entary and that Hong Kong has the lowest incidence of CHD risk factors. The rapidly growing epidemic of non-communicable dis- eases (NCDs), already responsible for some 60% of world deaths, is clearly related to changes in global dietary patterns and increased consumption of industrially processed fatty, salty and sweet foods (WHO, 2002). Hong Kong is a fast-paced economical and trade centre in Asia and its workforce has to remain productive to be competitive. Lifestyle management in Hong Kong should be regarded as one of the most important factors in attaining good health and quality of life, especially for the middle age population. The aim of this study is to assess the current status of life- style among 40 - 59 years old people in Hong Kong and try to find the relationships between lifestyles with a view to propose suggestions to acquire a more active lifestyle and quality of life. 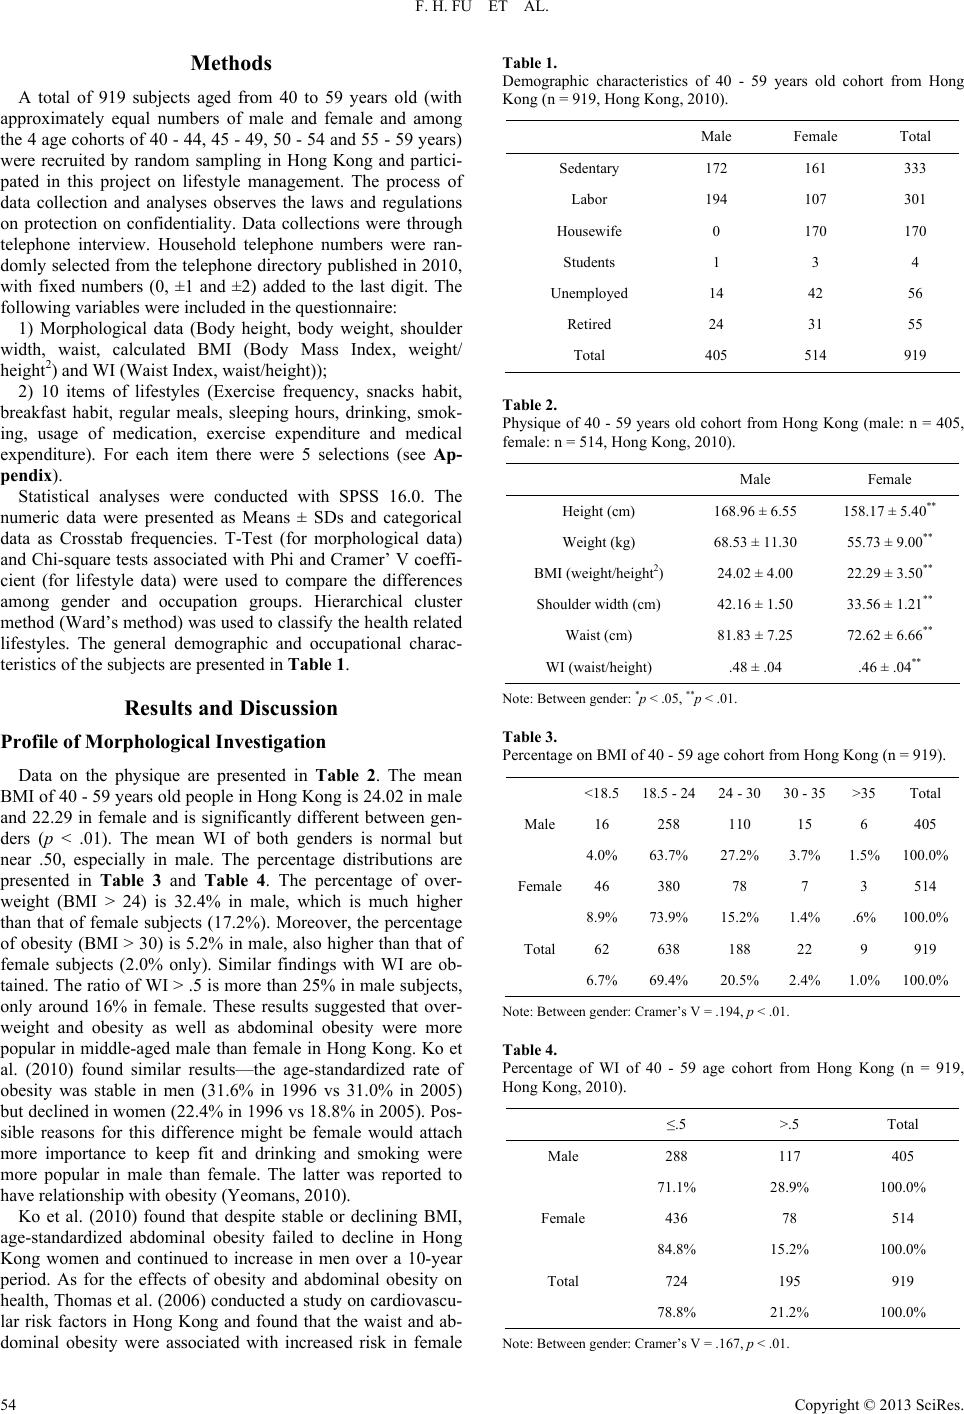 F. H. FU ET AL. Methods A total of 919 subjects aged from 40 to 59 years old (with approximately equal numbers of male and female and among the 4 age cohorts of 40 - 44, 45 - 49, 50 - 54 and 55 - 59 years) were recruited by random sampling in Hong Kong and partici- pated in this project on lifestyle management. The process of data collection and analyses observes the laws and regulations on protection on confidentiality. Data collections were through telephone interview. Household telephone numbers were ran- domly selected from the telephone directory published in 2010, with fixed numbers (0, ±1 and ±2) added to the last digit. The following variables were included in the questionnaire: 1) Morphological data (Body height, body weight, shoulder width, waist, calculated BMI (Body Mass Index, weight/ height2) and WI (Waist Index, waist/height)); 2) 10 items of lifestyles (Exercise frequency, snacks habit, breakfast habit, regular meals, sleeping hours, drinking, smok- ing, usage of medication, exercise expenditure and medical expenditure). For each item there were 5 selections (see Ap- pendix). Statistical analyses were conducted with SPSS 16.0. The numeric data were presented as Means ± SDs and categorical data as Crosstab frequencies. T-Test (for morphological data) and Chi-square tests associated with Phi and Cramer’ V coeffi- cient (for lifestyle data) were used to compare the differences among gender and occupation groups. Hierarchical cluster method (Ward’s method) was used to classify the health related lifesty les. The general demographic and occupational charac- teristics of the subjects are presented in Table 1. Results and Discussion Profile of Morphological Investigation Data on the physique are presented in Table 2. The mean BMI of 40 - 59 years old people in Hong Kong is 24.02 in male and 22.29 in female and is significantly different between gen- ders (p < .01). The mean WI of both genders is normal but near .50, especially in male. The percentage distributions are presented in Table 3 and Table 4. The percentage of over- weight (BMI > 24) is 32.4% in male, which is much higher than that of female subjects (17.2%). Moreover, the percentage of obesity (BMI > 30) is 5.2% in male, also higher than that of female subjects (2.0% only). Similar findings with WI are ob- tained. The ratio of WI > .5 is more than 25% in male subjects, only around 16% in female. These results suggested that over- weight and obesity as well as abdominal obesity were more popular in middle-aged male than female in Hong Kong. Ko et al. (2010) found similar results—the age-standardized rate of obesity was stable in men (31.6% in 1996 vs 31.0% in 2005) but declined in women (22.4% in 1996 vs 18.8% in 2005). Pos- sible reasons for this difference might be female would attach more importance to keep fit and drinking and smoking were more popular in male than female. The latter was reported to have relationship with obesity (Yeomans, 2010). Ko et al. (2010) found that despite stable or declining BMI, age-standardized abdominal obesity failed to decline in Hong Kong women and continued to increase in men over a 10-year period. As for the effects of obesity and abdominal obesity on health, Thomas et al. (2006) conducted a study on cardiovascu- lar risk factors in Hong Kong and found that the waist and ab- dominal obesity were associated with increased risk in female Table 1. Demographic characteristics of 40 - 59 years old cohort from Hong Kong (n = 919, Hong Kong, 2010). Male Female Total Sedentary 172 161 333 Labor 194 107 301 Housewife 0 170 170 Students 1 3 4 Unemployed 14 42 56 Retired 24 31 55 Total 405 514 919 Table 2. Physique of 40 - 59 years old cohort from Hong Kong (male: n = 405, female: n = 514, Hong Kong, 2010). Male Female Height (cm) 168.96 ± 6.55 158.17 ± 5.40** Weight (kg) 68.53 ± 11.30 55.73 ± 9.00** BMI (weight/height2) 24.02 ± 4.00 22.29 ± 3.50** Shoulder width (cm) 42.16 ± 1.50 33.56 ± 1.21** Waist (cm) 81.83 ± 7.25 72.62 ± 6.66** WI (waist/height) .48 ± .04 .46 ± .04** Note: Between gender: *p < .05, **p < .01. Table 3. Percentage on BMI of 40 - 59 age cohort from Hong Kong (n = 919). <18.518.5 - 2424 - 30 30 - 35 >35 Total Male 16 258 110 15 6 405 4.0%63.7% 27.2% 3.7% 1.5%100.0% Female46 380 78 7 3 514 8.9%73.9% 15.2% 1.4% .6% 100.0% Total 62 638 188 22 9 919 6.7%69.4% 20.5% 2.4% 1.0%100.0% Note: Between gender: Cramer’s V = .194, p < .01. Table 4. Percentage of WI of 40 - 59 age cohort from Hong Kong (n = 919, Hong Kong, 2010). ≤.5 >.5 Total Male 288 117 405 71.1% 28.9% 100.0% Female 436 78 514 84.8% 15.2% 100.0% Total 724 195 919 78.8% 21.2% 100.0% Note: Between gender: Cramer’s V = .167, p < .01. Copyright © 2013 SciRes. 54 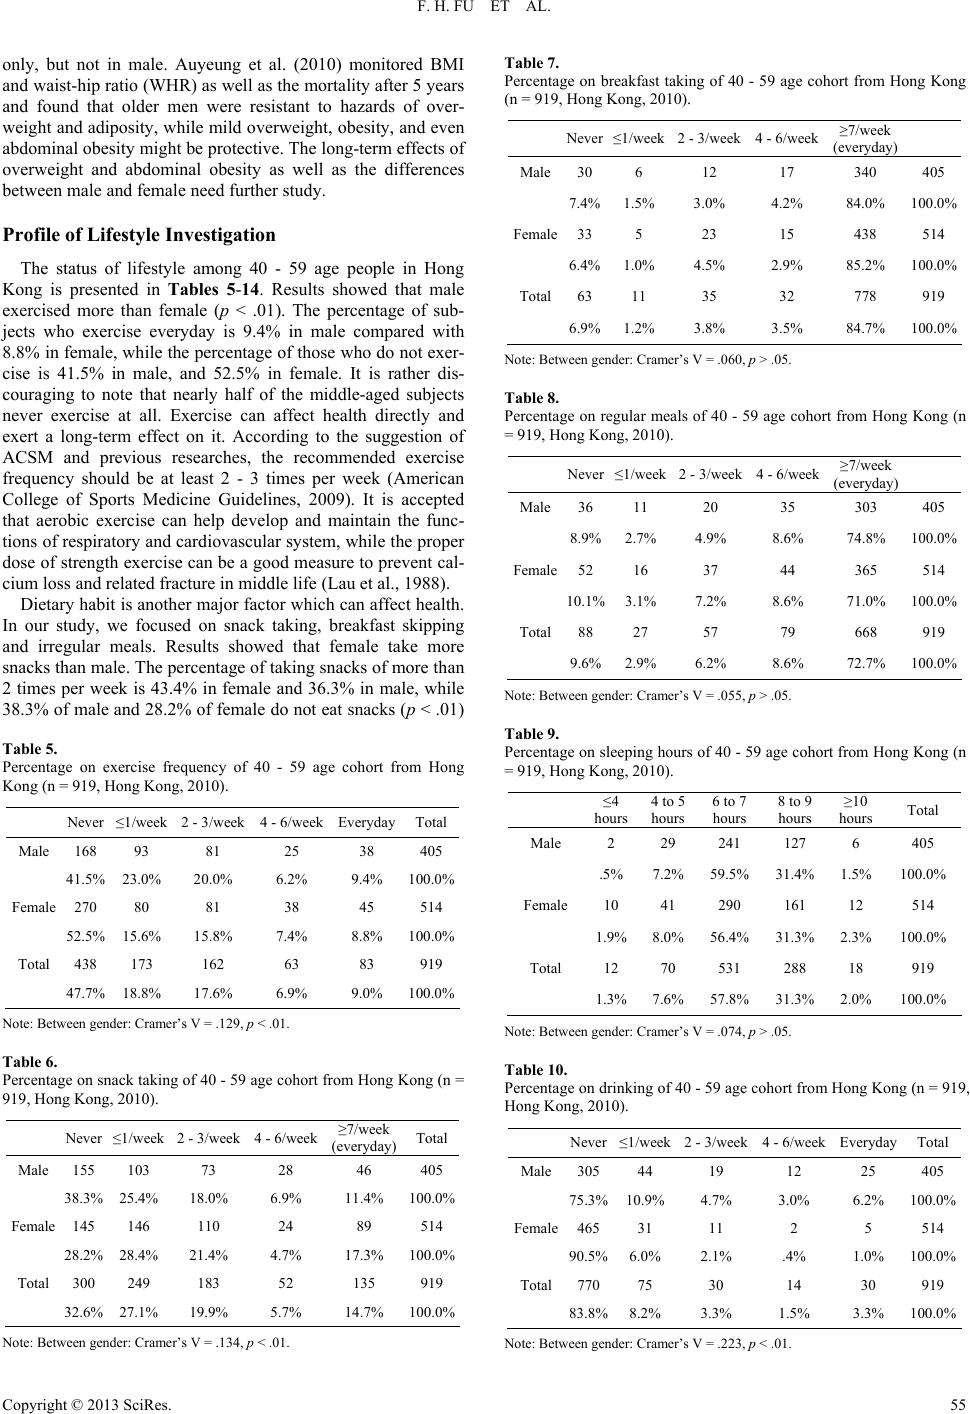 F. H. FU ET AL. only, but not in male. Auyeung et al. (2010) monitored BMI and waist-hip ratio (WHR) as well as the mortality after 5 years and found that older men were resistant to hazards of over- weight and adiposity, while mild overweight, obesity, and even abdominal obesity might be protective. The long-term effects of overweight and abdominal obesity as well as the differences between male and female need further study. Profile of Li f estyle Inve stigation The status of lifestyle among 40 - 59 age people in Hong Kong is presented in Tables 5-14. Results showed that male exercised more than female (p < .01). The percentage of sub- jects who exercise everyday is 9.4% in male compared with 8.8% in female, while the percentage of those who do not exer- cise is 41.5% in male, and 52.5% in female. It is rather dis- couraging to note that nearly half of the middle-aged subjects never exercise at all. Exercise can affect health directly and exert a long-term effect on it. According to the suggestion of ACSM and previous researches, the recommended exercise frequency should be at least 2 - 3 times per week (American College of Sports Medicine Guidelines, 2009). It is accepted that aerobic exercise can help develop and maintain the func- tions of respiratory and cardiovascular system, while the proper dose of strength exercise can be a good measure to prevent cal- cium loss and related fracture in middle life (Lau et al., 1988). Dietary habit is another major factor which can affect health. In our study, we focused on snack taking, breakfast skipping and irregular meals. Results showed that female take more snacks than male. The percentage of taking snacks of more than 2 times per week is 43.4% in female and 36.3% in male, while 38.3% of male and 28.2% of female do not eat snacks (p < .01) Table 5. Percentage on exercise frequency of 40 - 59 age cohort from Hong Kong (n = 919, Hong Kong, 2010). Never ≤1/week 2 - 3/week4 - 6/week EverydayTotal Male 168 93 81 25 38 405 41.5% 23.0% 20.0% 6.2% 9.4% 100.0% Female 270 80 81 38 45 514 52.5% 15.6% 15.8% 7.4% 8.8% 100.0% Total 438 173 162 63 83 919 47.7% 18.8% 17.6% 6.9% 9.0% 100.0% Note: Between gender: Cramer’s V = .129, p < .01. Table 6. Percentage on snack taking of 40 - 59 age cohort from Hong Kong (n = 919, Hong Kong, 2010). Never ≤1/week 2 - 3/week4 - 6/week ≥7/week (everyday) Total Male 155 103 73 28 46 405 38.3% 25.4% 18.0% 6.9% 11.4% 100.0% Female 145 146 110 24 89 514 28.2% 28.4% 21.4% 4.7% 17.3% 100.0% Total 300 249 183 52 135 919 32.6% 27.1% 19.9% 5.7% 14.7% 100.0% Note: Between gender: Cramer’s V = .134, p < .01. Table 7. Percentage on breakfast taking of 40 - 59 age cohort from Hong Kong (n = 919, Hong Kong, 2010). Never≤1/week2 - 3/week 4 - 6/week ≥7/week (everyday) Male30 6 12 17 340 405 7.4%1.5% 3.0% 4.2% 84.0% 100.0% Female33 5 23 15 438 514 6.4%1.0% 4.5% 2.9% 85.2% 100.0% Total63 11 35 32 778 919 6.9%1.2% 3.8% 3.5% 84.7% 100.0% Note: Between gender: Cramer’s V = .060, p > .05. Table 8. Percentage on regular meals of 40 - 59 age cohort from Hong Kong (n = 919, Hong Kong, 2010). Never≤1/week2 - 3/week 4 - 6/week ≥7/week (everyday) Male36 11 20 35 303 405 8.9%2.7% 4.9% 8.6% 74.8% 100.0% Female52 16 37 44 365 514 10.1%3.1% 7.2% 8.6% 71.0% 100.0% Total88 27 57 79 668 919 9.6%2.9% 6.2% 8.6% 72.7% 100.0% Note: Between gender: Cramer’s V = .055, p > .05. Table 9. Percentage on sleeping hours of 40 - 59 age cohort from Hong Kong (n = 919, Hong Kong, 2010). ≤4 hours 4 to 5 hours 6 to 7 hours 8 to 9 hours ≥10 hours Total Male 2 29 241 127 6 405 .5% 7.2%59.5% 31.4% 1.5% 100.0% Female 10 41 290 161 12 514 1.9%8.0%56.4% 31.3% 2.3% 100.0% Total 12 70 531 288 18 919 1.3%7.6%57.8% 31.3% 2.0% 100.0% Note: Between gender: Cramer’s V = .074, p > .05. Table 10. Percentage on drinking of 40 - 59 age cohort from Hong Kong (n = 919, Hong Kong, 2010). Never≤1/week2 - 3/week 4 - 6/week EverydayTotal Male30544 19 12 25 405 75.3%10.9%4.7% 3.0% 6.2% 100.0% Female46531 11 2 5 514 90.5%6.0% 2.1% .4% 1.0% 100.0% Total77075 30 14 30 919 83.8%8.2% 3.3% 1.5% 3.3% 100.0% Note: Between gender: Cramer’s V = .223, p < .01. Copyright © 2013 SciRes. 55 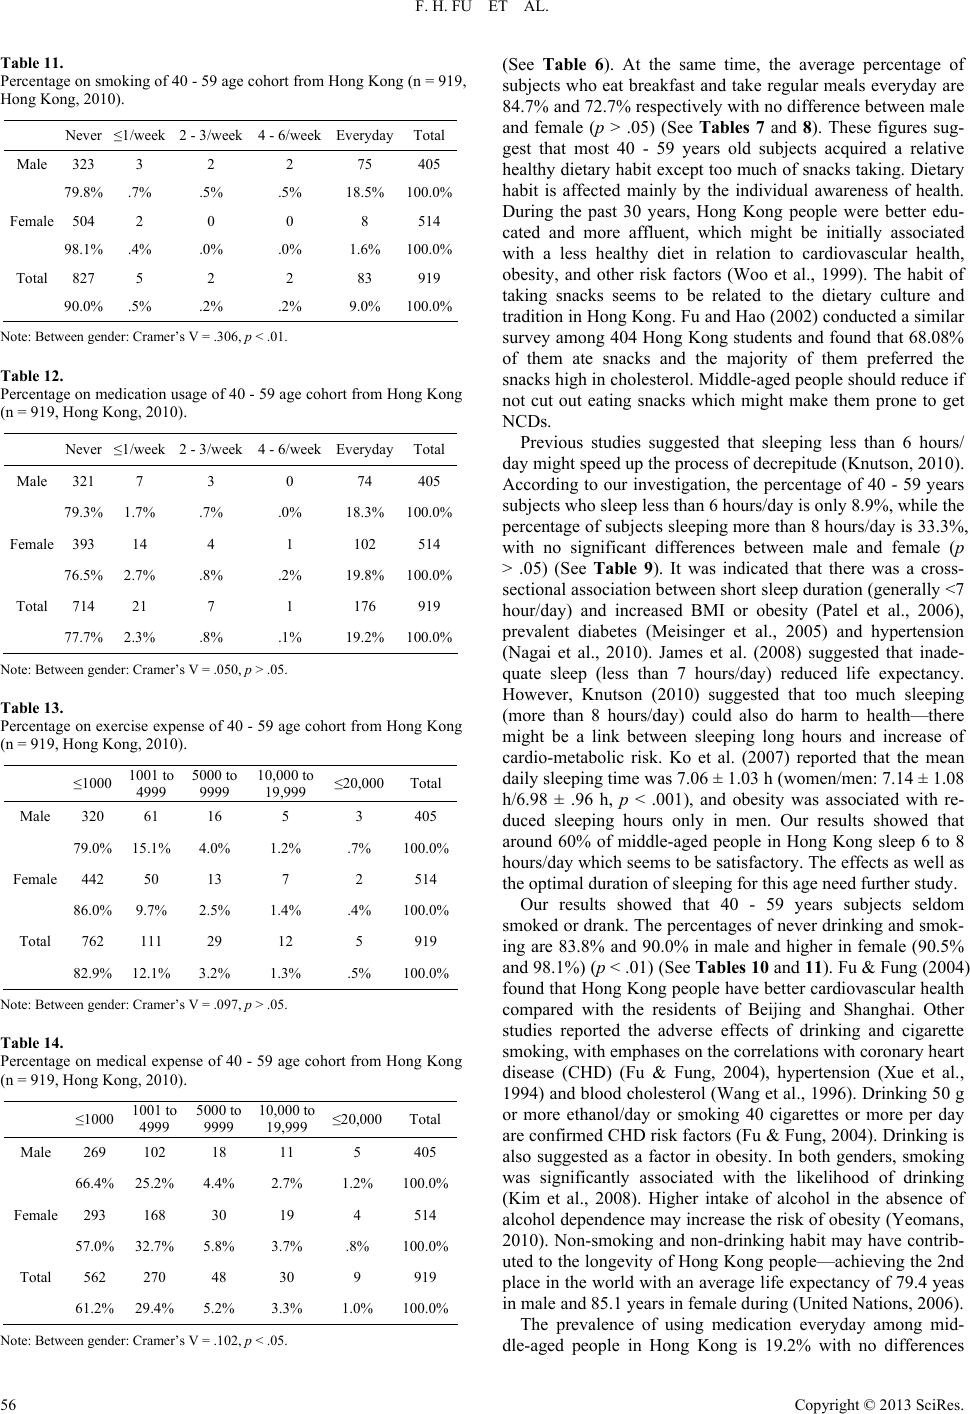 F. H. FU ET AL. Table 11. Percentage on smoking of 40 - 59 age cohort from Hong Kong (n = 919, Hong Kong, 2010). Never ≤1/week 2 - 3/week4 - 6/week EverydayTotal Male 323 3 2 2 75 405 79.8% .7% .5% .5% 18.5% 100.0% Female 504 2 0 0 8 514 98.1% .4% .0% .0% 1.6% 100.0% Total 827 5 2 2 83 919 90.0% .5% .2% .2% 9.0% 100.0% Note: Between gender: Cramer’s V = .306, p < .01. Table 12. Percentage on medication usage of 40 - 59 age cohort from Hong Kong (n = 919, Hong Kong, 2010). Never ≤1/week 2 - 3/week4 - 6/week EverydayTotal Male 321 7 3 0 74 405 79.3% 1.7% .7% .0% 18.3% 100.0% Female 393 14 4 1 102 514 76.5% 2.7% .8% .2% 19.8% 100.0% Total 714 21 7 1 176 919 77.7% 2.3% .8% .1% 19.2% 100.0% Note: Between gender: Cramer’s V = .050, p > .05. Table 13. Percentage on exercise expense of 40 - 59 age cohort from Hong Kong (n = 919, Hong Kong, 2010). ≤1000 1001 to 4999 5000 to 9999 10,000 to 19,999 ≤20,000Total Male 320 61 16 5 3 405 79.0% 15.1% 4.0% 1.2% .7% 100.0% Female 442 50 13 7 2 514 86.0% 9.7% 2.5% 1.4% .4% 100.0% Total 762 111 29 12 5 919 82.9% 12.1% 3.2% 1.3% .5% 100.0% Note: Between gender: Cramer’s V = .097, p > .05. Table 14. Percentage on medical expense of 40 - 59 age cohort from Hong Kong (n = 919, Hong Kong, 2010). ≤1000 1001 to 4999 5000 to 9999 10,000 to 19,999 ≤20,000Total Male 269 102 18 11 5 405 66.4% 25.2% 4.4% 2.7% 1.2% 100.0% Female 293 168 30 19 4 514 57.0% 32.7% 5.8% 3.7% .8% 100.0% Total 562 270 48 30 9 919 61.2% 29.4% 5.2% 3.3% 1.0% 100.0% Note: Between gender: Cramer’s V = .102, p < .05. (See Table 6). At the same time, the average percentage of subjects who eat breakfast and take regular meals everyday are 84.7% and 72.7% respectively with no difference between male and female (p > .05) (See Tables 7 and 8). These figures sug- gest that most 40 - 59 years old subjects acquired a relative healthy dietary habit except too much of snacks taking. Dietary habit is affected mainly by the individual awareness of health. During the past 30 years, Hong Kong people were better edu- cated and more affluent, which might be initially associated with a less healthy diet in relation to cardiovascular health, obesity, and other risk factors (Woo et al., 1999). The habit of taking snacks seems to be related to the dietary culture and tradition in Hong Kong. Fu and Hao (2002) conducted a similar survey among 404 Hong Kong students and found that 68.08% of them ate snacks and the majority of them preferred the snacks high in cholesterol. Middle-aged people should reduce if not cut out eating snacks which might make them prone to get NCDs. Previous studies suggested that sleeping less than 6 hours/ day might speed up the process of decrepitude (Knutson, 2010). According to our investigation, the percentage of 40 - 59 years subjects who sleep less than 6 hours/day is only 8.9%, while the percentage of subjects sleeping more than 8 hours/day is 33.3%, with no significant differences between male and female (p > .05) (See Table 9). It was indicated that there was a cross- sectional association between short sleep duration (generally <7 hour/day) and increased BMI or obesity (Patel et al., 2006), prevalent diabetes (Meisinger et al., 2005) and hypertension (Nagai et al., 2010). James et al. (2008) suggested that inade- quate sleep (less than 7 hours/day) reduced life expectancy. However, Knutson (2010) suggested that too much sleeping (more than 8 hours/day) could also do harm to health—there might be a link between sleeping long hours and increase of cardio-metabolic risk. Ko et al. (2007) reported that the mean daily sleeping time was 7.06 ± 1.03 h (women/men: 7.14 ± 1.08 h/6.98 ± .96 h, p < .001), and obesity was associated with re- duced sleeping hours only in men. Our results showed that around 60% of middle-aged people in Hong Kong sleep 6 to 8 hours/day which seems to be satisfactory. The effects as well as the optimal duration of sleeping for this age need further study. Our results showed that 40 - 59 years subjects seldom smoked or drank. The percentages of never drinking and smok- ing are 83.8% and 90.0% in male and higher in female (90.5% and 98.1%) (p < .01) (See Tables 10 and 11). Fu & Fung (2004) found that Hong Kong people have better cardiovascular health compared with the residents of Beijing and Shanghai. Other studies reported the adverse effects of drinking and cigarette smoking, with emphases on the correlations with coronary heart disease (CHD) (Fu & Fung, 2004), hypertension (Xue et al., 1994) and blood cholesterol (Wang et al., 1996). Drinking 50 g or more ethanol/day or smoking 40 cigarettes or more per day are confirmed CHD risk factors (Fu & Fung, 2004). Drinking is also suggested as a factor in obesity. In both genders, smoking was significantly associated with the likelihood of drinking (Kim et al., 2008). Higher intake of alcohol in the absence of alcohol dependence may increase the risk of obesity (Yeomans, 2010). Non-smoking and non-drinking habit may have contrib- uted to the longevity of Hong Kong people—achieving the 2nd place in the world with an average life expectancy of 79.4 yeas in male and 85.1 years in female during (United Nations, 2006). The prevalence of using medication everyday among mid- dle-aged people in Hong Kong is 19.2% with no differences Copyright © 2013 SciRes. 56  F. H. FU ET AL. between male and female (p > .05) (See Table 12). The per- centages of medical expense more than HK$1000/month are 33.6% in male and 43% in female (p < .05) (See Table 14). Comparing to the expense on exercise, the percentages of ≥ HK $1000 decreased to 21% in male and 14% in female (p > .05) (See Table 13). These results suggested that middle-aged peo- ple in Hong Kong are prone to rely on medicine than exercise to maintain their health. Lifestyles Comparison between Sedentary and Labor Groups The nature of occupation can affect health. The comparisons on prevalence of lifestyles between sedentary (white collar) and labor (blue collar) groups in the 40 - 59 years old cohort are presented in Figure 1. Results show that there are significant differences between the sedentary and labor groups in WI > .5 (16.8% vs. 27.9%), exercise frequency ≤1/week (66.6% vs. 70.1%), drinking ≥3/week (3/6% vs. 7.7%), smoking (7.2% vs. 15.9) and exercise expense ≤HK$1000 (77.5% vs. 86.4%). Sedentary lifestyle is a known risk factor in CHD, hypertension and diabetes etc. (Tremblay et al., 2010). Our investigation suggested that among 40 - 59 years old cohort, sedentary work- ers led a healthier lifestyle than labor workers (they have less WI, less drinking and smoking, and more exercise). It also suggested that excessive drinking and smoking may have posi- tive relationship with abdominal obesity in this age cohort. Cluster of Lifestyles of 40 - 59 Age Cohort in Hong Kong Recent findings suggested that the lifestyle risk factors were not randomly distributed but were clustering within individuals in the general population (Ma et al., 2000). For better under- standing of the relationships among health related lifestyles in the 40 - 59 years cohort, the 10 items as well as BMI and WI were classified by hierarchical cluster analysis (Ward’s me- thod). The results and dendrogram of cluster analysis are pre- sented in Table 15 and Figure 2. Four clusters of lifestyles are identified as follows: Figure 1. Profile of prevalence of lifestyles between Sedentary and Labor groups in Hong Kong (n = 919, Hong Kong, 2010). (Between groups: BMI > 25, WI > .5 (p < .01), Q1-exercise frequency ≤1/week (p < .01), Q2— snacks taking ≥ 4 - 6/week, Q3—breakfast taking ≤ 3/week, Q4— regular meals ≤ 3/week, Q5—sleeping hours ≤ 6h/day, Q6—drinking ≥ 3/week (p < .05), Q7—smoking ≥ 3/week (p < .01), Q8—medication taking ≥ 3/week, Q9—exercise expenditure ≤ 1000 HKD (p < .05), Q10—medical expenditure ≥ 1000 HK$). Table 15. Cluster membership of lifestyle of 40 - 59 age cohorts in Hong Kong (Ward’s method, Hong Kong, 2010). Case 4 Clusters 3 Clusters BMI 1 1 WI 2 2 Q1—exercise 1 1 Q2—snacks 1 1 Q3—breakfast 3 3 Q4—meals 3 3 Q5—sleeping 1 1 Q6—drinking 2 2 Q7—smoking 2 2 Q8—medication 4 2 Q9—exercise expense 2 2 Q10—medication expense 2 2 Dendrogram using Ward Method C A S E N um 0 5 10 15 20 25 Rescaled Distance Cluster Combine 2 11 12 8 9 10 1 7 4 3 5 6 Labe 1 WI Q9 Q1 Q6 Q7 Q8 BMI Q5 Q2 Q1 Q3 Q4 Figure 2. Cluster Membership of lifestyle of 40 - 59 age cohorts in HK (Ward’s method, Hong Kong, 2010). 1) BMI, exercise, snacks, sleeping; 2) WI, drinking, smoking, exercise and medical expense; 3) Regular meals; and 4) Usage of medication. The results suggest that proper exercise, adequate sleeping duration and reducing additional energy intake can help to con- trol the body-weight, while drinking and smoking seem to have more close relationship with abdominal obesity. Regular meal and reduction in usage of medication may have special implica- tions for maintaining health at middle-age. Similar to our find- ings, a previous study also identified drinking and smoking as one cluster which was related to CHD (Fu & Fung, 2004). Smoking and lack of physical activities will increase the preva- lence of obesity (Yeomans, 2010). Some studies have focused on the different cluster of lifestyles regarding genders. A study on elderly people analyzed the four lifestyle risk factors in- volving smoking, drinking, lack of exercise and low intake of vegetables and fruits. It found that the prevalence of multiple risk factors was much greater among older male than older female (Chou, 2008). Another study found that BMI was inde- Copyright © 2013 SciRes. 57  F. H. FU ET AL. pendently associated with age in female, whereas waist was associated with age and smoking. In male, sleeping hours and working hours were independently associated with BMI, whereas waist was independently associated with age, smoking, sleeping hours and working hours (Ko et al., 2007). The effects and implications of different lifestyle on the health of mid- dle-aged people still need more investigations. Summary While Hong Kong has made tremendous stride in economical development, its workforce is also becoming old. Middle-aged people are experiencing health crisis after years of hard work and competitions in life. The rapid growth and epidemic of non-communicable diseases, which is already responsible for some 60% of world deaths, is clearly related to changes in global dietary patterns and increased consumption of industri- ally processed fatty, salty and sweet foods (WHO, 2002). It is commonly accepted that lifestyle is one of the most important factors associated with health. Although heredity might play an important role in determining life expectancy and health, the individual’s lifestyle is, along with the environment, one of the most modifiable factors. Health promotion aims to encourage habits and lifestyles conducive to attaining old age and quality of life should be organized. This notion has been encapsulated by the term “healthy ageing”, and is a concept actively pro- moted by WHO and other agencies (WHO, 1998). Lifestyle management thus plays an important role in the daily life of middle-aged people. Our study on lifestyle management of 40 - 59 years cohort in Hong Kong found that: 1) Male are more prone to become over-weight and obese (abdominal) than female (32.4% vs. 17.2%, 5.2% vs. 2.0%). 2) 41.5% of male and 52.5% of female at this age never exercise at all. 3) Most of the people (72.7%, 84.7%) have regular meals and breakfast. Female eats more snacks than male. 4) 57.8% of the people at this age have 6 to 8 hours of sleeping per day. 5) Drinking and smoking are not popular (16.2%, 10.0%). 6) 22.3% of the people seeks the help of medication to stay healthy. The annual expense of medicine is higher than physical exercise. 7) Sedentary workers have more healthy lifestyles and less abdominal obesity than labor worker for they exercise more and drink and smoke less. 8) Cluster analysis showed that proper exercise, adequate sleeping and eating less snacks can help to control body-weight, drink- ing and smoking, the latter may have close relationship with abdominal obesity. Regular meals and usage of medication may have special implications on health. We strongly suggest that middle-aged people in Hong Kong should exercise more, reduce their medication usage, maintain proper dietary pattern and sleep adequately. Furthermore, fe- male should cut down on their snacks taking and blue collar workers should change their drinking and smoking habit. Acknowledgements The authors wish to acknowledge the contribution of Prof. Chung PK, Prof. Lena Fung, Prof. Leung Meelee, and Ms. Mavis Pang in the design of the research project. Also to the Centre for the Advancement of Social Sciences , HKBU for her support in conducting the survey and data analyses and the Dr. Stephen Research Centre of Physical Recreation and Wellness, HKBU for funding. REFERENCES Auyeung, T. W., Lee, J. S., Leung, J. et al. (2010). Survival in older men may benefit from being slightly overweight and centrally obese—A 5-year follow-up study in 4000 older adults using DXA. Journals of Gerontology. Series A: Biological Sciences and Medical Sciences, 65, 99-104. doi:10.1093/gerona/glp099 Fu, F. H. (2001). The prevalence of cardiovascular disease risk factors of Hong Kong Chinese. The Journal of S po r ts M ed i c in e and Physical Fitness, 41, 491-499. Fu, F. H., & Fung, L. (2004). The cardiovascular health of residents in selected metropolitan cities in China. Preventive Medicine, 38, 458- 467. doi:10.1016/j.ypmed.2003.11.022 Fu, F. H., & Haom X. (2002). Physical development and lifestyle of Hong Kong secondary school students. Preventive Medicine, 35, 499-505. doi:10.1006/pmed.2002.1104 James, E., Gangwisch, & Steven, B. et al. (2008). Sleep duration asso- ciated with mortality in elderly, but not middle-aged, adults in a large US sample. Sleep, 31, 1087-1096. Kim, J. H., Lee, S., Chow, J. et al. (2008). Prevalence and the factors associated with binge drinking, alcohol abuse, and alcohol depend- ence: A population-based study of Chinese adults in Hong Kong. Alcohol and Alcoholis m, 43, 360-370. Ko, G. T., Tang, J. S., & Chan, J. C. (2010). Worsening trend of central obesity despite stable or declining body mass index in Hong Kong Chinese between 1996 and 2005. European Journal of Clinical Nutrition, 64, 549-552. doi:10.1038/ejcn.2010.49 Khaw, K. T., Wareham, N., Bingham, S., et al., 2008. Combined im- pact of health behaviors and mortality in men and women: The EPIC-norfolk prospective population study. PLoS Medicine, 5, 39- 47. doi:10.1371/journal.pmed.0050012 Knutson, K. L. (2010). Sleep duration and cardiometabolic risk: A review of the epidemiologic evidence. Best Practice & Research: Clinical Endocrinolo gy & Metabolism, 24 , 731-743. doi:10.1016/j.beem.2010.07.001 Ko, G. T., Chan, J. C., Chan, A. W. et al. (2007). Association between sleeping hours, working hours and obesity in Hong Kong Chinese: The better health for better Hong Kong’s health promotion campaign. International Journal of Obesity, 31, 254-260. doi:10.1038/sj.ijo.0803389 Ko, G. T., Tang, J. S., Chan, J. C. et al. (2010). Worsening trend of central obesity despite stable or declining body mass index in Hong Kong Chinese between 1996 and 2005. European Journal of Clinical Nutrition, 64, 549-552. doi:10.1038/ejcn.2010.49 Lau, E., Donnan, S., Barker, D. J. et al. (1988). Physical activity and calcium intake in fracture of the proximal femur in Hong Kong. Brit- ish Medical Journal, 297 , 1441-1443. doi:10.1136/bmj.297.6661.1441 Ma, J., Betts, N. M., & Hampl, J. S. (2000). Clustering of lifestyle behaviors: The relationship between cigarette smoking, alcohol con- sumption, and dietary intake. American Journal of Health Promotion, 15, 107-117. doi:10.4278/0890-1171-15.2.107 Meisinger, C., Heier, M., & Loewel, H. (2005). Sleep disturbance as a predictor of type 2 diabetes mellitus in men and women from the general population. Diabetologia, 48, 235-241. doi:10.1007/s00125-004-1634-x Mitchell, J. A., Bornstein, D. B., Siu, X. M. et al. (2010). The impact of combined health factors on cardiovascular disease mortality. Ameri- can Heart Journal, 160, 102-108. doi:10.1016/j.ahj.2010.05.001 Nagai, M., Hoshide, S., & Kario, K. (2010). Sleep duration as a risk factor for cardiovascular disease: A review of the recent literature. Current Cardiology Reviews, 6, 54-61. doi:10.2174/157340310790231635 Patel, S. R., Malhotra, A., White, D. P. et al. (2006). Association be- tween reduced sleep and weight gain in women. American Journal of Epidemiology, 164, 947-954. doi:10.1093/aje/kwj280 Thomas, G. N., McGhee, S. M., Schooling, M. et al. (2006). Impact of sex-specific body composition on cardiovascular risk factors: The Hong Kong cardiovascular risk factor study. Metabolism, 55, 563- 569. doi:10.1016/j.metabol.2005.08.004 United Nations (2007). World population prospects. The 2006 revision. Copyright © 2013 SciRes. 58  F. H. FU ET AL. Copyright © 2013 SciRes. 59 New York. Wang, W., Wu, Z., & Ding, X. (1996). The relationship between smoking and high density lipoprotein cholesterol. Acta Academiae Medicinae Jiangxi, 36, 45-47. Woo, J., Leung, S. S., Ho, S. C. et al. (1999). Influence of educational level and marital status on dietary intake, obesity and other cardio- vascular risk factors in a Hong Kong Chinese Population. European Journal of Clinical Nutrition, 53, 461-467. doi:10.1038/sj.ejcn.1600777 World Health Organization (2002). World health report. Geneva: WHO. World Health Organization (1998). World health report. Geneva: WHO. Xue, Z., Yu, J., Wu, X. et al. (1994). A study of behavior pattern and risk factors in hypertension. Acta Sc i N at , 30, 375-382. Yeomans, M. R. (2010). Alcohol, appetite and energy balance: Is alco- hol intake a risk factor for obesity? Physiology & Behavior, 100, 82-89.  F. H. FU ET AL. Appendix Questionnaire Name: _________________________ Age: ______________ Gender: ______________ Height: ________________ (in cm) Weight: _________________ (in kg) Body Type: Upper body frame/size (Large, Medium and Small) Waist: ________________ (in cm) Please tick (√ ) the most appropriate answer. 1. How often do you participate in physical activity weekly? A. Never B. 1 - 2 times C. 3 - 4 times D. 5 - 6 times E. Every day 2. How about do you eat snack? A. Never B. Less than once/week C. 2 - 3 times/week D. Regularly—More than 3 times per week E. Every Day 3. Do you eat breakfast? A. Never B. Less than once/week C. 2 - 3 times/week D. Regularly—More than 3 times per week E. Every Day 4. Do you eat 3 meals at regular times each day? A. Never B. Less than once/week C. 2 - 3 times/week D. Regularly—More than 3 times per week E. Every Day 5. How many hours do you normally sleep a day? A. 4 hours or less per day B. 4 - 5 hours per day C. 6 - 7 hours per day D. 8 - 9 hours per day E. 10 hours or more per day 6. Do you drink (alcohol)? A. Never B. Less than once/week C. 2 - 3 times/week D. Regularly—More than 3 times per week E. Every Day 7. Do you smoke (cigarette)? A. Never B. Less than once/week Copyright © 2013 SciRes. 60  F. H. FU ET AL. Copyright © 2013 SciRes. 61 C. 2 - 3 times/week D. Regularly—More than 3 times per week E. Every Day 8. Do you take prescribed medication (not including vitamins and health drinks) ? A. Never B. Less than once/week C. 2 - 3 times/week D. Regularly—More than 3 times per week E. Every Day 9. What is your annual expenditure on participating in sports activities (in Hong Kong) ? A. Below HK$1000 per year B. Between HK$1000 - 4999 per year C. Between HK$5000 - 9900 per year D. Between HK$10,000 - 19,990 per year E. More than HK$20,000 per year 10. What is your annual expenditure on medical bills (in Hong Kong)? A. Below HK$1000 per year B. Between HK$1000 - 4999 per year C. Between HK$5000 - 9900 per year D. Between HK$10,000 - 19,990 per year E. More than HK$20,000 per year 11. What kind of you job do you have? A. Office work B. Labour work C. Household work D. In School E. Others Note: For school children/students, information will be provided by their parents on Questions 9 and 10 |