

Paper Menu >>
Journal Menu >>
 Vol.2, No.11, 1255-1259 (2010) doi:10.4236/health.2010.211186 Copyright © 2010 SciRes. http://www.scirp.org/journal/HEALTH/ Health Openly accessible at Muscle endurance measurement using a progressive workload and a constant workload by maximal voluntary contraction Shinichi Demura1, Masakatsu Nakada2* 1Graduate School of Natural Science & Technology, Kanazawa University, Kanazawa, Japan; 2National Defense Academy, Yokosuka, Japan; *Corresponding Author: [email protected]. Received 12 August 2010; revised 18 August 2010; accepted 25 August 2010. ABSTRACT Muscle endurance measurement using a pro- gressive workload method may reduce pain sensation in the subject. This study aimed to examine the relationships between force-time parameters during sustained static gripping as measured by maximal voluntary contraction (MVC) using either a progressive workload (PW) or a constant workload (CW). Sixteen subjects performed sustained static gripping with 7 gra- dually increasing relative demand values of 20% to 80% MVC and sustained static gripping by MVC. The staging of progressive workload was 10 s for 20% MVC, 20 s each for 30, 40, 50, 60, and 70% MVC, and 10 s for 80% MVC. The forces exerted at 120 s in the CW and PW methods were at around the 23-27% MVC level. Peak force, final force, and force during the last 30 s for the PW method evaluated muscle endurance after 1 min and showed high correlations (r = 0.746 − 0.895). Significant correlations (r = 0.575 − 0.605) were found between time to 40% MVC in the CW method and peak force, final force, and force in the last 30 s in the PW method group. The peak force in the PW method may be useful for evaluating muscle endurance with a short testing time and without high pain sensation. Keywords: Sustained Static Gripping; Progressive Workload; Constant Workload; Muscle Endurance 1. INTRODUCTION Muscle endurance has been measured by maximal vo- luntary contraction (MVC) or fixed relative load intensity [1-6]. Many researchers have reported force-decrease properties exerted in the constant workload (CW) me- thod [6-8]. Yamaji et al. [8] examined the physiological properties of force-time parameters during maximal sus- tained static gripping and reported that time to 40% MVC reflects the individual difference of force based on oxygen debt with muscle blood flow limitation. Muscle endurance measurement using the force exertion by MVC may be effective, but there are problems with se- vere muscle-fatigue or dislike of the testing procedure. In the case of evaluating muscle endurance from the perspective of sustaining demand values, according to Nagasawa et al. [6], the sustained time is very short (about 16 ± 13 sec) when using the heavy workload (75% MVC) and is very long (about 224 ± 144 sec) when using the light workload (25% MVC). Even when using any workload, the force value reaches a steady state at 15%-20% MVC and then decreases little [6,8,9]. Meanwhile, the progressive workload (PW) method gradually increases the relative loads while considering the physiological responses [10,11]. Measuring muscle endurance by this method can reduce the physical bur- den on the subjects (dislike, pain sensation, etc), because this method does not impose rapidly large workloads on the muscle groups. The PW method is also considered to be effective for the elderly, with whom there is increased risk associated with a rapid increase of blood pressure. When considering the physiological parameters of mu- scle endurance measurements based on MVC, it is im- portant to remember that during the initial force exertion due to large workloads, muscle endurance is evaluated in a state of blood flow obstruction caused by an increase in intramuscular pressure. On the other hand, the low force exertion state in the latter half of the measurement period evaluates muscle endurance in a state of sufficient oxygen delivery to the muscles, with the resumption of blood flow caused by the reduction of intramuscular pressure [8,12]. The PW method may be able to evaluate muscle endurance without significant fatigue or dislike 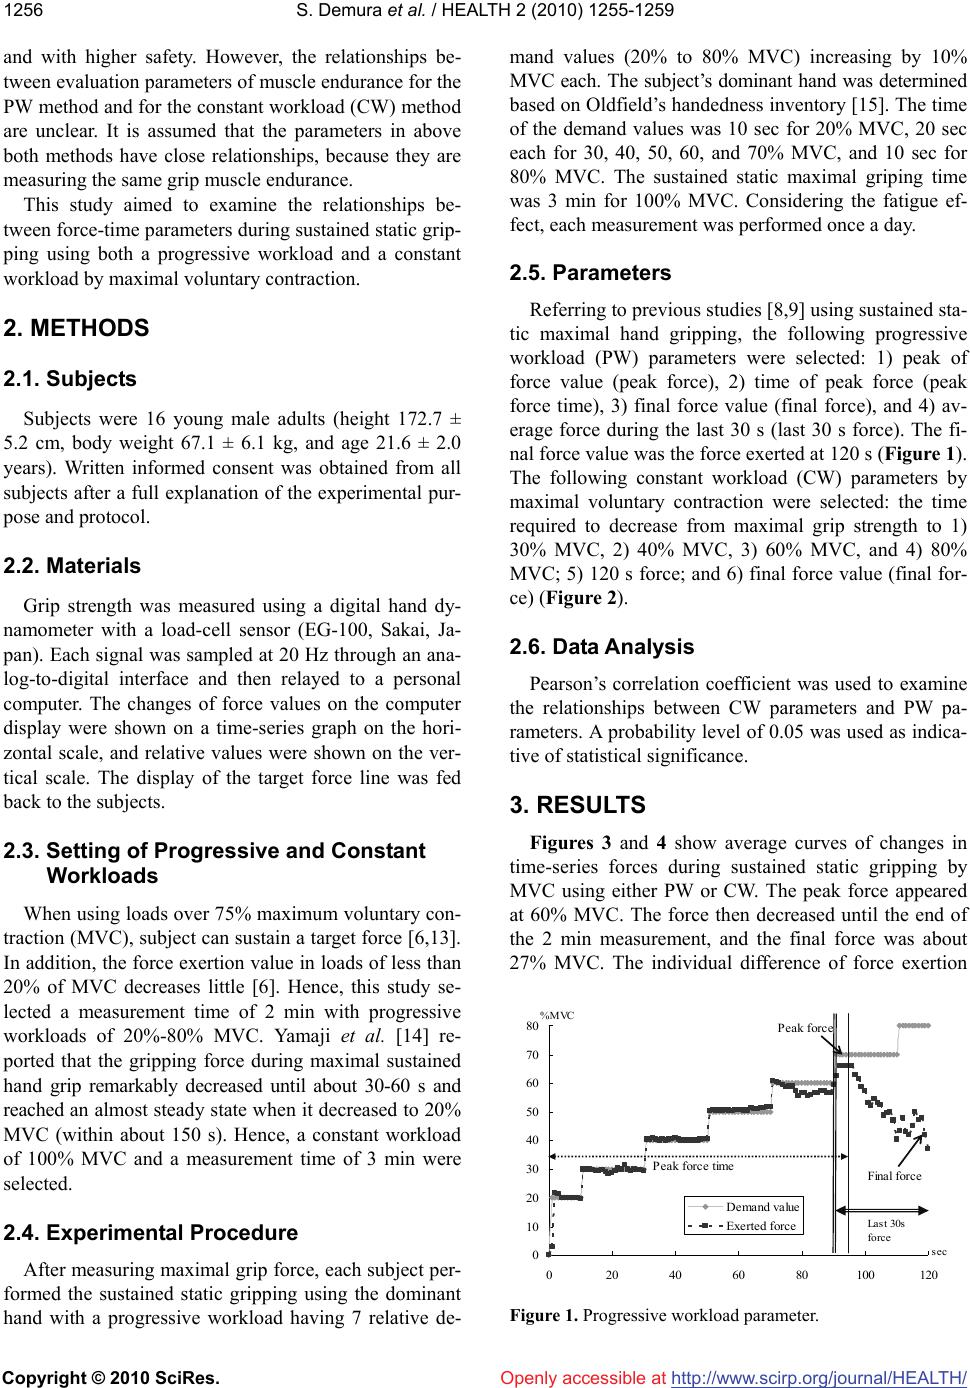 S. Demura et al. / HEALTH 2 (2010) 1255-1259 Copyright © 2010 SciRes. http://www.scirp.org/journal/HEALTH/ 1256 Openly accessible at and with higher safety. However, the relationships be- tween evaluation parameters of muscle endurance for the PW method and for the constant workload (CW) method are unclear. It is assumed that the parameters in above both methods have close relationships, because they are measuring the same grip muscle endurance. This study aimed to examine the relationships be- tween force-time parameters during sustained static grip- ping using both a progressive workload and a constant workload by maximal voluntary contraction. 2. METHODS 2.1. Subjects Subjects were 16 young male adults (height 172.7 ± 5.2 cm, body weight 67.1 ± 6.1 kg, and age 21.6 ± 2.0 years). Written informed consent was obtained from all subjects after a full explanation of the experimental pur- pose and protocol. 2.2. Materials Grip strength was measured using a digital hand dy- namometer with a load-cell sensor (EG-100, Sakai, Ja- pan). Each signal was sampled at 20 Hz through an ana- log-to-digital interface and then relayed to a personal computer. The changes of force values on the computer display were shown on a time-series graph on the hori- zontal scale, and relative values were shown on the ver- tical scale. The display of the target force line was fed back to the subjects. 2.3. Setting of Progressive and Constant Workloads When using loads over 75% maximum voluntary con- traction (MVC), subject can sustain a target force [6,13]. In addition, the force exertion value in loads of less than 20% of MVC decreases little [6]. Hence, this study se- lected a measurement time of 2 min with progressive workloads of 20%-80% MVC. Yamaji et al. [14] re- ported that the gripping force during maximal sustained hand grip remarkably decreased until about 30-60 s and reached an almost steady state when it decreased to 20% MVC (within about 150 s). Hence, a constant workload of 100% MVC and a measurement time of 3 min were selected. 2.4. Experimental Procedure After measuring maximal grip force, each subject per- formed the sustained static gripping using the dominant hand with a progressive workload having 7 relative de- mand values (20% to 80% MVC) increasing by 10% MVC each. The subject’s dominant hand was determined based on Oldfield’s handedness inventory [15]. The time of the demand values was 10 sec for 20% MVC, 20 sec each for 30, 40, 50, 60, and 70% MVC, and 10 sec for 80% MVC. The sustained static maximal griping time was 3 min for 100% MVC. Considering the fatigue ef- fect, each measurement was performed once a day. 2.5. Parameters Referring to previous studies [8,9] using sustained sta- tic maximal hand gripping, the following progressive workload (PW) parameters were selected: 1) peak of force value (peak force), 2) time of peak force (peak force time), 3) final force value (final force), and 4) av- erage force during the last 30 s (last 30 s force). The fi- nal force value was the force exerted at 120 s (Figure 1). The following constant workload (CW) parameters by maximal voluntary contraction were selected: the time required to decrease from maximal grip strength to 1) 30% MVC, 2) 40% MVC, 3) 60% MVC, and 4) 80% MVC; 5) 120 s force; and 6) final force value (final for- ce) (Figure 2). 2.6. Data Analysis Pearson’s correlation coefficient was used to examine the relationships between CW parameters and PW pa- rameters. A probability level of 0.05 was used as indica- tive of statistical significance. 3. RESULTS Figures 3 and 4 show average curves of changes in time-series forces during sustained static gripping by MVC using either PW or CW. The peak force appeared at 60% MVC. The force then decreased until the end of the 2 min measurement, and the final force was about 27% MVC. The individual difference of force exertion 0 10 20 30 40 50 60 70 80 0 20406080100120 Demand value Exerted force Peak force Peak force timeFinal force sec %MVC Last 30s force Figure 1. Progressive workload parameter. 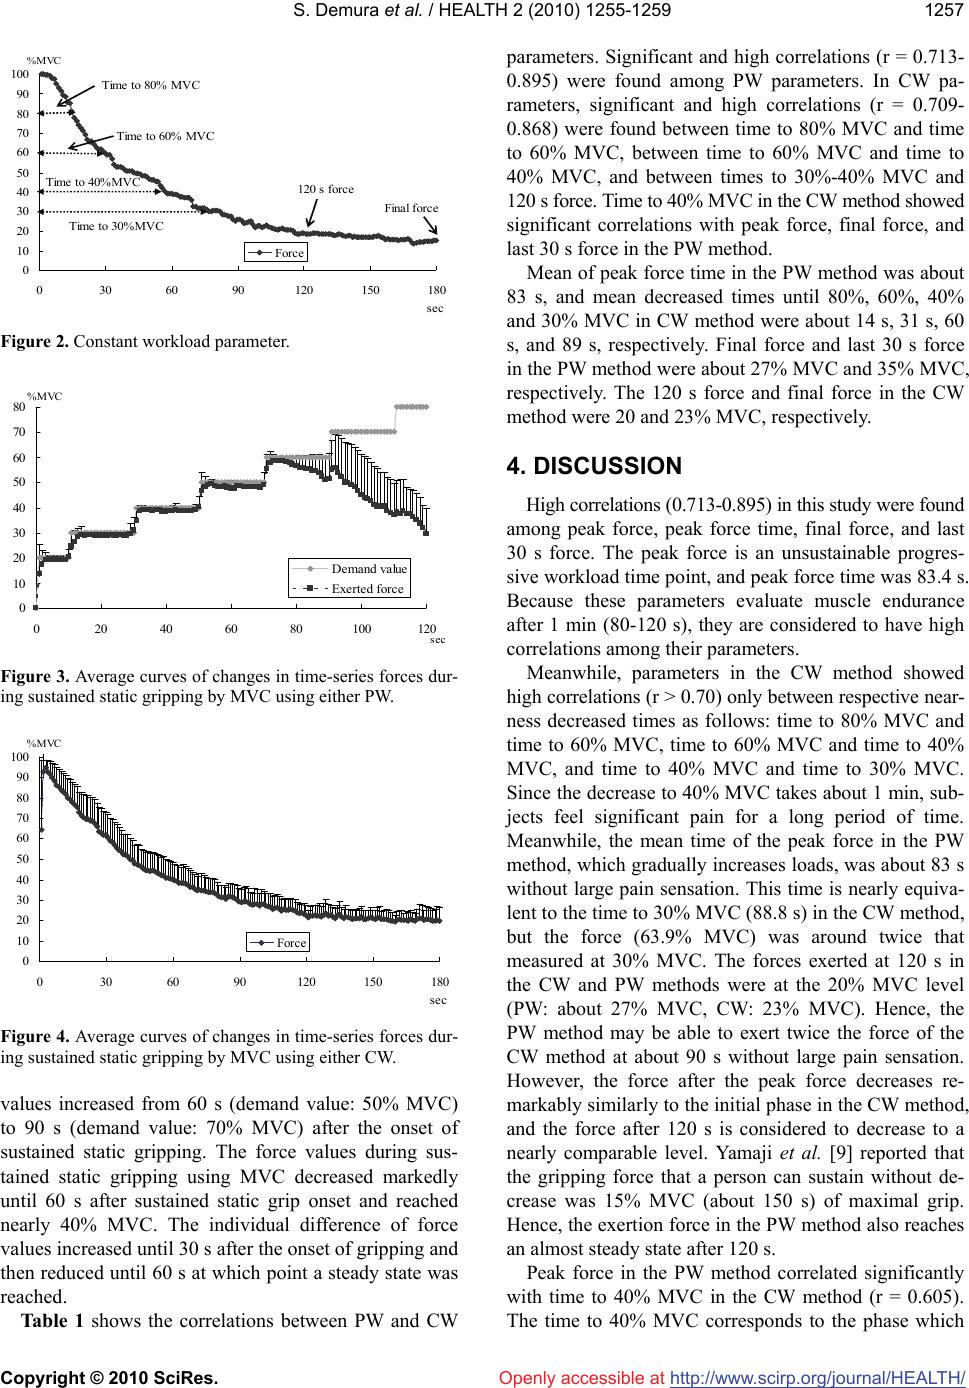 S. Demura et al. / HEALTH 2 (2010) 1255-1259 Copyright © 2010 SciRes. http://www.scirp.org/journal/HEALTH/ 1257 Openly accessible at 0 10 20 30 40 50 60 70 80 90 100 0306090120 150 180 Force Time to 80% MVC Time to 60% MVC Time to 40%MVC sec %MVC Final force 120 s force Time to 30%MVC Figure 2. Constant workload parameter. 0 10 20 30 40 50 60 70 80 020 40 60 80100120 Demand value Exerted force sec %MVC Figure 3. Average curves of changes in time-series forces dur- ing sustained static gripping by MVC using either PW. 0 10 20 30 40 50 60 70 80 90 100 0 3060901201501 80 Force sec %MVC Figure 4. Average curves of changes in time-series forces dur- ing sustained static gripping by MVC using either CW. values increased from 60 s (demand value: 50% MVC) to 90 s (demand value: 70% MVC) after the onset of sustained static gripping. The force values during sus- tained static gripping using MVC decreased markedly until 60 s after sustained static grip onset and reached nearly 40% MVC. The individual difference of force values increased until 30 s after the onset of gripping and then reduced until 60 s at which point a steady state was reached. Table 1 shows the correlations between PW and CW parameters. Significant and high correlations (r = 0.713- 0.895) were found among PW parameters. In CW pa- rameters, significant and high correlations (r = 0.709- 0.868) were found between time to 80% MVC and time to 60% MVC, between time to 60% MVC and time to 40% MVC, and between times to 30%-40% MVC and 120 s force. Time to 40% MVC in the CW method showed significant correlations with peak force, final force, and last 30 s force in the PW method. Mean of peak force time in the PW method was about 83 s, and mean decreased times until 80%, 60%, 40% and 30% MVC in CW method were about 14 s, 31 s, 60 s, and 89 s, respectively. Final force and last 30 s force in the PW method were about 27% MVC and 35% MVC, respectively. The 120 s force and final force in the CW method were 20 and 23% MVC, respectively. 4. DISCUSSION High correlations (0.713-0.895) in this study were found among peak force, peak force time, final force, and last 30 s force. The peak force is an unsustainable progres- sive workload time point, and peak force time was 83.4 s. Because these parameters evaluate muscle endurance after 1 min (80-120 s), they are considered to have high correlations among their parameters. Meanwhile, parameters in the CW method showed high correlations (r > 0.70) only between respective near- ness decreased times as follows: time to 80% MVC and time to 60% MVC, time to 60% MVC and time to 40% MVC, and time to 40% MVC and time to 30% MVC. Since the decrease to 40% MVC takes about 1 min, sub- jects feel significant pain for a long period of time. Meanwhile, the mean time of the peak force in the PW method, which gradually increases loads, was about 83 s without large pain sensation. This time is nearly equiva- lent to the time to 30% MVC (88.8 s) in the CW method, but the force (63.9% MVC) was around twice that measured at 30% MVC. The forces exerted at 120 s in the CW and PW methods were at the 20% MVC level (PW: about 27% MVC, CW: 23% MVC). Hence, the PW method may be able to exert twice the force of the CW method at about 90 s without large pain sensation. However, the force after the peak force decreases re- markably similarly to the initial phase in the CW method, and the force after 120 s is considered to decrease to a nearly comparable level. Yamaji et al. [9] reported that the gripping force that a person can sustain without de- crease was 15% MVC (about 150 s) of maximal grip. Hence, the exertion force in the PW method also reaches an almost steady state after 120 s. Peak force in the PW method correlated significantly with time to 40% MVC in the CW method (r = 0.605). The time to 40% MVC corresponds to the phase which 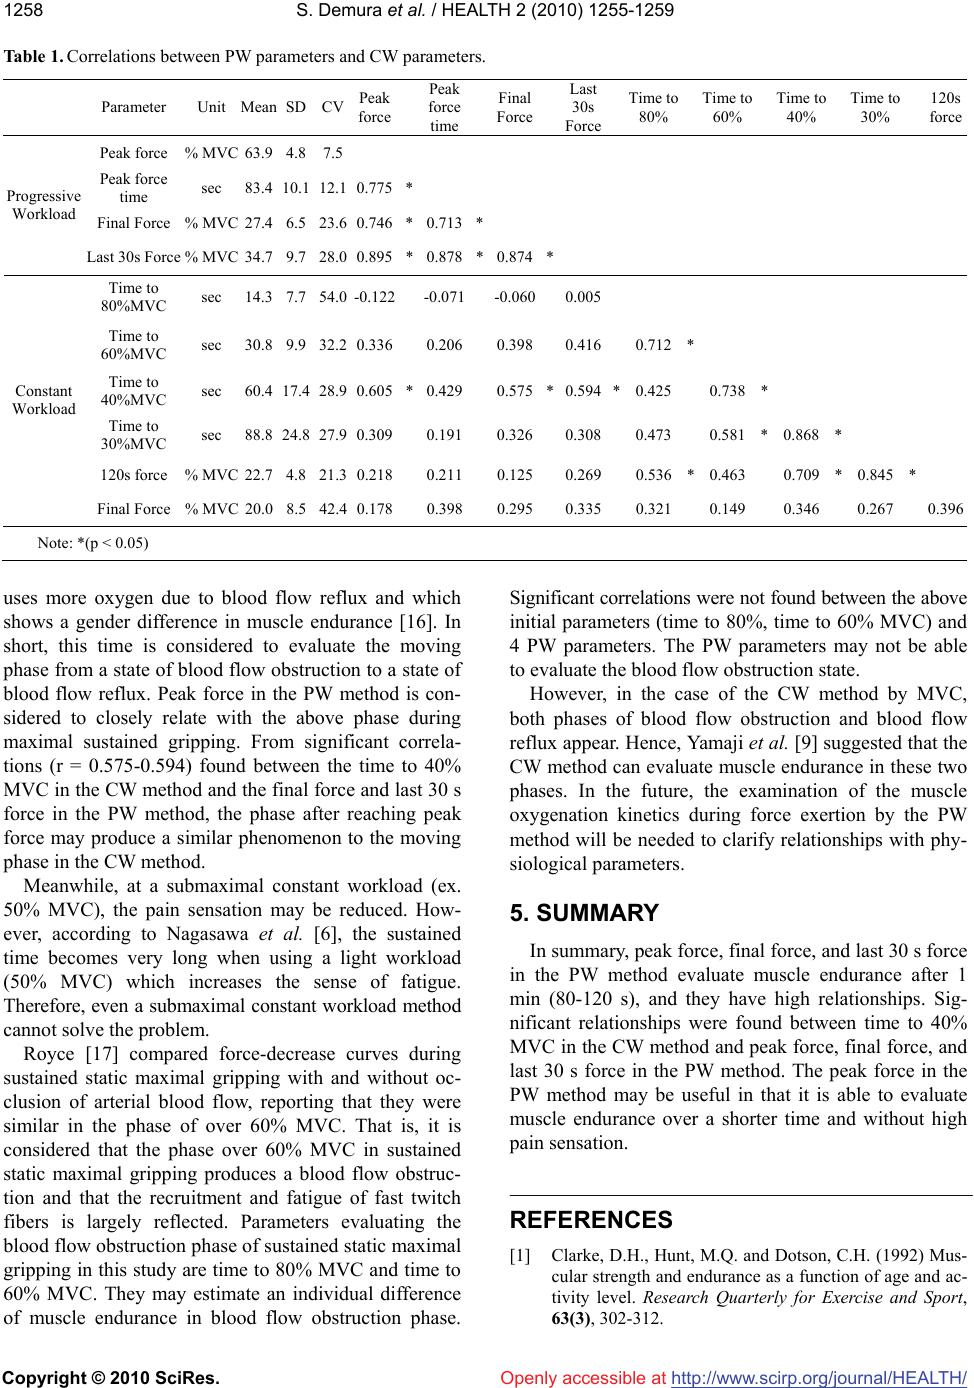 S. Demura et al. / HEALTH 2 (2010) 1255-1259 Copyright © 2010 SciRes. http://www.scirp.org/journal/HEALTH/ 1258 Table 1. Correlations between PW parameters and CW parameters. Parameter Unit Mean SD CV Peak force Peak force time Final Force Last 30s Force Time to 80% Time to 60% Time to 40% Time to 30% 120s force Peak force % MVC 63.9 4.8 7.5 Peak force time sec 83.4 10.1 12.1 0.775* Final Force % MVC 27.4 6.5 23.6 0.746*0.713* Progressive Workload Last 30s Force % MVC 34.7 9.7 28.0 0.895*0.878*0.874* Time to 80%MVC sec 14.3 7.7 54.0 -0.122-0.071-0.0600.005 Time to 60%MVC sec 30.8 9.9 32.2 0.3360.2060.3980.4160.712* Time to 40%MVC sec 60.4 17.4 28.9 0.605*0.4290.575*0.594*0.4250.738 * Time to 30%MVC sec 88.8 24.8 27.9 0.3090.1910.3260.3080.4730.581 * 0.868 * 120s force % MVC 22.7 4.8 21.3 0.2180.2110.1250.2690.536*0.463 0.709 * 0.845* Constant Workload Final Force % MVC 20.0 8.5 42.4 0.1780.3980.2950.3350.3210.149 0.346 0.2670.396 Note: *(p < 0.05) uses more oxygen due to blood flow reflux and which shows a gender difference in muscle endurance [16]. In short, this time is considered to evaluate the moving phase from a state of blood flow obstruction to a state of blood flow reflux. Peak force in the PW method is con- sidered to closely relate with the above phase during maximal sustained gripping. From significant correla- tions (r = 0.575-0.594) found between the time to 40% MVC in the CW method and the final force and last 30 s force in the PW method, the phase after reaching peak force may produce a similar phenomenon to the moving phase in the CW method. Openly accessible at Meanwhile, at a submaximal constant workload (ex. 50% MVC), the pain sensation may be reduced. How- ever, according to Nagasawa et al. [6], the sustained time becomes very long when using a light workload (50% MVC) which increases the sense of fatigue. Therefore, even a submaximal constant workload method cannot solve the problem. Royce [17] compared force-decrease curves during sustained static maximal gripping with and without oc- clusion of arterial blood flow, reporting that they were similar in the phase of over 60% MVC. That is, it is considered that the phase over 60% MVC in sustained static maximal gripping produces a blood flow obstruc- tion and that the recruitment and fatigue of fast twitch fibers is largely reflected. Parameters evaluating the blood flow obstruction phase of sustained static maximal gripping in this study are time to 80% MVC and time to 60% MVC. They may estimate an individual difference of muscle endurance in blood flow obstruction phase. Significant correlations were not found between the above initial parameters (time to 80%, time to 60% MVC) and 4 PW parameters. The PW parameters may not be able to evaluate the blood flow obstruction state. However, in the case of the CW method by MVC, both phases of blood flow obstruction and blood flow reflux appear. Hence, Yamaji et al. [9] suggested that the CW method can evaluate muscle endurance in these two phases. In the future, the examination of the muscle oxygenation kinetics during force exertion by the PW method will be needed to clarify relationships with phy- siological parameters. 5. SUMMARY In summary, peak force, final force, and last 30 s force in the PW method evaluate muscle endurance after 1 min (80-120 s), and they have high relationships. Sig- nificant relationships were found between time to 40% MVC in the CW method and peak force, final force, and last 30 s force in the PW method. The peak force in the PW method may be useful in that it is able to evaluate muscle endurance over a shorter time and without high pain sensation. REFERENCES [1] Clarke, D.H., Hunt, M.Q. and Dotson, C.H. (1992) Mus- cular strength and endurance as a function of age and ac- tivity level. Research Quarterly for Exercise and Sport, 63(3), 302-312.  S. Demura et al. / HEALTH 2 (2010) 1255-1259 Copyright © 2010 SciRes. http://www.scirp.org/journal/HEALTH/Openly accessible at 1259 [2] Huczel, H.A. and Clarke, D.H. (1992) A comparison strength and muscle endurance in strength-trained and un- trained women. European Journal of Applied Physiology and Occupational Physiology, 64(5), 467-470. [3] Laforest, S., St-Pierre, D.M., Cyr, J. and Gayton, D. (1990) Effect of age and regular exercise on muscle strength and endurance. European Journal of Applied Physiology and Occupational Physiology, 60(2), 104-111. [4] Larsson, B., Karlsson, S., Eriksson, M. and Gerdle, B. (2003) Test-retest reliability of EMG and peak torque during repetitive maximum concentric knee extensions. Journal of Electromyography and Kinesiology, 13(3), 281-287. [5] Maughan, R.J., Harmon, M., Leiper, J.B., Sale, D. and Delman, A. (1986) Endurance capacity of untrained males and females in isometric and dynamic muscular contrac- tions. European Journal of Applied Physiology and Oc- cupational Physiology, 55(4), 395-400. [6] Nagasawa, Y., Demura, S., Yoshimura, Y., Yamaji, S., Nakada, M. and Matsuzawa, J. (2000) Relationship be- tween strength exertion and subjective muscle-fatigue sensation in the relative sustained static hand gripping. Japanese Journal of Physical Fitness and Sports Medi- cine, 49(4), 495-502. [7] Nakada, M., Demura, S., Yamaji, S. and Nagasawa, Y. (2005) Examination of the reproducibility of grip force and muscle oxygenation kinetics on maximal repeated rhythmic grip exertion. Journal of Physiological An- thropology and Applied Human Science, 24(1), 1-6. [8] Yamaji, S., Demura, S., Nagasawa, Y. and Nakada, M. (2004) Relationships between decreasing force and mus- cle oxygenation kinetics during sustained static gripping. Journal of Physiological Anthropology and Applied Hu- man Science, 23(2), 41-47. [9] Yamaji, S., Demura, S., Nagasawa, Y., Nakada, M., Yo- shimura, Y., Matsuzawa, Z. and Toyoshima, Y. (2000) Examination of the parameters of static muscle endur- ance on sustained static maximal hand gripping. Japan Journal of Physical Education, 45(6), 695-706. [10] Fitchett, M.A. (1985) Predictability of Vo2max from sub- maximal cycle ergometer and bench stepping tests. Brit- ish Journal of Sports Medicine, 19(2), 85-88. [11] Okura, T., Ueno, L.M. and Tanaka, K. (1998) Evaluation of cardiorespiratory fitness by submaximal graded cy- cling test using ratings of perceived exertion in Japanese young men. Japan Journal of Physical Education, 43(2), 102-116. [12] Nakada, M., Demura, S., Yamaji, S., Minami, M., Kita- bayashi, T. and Nagasawa, Y. (2004) Relationships be- tween force curves and muscle oxygenation kinetics during repeated handgrip. Journal of Physiological An- thropology and Applied Human Science, 23(6), 191-196. [13] West, W., Hicks, A., Clements, L. and Dowling, J. (1995) The relationship between voluntary electromyogram, en- durance time and intensity of effort in isometric handgrip exercise. European Journal of Applied Physiology and Occupational Physiology, 71(4), 301-305. [14] Yamaji, S., Demura, S., Nagasawa, Y., Nakada, M. and Kitabayashi, T. (2002) The effect of measurement time when evaluating static muscle endurance during sus- tained static maximal gripping. Journal of Physiological Anthropology and Applied Human Science, 21(3), 151- 158. [15] Oldfield, R.C. (1971) The assessment and analysis of handedness: the Edinburgh inventory. Neuropsychologia, 9(1), 97-113. [16] Yamaji, S., Demura, S. and Nakada, M. (2006) Sex dif- ferences and properties of the decreasing force during sustained static grip at various target forces. Perceptual and Motor Skills, 103(1), 29-39. [17] Royce, J. (1958) Isometric fatigue curves in human mus- cle with normal and occluded circulation. The Research Quarterly, 29(2), 204-212. |