

Paper Menu >>
Journal Menu >>
 Journal of Water Resource and Protection, 2013, 5, 469-473 http://dx.doi.org/10.4236/jwarp.2013.54046 Published Online April 2013 (http://www.scirp.org/journal/jwarp) Identification of Inundation Hazard Zones in Manas Basin, China, Using Hydrodynamic Modeling and Remote Sensing Like Ning1,2, Hailong Liu1*, Anming Bao2 1Water Resources and Architectural Engineering College of Shihezi University, Shihezi, China 2Xinjiang Institute of Ecology and Geography, Chinese Academy of Sciences, Urumqi, China Email: *[email protected] Received January 9, 2013; revised February 17, 2013; accepted February 27, 2013 Copyright © 2013 Like Ning et al. This is an open access article distributed under the Creative Commons Attribution License, which permits unrestricted use, distribution, and reproduction in any medium, provided the original work is properly cited. ABSTRACT A two-dimensional hydrodynamic model, Floodarea was applied to simulate the flood inundation area and flood depth in Manas basin, China. Two scenes of Land sat TM images were also used in this research. One image was used to pro- duce the spatial distributed manning roughness to feed the model, the other one was used to delineate the actual inun- dated area by a modified NDWI method. The model and the manning roughness were validated by the comparison of simulated flood inundation extent and the corresponding actual inundated area obtained from Landsat image. The re- sults show that the actual inundation extent obtained from Landsat image was 240.45 km2, and the modeled inundation area was 276.15 km2. It indicates that manning roughness ranging from 0.025 to 0.833 is appropriate in the basin. In addition, the mo deled flood depth v aried from 0 to 7.77 m. Taking land use into account, five hazard zones were identi- fied in the study area. This study would be beneficial to flood control and disaster reduction. Keywords: Flood Inundation; Floodarea; Remote Sensing; Modified NDWI 1. Introduction Flood is one of the most recurring and devastating natu- ral hazards [1]. Human interventions and climate change have significantly effect on it [2]. Many researches show that flood intensity and frequency would increase in the future, and it must be threaten many regions of the world [3]. Accurate information on the floods is very necessary for controlling potential hazards and risks. Hydrodynami c m odel l i ng and remote sensing dat a have been widely applied to predict and evaluate the flood risk [4,5]. An integrated hydraulic modelling based on TELE- MAC-2D and remote sensing data has been used to in- vestigate the floodplain flow process by Bates et al. [6]. Patro simulated the flood inundation extent and flooding depth using MIKE FLOOD and an IRS-1D WiFS image [7]. The remote sensing can not only provide actual flood extent, but also spatial distributed parameters. They are indispensable to flood inundation models, such as the manning roughness [7]. Manas basin, a typical flood-prone inland river basin, locates in the northwest of China. It is the core of the re- gional economic zone in Xinjiang, China. However, flood events occurred frequently and caused great losses [8]. A catastrophic flood on record happened in Manas basin on the mid-July and early August in 1999 [9,10]. The flood lasted for 23 days, from July 14 to August 5. This catas- trophic flood made 17 thousand people stricken, caused the direct economic loss about 21 million (USD), and flooded tens of thousands of field. Some water conser- vancy facilities were damaged during the flood. The aim in this paper is to reproduce the devastating flood occurred 1999 and identity the hazard zones in Manas basin. The modified NDWI was introduced to de- lineate the actual flood inundation area from the Landsat TM image. The Floodarea model has been widely used to simulate the flood inundation. The main objects of this study are as follows: 1) to construct a GIS-based model Floodarea for study area and 2) to identity the hazard zones according to the simulated flood depth and in the Manas rive r basin. 2. Methodology and Study Area 2.1. Hydrodynamic Model The Floodarea, a two-dimensional hydrodynamic model, developed by Geomer Company, has been applied for *Corresponding a uthor. C opyright © 2013 SciRes. JWARP  L. K. NING ET AL. 470 flood inundation widely [11-15]. It is completely embed- ded into the graphical user interface of ArcGIS desktop [16]. Floodarea model takes full advantage of ESRI Grids on hydrodynamic modeling, accomplishes the data fusion of hydrologic and hydrodynamic. Drainage net- work grids with water levels, hydrographs and rainstorm feed the model with floods. The gradient is defined by the difference between the lowest water level and the highest terrain elevation found in the cell and the neigh- boring cells. The smallest iteration time step can be ad- justed dynamically. An important control criterion for this adjustment is the amount of water available. If the discharge rates become too larg e co mpared with the avai- lable volume, the iteration time step would be reduced. Only water level changes exceeding 1 mm are considered by that control mechanism. If the volumes exchanged be- tween cells are very small, the iteration time step would increase automatically. This permanent optimization kee ps processing time at a minimum [16,17]. Roughness value is very important for the accurate simulation. The hydrodynamic approach was used to cal- culate the inundation area in this study. The discharge volume to the neighboring cells was calculated using the Manning-St ri ckler formul a (Equat i on (1 )) . 23 12 QARI n (1) where Q is flood discharge (m3/s), A is the flood section area of the watercourse (m2), n is the roughness, R is the hydraulic radius, RAX level elevation a ab NDWI WI MNDWI , X is the wetted perimeter of flood section, and I is the hydrau lic gradient. The flow depth during an iteration interval is taken from the difference between water level and maximum terrain elevation along th e flow path (Equ a tion (2 )). flow depthwater max elevation (2) 2.2. Flood Extent Water can be distinguished from other feature types based on its strong spectral absorption characteristics. McFeeters [18] proposed a Normalized Difference Water Index method for Landsat TM to make a dis- tinction between water features and other feature types. However, the extracted water information in water re- gions with built-up land background was often mixed. Some built-up land features and self-shadowed areas are misclassified as water bodies. Here we choose the modified to identify water bodies. The MND WI was a further deve- lopment of NDWI by Xu [19]. It can be defined as fol- lows: ND Green where Green is a green band such as TM2, MIR is a middle infrared ban d suc h as TM 5. The MNDWI can not only reveal subtle features of water more efficiently than NDWI, but also remove sha- dow effects on water [19]. 2.3. Generation of Manning Roughness In order to get a spatially-distributed manning roughness image (friction coefficients), a friction coefficients me- thod was introduction [7]. In this method, a representa- tive manning image (friction coefficients) can be derived from land cover. Firstly, the land cover was classified us- ing maximum likelihood (ML) and fuzzy c-means meth- ods. Two images of land cover proportions were obtained for each land cover class. Then friction coefficients were generated for the two classifications. In the ML classifi- cation, friction coefficients were estimated from land cover using a look-up table. In the fuzzy c-means image, pixels represent the proportion of each class. The images of land cover pr oportions g enerated for a study ar ea were combined into a single image of friction using: Green M NDWI MIR MIR (3) 1 1 c cc p nn 42 .6510km (4) 2.4. Study Area Manas Basin lies to the north of the Tianshan Mountains and covers a surface area about 2 be- tween latitudes 43˚20'N - 45 ˚55'N and longitudes 85˚00'E - 87˚00'E (Figure 1). Manas River, the largest inland river at the north slope of Tianshan Mountain, has 10 tri- butaries. Its geomorphological types include alpine, low mountains, alluvial-fan plain and desert. The average an- nual temperature is 6.5˚C. The average annual precipi- tation ranges from 100 to 200 mm. The average annual evaporation ranges from 1500 to 2000 mm. Kensiwate station is the con trol station at the confluence of tributar- ies. The average annual runoff is about 12.8 × 10⁸ m3, and the annual runoff is 39.7 m3/s. The main soil is grey cinnamon soil. 2.5. Basis Data The typical catastrophic flood hydrograph, the Digital Elevation Model data (DEM) and the Manning grid are essential input for the model. More details as follows: 1) A high resolution digital elevation model (DEM), with a horizontal grid resolution of 5 × 5 m, was adopted in this study. It was produced by d igitizing a 1:10,0 00 to- pographic map, which is provided by the Surveying and Mapping Bureau of Xinjiang Uygur Autonomous Region. The production process was carried out in accordance with the standards of the Nation Bureau of Surveying and Copyright © 2013 SciRes. JWARP 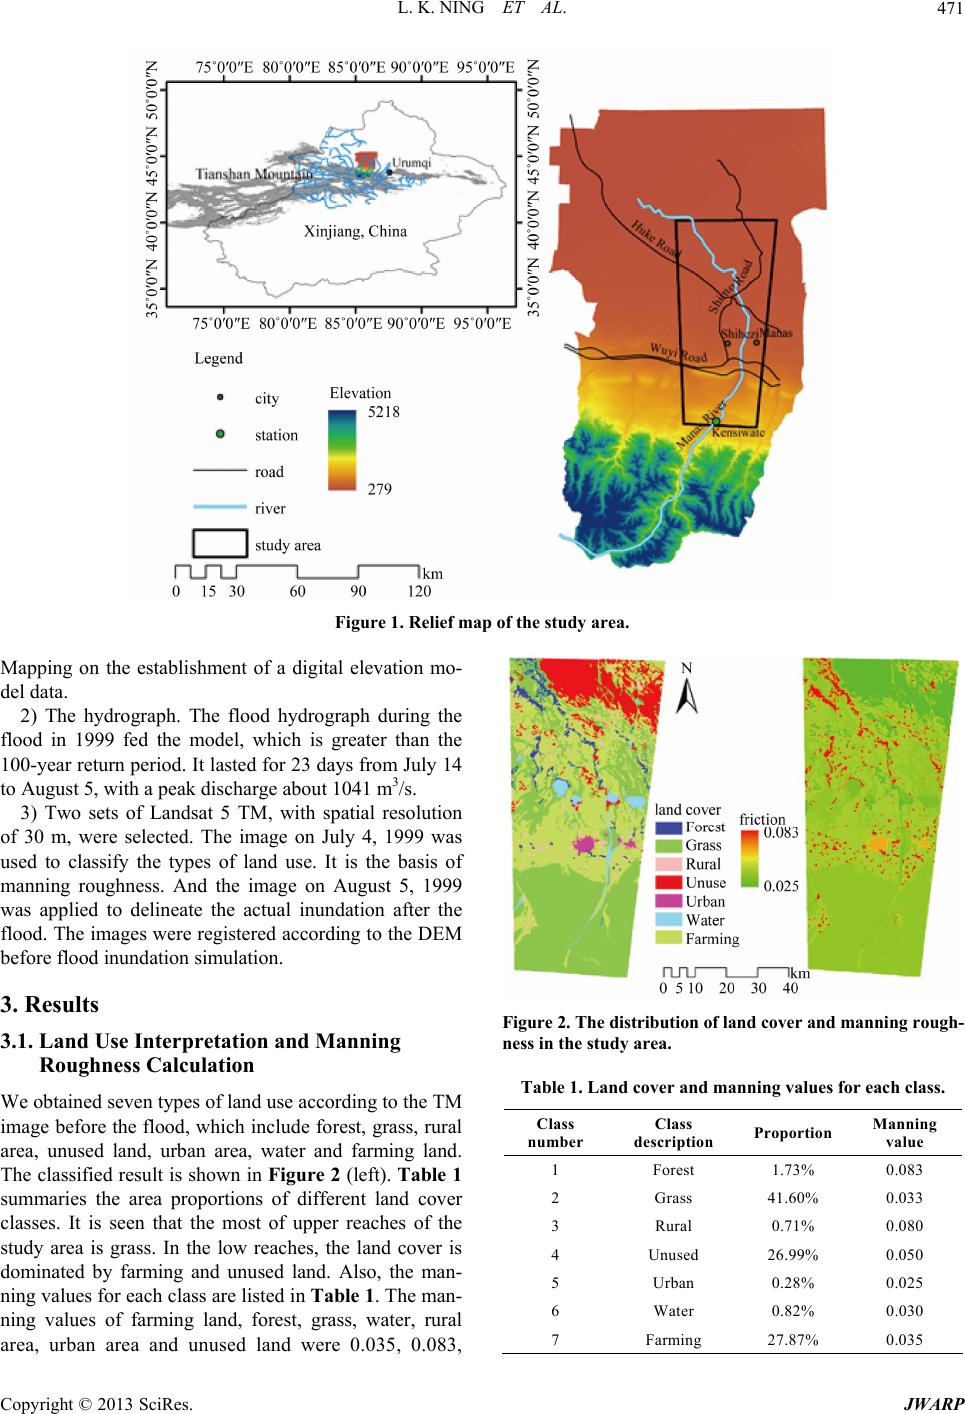 L. K. NING ET AL. JWARP 471 Figure 1. Relief map of the study area. Mapping on the establishment of a digital elevation mo- del data. 2) The hydrograph. The flood hydrograph during the flood in 1999 fed the model, which is greater than the 100-year return period. It lasted for 23 days from July 14 to August 5, with a peak discharge about 1041 m3/s. 3) Two sets of Landsat 5 TM, with spatial resolution of 30 m, were selected. The image on July 4, 1999 was used to classify the types of land use. It is the basis of manning roughness. And the image on August 5, 1999 was applied to delineate the actual inundation after the flood. The images were registered according to the DEM before flood inundation simulation. 3. Results Figure 2. The distribution of land cover and manning r ough- ness in the study area. 3.1. Land Use Interpretation and Manning Roughness Calculation Table 1. Land cover and manning values for each class. We obtained seven types of land use accordin g to the TM image before the flood, which include forest, grass, rural area, unused land, urban area, water and farming land. The classified result is shown in Figure 2 (left). Table 1 summaries the area proportions of different land cover classes. It is seen that the most of upper reaches of the study area is grass. In the low reaches, the land cover is dominated by farming and unused land. Also, the man- ning values for each class are listed in Table 1. The man- ning values of farming land, forest, grass, water, rural area, urban area and unused land were 0.035, 0.083, Class number Class description Proportion Manning value 1 Forest 1.73% 0.083 2 Grass 41.60% 0.033 3 Rural 0.71% 0.080 4 Unused 26.99% 0.050 5 Urban 0.28% 0.025 6 Water 0.82% 0.030 7 Farming 27.87% 0.035 Copyright © 2013 SciRes. 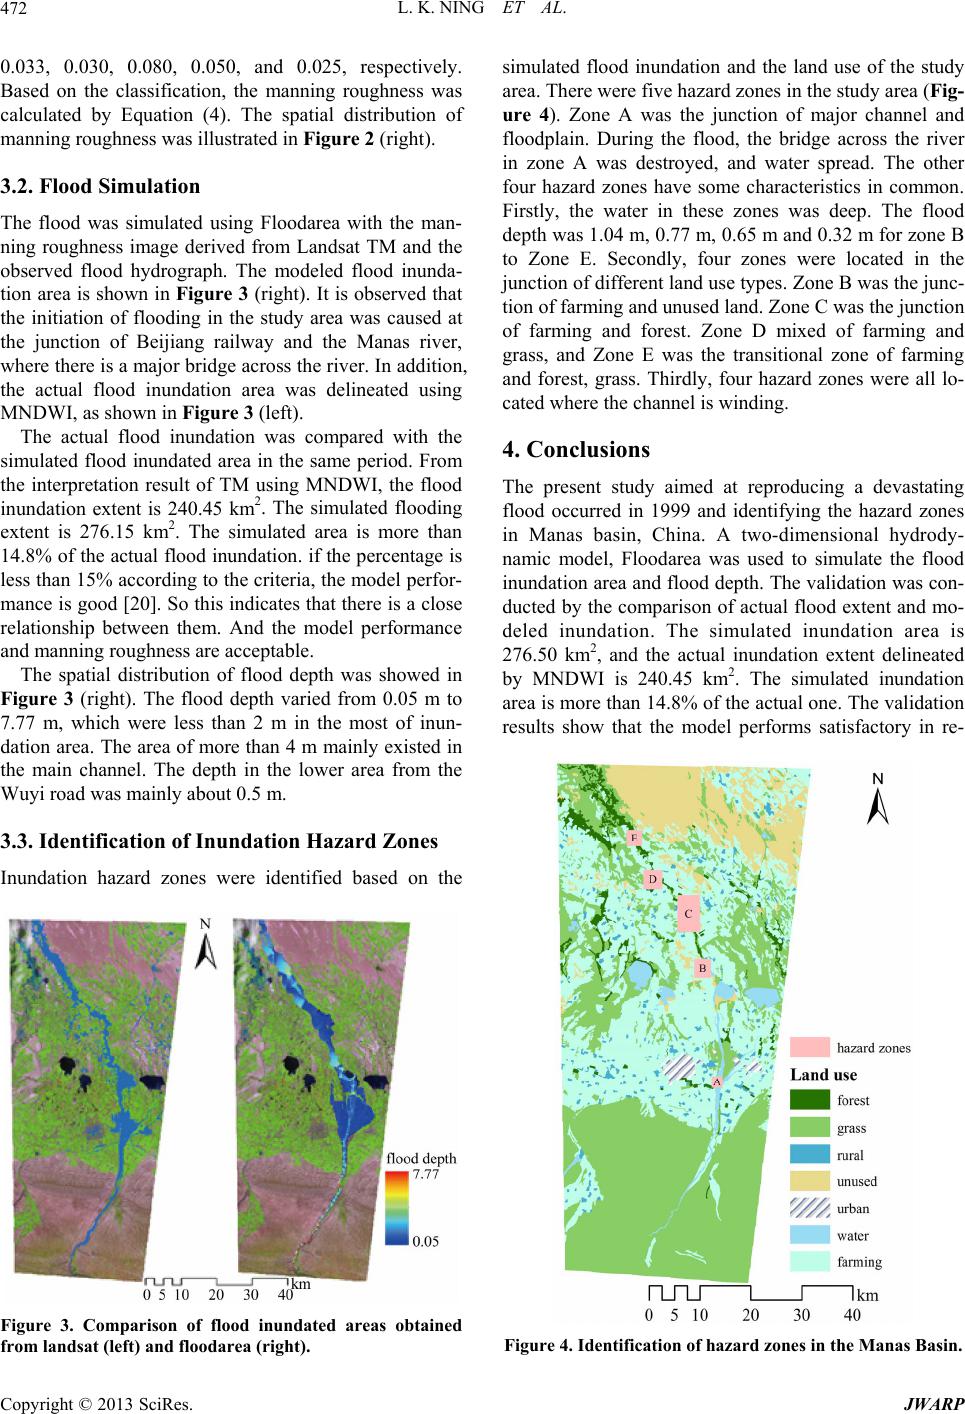 L. K. NING ET AL. 472 0.033, 0.030, 0.080, 0.050, and 0.025, respectively. Based on the classification, the manning roughness was calculated by Equation (4). The spatial distribution of manning roughness was illustrated in Figure 2 (right). 3.2. Flood Simulation The flood was simulated using Floodarea with the man- ning roughness image derived from Landsat TM and the observed flood hydrograph. The modeled flood inunda- tion area is shown in Figure 3 (right). It is observed that the initiation of flooding in the study area was caused at the junction of Beijiang railway and the Manas river, where there is a major bridge across the river. In addition, the actual flood inundation area was delineated using MNDWI, as shown in Figure 3 (left). The actual flood inundation was compared with the simulated flood inundated area in the same period. From the interpretation result of TM using MNDWI, the flood inundation extent is 240.45 km2. The simulated flooding extent is 276.15 km2. The simulated area is more than 14.8% of the actual flood inundation. if the percentage is less than 15% according to the criteria, the model perfor- mance is good [20]. So this indicates that there is a close relationship between them. And the model performance and manning roughness are acceptable. The spatial distribution of flood depth was showed in Figure 3 (right). The flood depth varied from 0.05 m to 7.77 m, which were less than 2 m in the most of inun- dation area. The area of more than 4 m mainly existed in the main channel. The depth in the lower area from the Wuyi road was mainly about 0.5 m. 3.3. Identification of Inundation Hazard Zones Inundation hazard zones were identified based on the Figure 3. Comparison of flood inundated areas obtained from landsat (left) and floodarea (right). simulated flood inundation and the land use of the study area. There were five hazard zones in the study area (Fig- ure 4). Zone A was the junction of major channel and floodplain. During the flood, the bridge across the river in zone A was destroyed, and water spread. The other four hazard zones have some characteristics in common. Firstly, the water in these zones was deep. The flood depth was 1.04 m, 0.77 m, 0.65 m and 0.32 m for zone B to Zone E. Secondly, four zones were located in the junction of different land use types. Zone B was the junc- tion of farming and unused land. Zone C was the junction of farming and forest. Zone D mixed of farming and grass, and Zone E was the transitional zone of farming and forest, grass. Thirdly, four hazard zones were all lo- cated where the channel is winding. 4. Conclusions The present study aimed at reproducing a devastating flood occurred in 1999 and identifying the hazard zones in Manas basin, China. A two-dimensional hydrody- namic model, Floodarea was used to simulate the flood inundation area and flood depth. The validation was con- ducted by the comparison of actual flood extent and mo- deled inundation. The simulated inundation area is 276.50 km2, and the actual inundation extent delineated by MNDWI is 240.45 km2. The simulated inundation area is more than 14.8% of the actual one. The validation results show that the model performs satisfactory in re- Figure 4. Identification of hazard zones in the Manas Basin. Copyright © 2013 SciRes. JWARP  L. K. NING ET AL. Copyright © 2013 SciRes. JWARP 473 producing the serious flood, and the spatial distributed manning roughness is appropriate. The manning rough- ness varied from 0.25 to 0.833 in the study area. And the flood depth varied 0 to 7.77 m in the study area. Further- more, five hazard zones were identified according to the simulated flood depth, and the land use classified from the Landsat image. The spatial distributed manning roughness image may be used to simulate the flood inundation extent and flood depth in the study area caused by floods. And the iden- tification of hazard zones has been adopted for Manas basin water resources management and flood preventing strategies. 5. Acknowledgements This work was supported by the National 973 Key Pro- ject of China (2010 CB951004), the National Natur al Sci- ence Foundation of China (41161008), National support project (2012BAH27B03) and Team innovation project of Shihezi University (2011ZRKXTD-0304). REFERENCES [1] S. I. Khan, Y. Hong, J. Wang, K. K. Yilmaz, J. J. Gourley , R. F. Adler, G. R. Brakenridge, F. Policelli, S. Habib a nd D. Irwin, “Satellite Remote Sensing and Hydrologic Mo- deling for Flood Inundation Mapping in Lake Victoria Basin: Implications for Hy drologi c Prediction in Ung aug ed Basins,” IEEE Transactions on Geoscience and Remote Sensing, Vol. 49, No. 1, 2011, pp. 85-95. doi:10.1109/TGRS.2010.2057513 [2] K. Gaurav, R. Sinha and P. K. Panda, “The Indus Flood of 2010 in Pakistan: A Perspective Analysis Using Re- mote Sensing Data,” Natural Hazards, Vol. 59, No. 3, 2011, pp. 1815-1826. doi:10.1007/s11069-011-9869-6 [3] S. N. Jonkman, “Global Perspectives on Loss of Human Life Caused by Floods,” Natural Hazards, Vol. 34, No. 2, 2005, pp. 151-175. doi:10.1007/s11069-004-8891-3 [4] P. D. Bates, “Integrating Remote Sensing Data with Flood Inundation Models: How Far Have We Got?” Hydrolo- gical Processes, Vol. 26, No. 16, 2012, pp. 2515-2521. doi:10.1002/hyp.9374 [5] P. D. Bates, “Remote Sensing and Flood Inundation Mod- elling,” Hydrological Processes, Vol. 18, No. 13, 2004, pp. 2593-2597. doi:10.1002/hyp.5649 [6] P. D. Bates, M. S. Horritt, C. N. Smith and D. Mason, “Integrating Remote Sensing Observations of Flood Hy- drology and Hydraulic Modelling,” Hydrological Proc- esses, Vol. 11, No. 14, 1997, pp. 1777-1795. doi:10.1002/(SICI)1099-1085(199711)11:14<1777::AID- HYP543>3.0.CO;2-E [7] M. D. Wilson and P. M. Atkinson, “The Use of Remotely Sensed Land Cover to Derive Floodplain Friction Coeffi- cients for Flood Inundation Modelling,” Hydrological Processes, Vol. 21, No. 26, 2007, pp. 3576-3586. doi:10.1002/hyp.6584 [8] F. Q. Jiang, “New Tendency in Flood Disasters in Xinji- ang during the Second Half of the 20th Century,” Journal of Catastrophology, Vol. 19, No. 2, 2004, pp. 31-37 (in Chinese). [9] S. F. Wu, “Flood Features in Midsummer of 1999 in Xin- jiang,” Hydrology, Vol. 22, No. 2, 2002, pp. 58-60 (in Chinese). [10] Q. Y. Peng, L. Wang, Y. Li and B. Liu, “Analy sis of Co n- tributing Factors to the Worst Flood in Manas River in August 1999,” Bimonthly of Xinjiang Meteorology, Vol. 23, No. 1, 2000, pp. 3-5 (in Chinese). [11] M. Gemmer, “GIS/RS-Based Flood Risk Mapping for the Eastern Honghu Flood Diversion Area,” Journal of Lake Sciences, Vol. 15, 2003, pp. 166-172. [12] M. Gemmer, “Transferability of European Flood Impact Estimation Techniques to the Yangtze River Catchment and Possible Adaptations,” Journal of Lake Sciences, Vol. 15, 2003, pp. 173-183. [13] B. D. Su, T. Jiang, Y. Y. Guo and M. Gemmer, “GIS Raster Data-Based Dynamic Flood Risk Simulation Mo- del and Its Application,” Journal of Hohai University (Natural Sciences), Vol. 33, No. 4, 2005, pp. 370-374 (in Chinese). [14] M. Gemmer, G. J. Wang and T. Jiang, “Dynamic Inunda- tion Risk Identification and Estimation of the Potential Loss in Honghu Flood Diversion Area, China,” Journal of Lake Sciences, Vol. 18, No. 5, 2006, pp. 464-469. [15] X. Chen, Y. Huang, J. Qian, H. L. Liu, X. W. Feng, Y. Liu, A. M. Bao and W. S. Wang, “Simulation Analysis on the Regulation of Overflow Ecological Water Consump- tion in Arid Areas,” Science in China Series D: Earth Sci- ences, Vol. 50, No. 1, 2007, pp. 1-8. doi:10.1007/s11430-007-5009-2 [16] Geomer, “Flodarea-Arcview Extension for Calculating Flooded Areas, User Manual, Version 9.0,” Geomer Hei- delberg, 2006. [17] Geomer, “Flodarea-Arcview Extension for Calculating Flooded Areas, User Manual, Version 2.4,” Geomer Hei- delberg, 2002. [18] S. K. McFeeters, “The Use of the Normalized Difference Water Index (NDWI) in the Delineation of Open Water Features,” International Journal of Remote Sensing, Vol. 17, No. 7, 1996, pp. 1425-1432. doi:10.1080/01431169608948714 [19] H. Xu, “Modification of Normalised Difference Water Index (NDWI) to Enhance Open Water Features in Re- motely Sensed Imagery,” International Journal of Remote Sensing, Vol. 27, No. 14, 2006, pp. 3025-3033. doi:10.1080/01431160600589179 [20] D. N. Moriasi, J. G. Arnold, M. W. V. Liew, R. L. Bing- ner, R. D. Harmel and T. L. Veith, “Model Evaluation Guidelines for Systematic Quantification of Accuracy in Watershed Simulations,” Transactions of the ASABE, Vol. 50, No. 3, 2007, pp. 885-900. |