

Paper Menu >>
Journal Menu >>
 Journal of Water Resource and Protection, 2013, 5, 440-445 http://dx.doi.org/10.4236/jwarp.2013.54043 Published Online April 2013 (http://www.scirp.org/journal/jwarp) Assessment of the Impact of the Landfill on Groundwater Quality: A Case Study of the Mediouna Site, Casablanca, Morocco Driss Smahi, Ouafa El Hammoumi, Ahmed Fekri Department of Geology, Faculty of Sciences Ben M’sick, Casablanca, Morocco Email: [email protected] Received January 23, 2013; revised February 25, 2013; accepted March 9, 2013 Copyright © 2013 Driss Smahi et al. This is an open access article distributed under the Creative Commons Attribution License, which permits unrestricted use, distribution, and reproduction in any medium, provided the original work is properly cited. ABSTRACT A local case study for the environmental impact of landfill leachate on groundwater quality along and across the Medi- ouna landfill is presented, based on physicochemical and statistical approaches. The landfill has been operational since 1986 and it receives municipal solid wastes produced by the city of Casablanca, whose the daily waste output exceeds 4000 t. This waste is stockpiled in old sandstone quarries; the site has never been sealed before its opening. The aim of this study is to update the knowledge about groundwater quality around the landfill, to determine the factors controlling the extent of groundwater contamination and compare the results with those of 1989 and 2001. To evaluate groundwater pollution due to this landfill, piezometric level and geochemical analyses have been carried out on 19 wells. The phys- icochemical data of groundwater down-gradient of the landfill site is showing a deterioration of its quality, to the point that the wells have become unusable. The statistical treatment of physicochemical data by principal components analy- sis allowed the mapping of three areas downstream of the landfill. The first is hardly polluted, the second is moderately polluted and the third is characterized by mineralization through their waters and the almost absence of organic matter. The extent of groundwater contamination from an area with a radius of 200 m in 1989, to an area with a radius of about 1 km in 2001 to more 2 km as of today. This extension is controlled by the structural factor of faults, by the lithology of aquiferous and the intensity of water pumping; the wells equipped with pumps exert pressure against the advanced front of the pollution. Keywords: Leachate; Landfill; Groundwater; Pollution; Morocco 1. Introduction The consequences of solid waste disposal in landfills are gas and leachate generation due primarily to microbial decomposition, climatic conditions, refuse characteristics and landfilling operations. The quantity of leachate gene- rated is site-specific and a function of water availability and weather conditions as well as the characteristics of the refuse, the landfill surface, and underlying soil [1-6]. The quality of landfill leachate is highly dependent upon the stage of fermentation in the landfill, waste decompo- sition, operational procedures, and co-disposal of Indus- trial wastes [7-10]. Mediouna’s landfill receives waste from the entire Ca- sablanca metropolis, whose population and growth are constantly increasing. Indeed, the daily quantity received by the landfill has increased from 2.1 T in 1989 to 2600 T in 2000 to more than 3200 T in 2008 of wastes of dif- ferent types, ranging from organic to inorganic, hazard- ous and non-hazardous [11-14]. The site is considered the largest nationally and it has no waterproof device or any leachate drainage system and biogases collection. The quantity estimated daily amount of leachate is 1277 m3/d in 2007. While the leachate poses a threat to under- lying groundwater [14-17], the site selection was how- ever dictated by the availability of public land, and the fact that it didn’t have to conform to any environmental regulations at the date of its opening. The objectives of this study are to update the current data on groundwater pollution, and that will eventually be compared to those of 1989 [16], and 2001 [17] in or- der to examine the extent of pollutants and to determine the factors controlling the advancing front of pollution after more than two decades of implementation of this landfill, and to establish a baseline of water quality on the eve of the closure of the landfill in order to designate C opyright © 2013 SciRes. JWARP 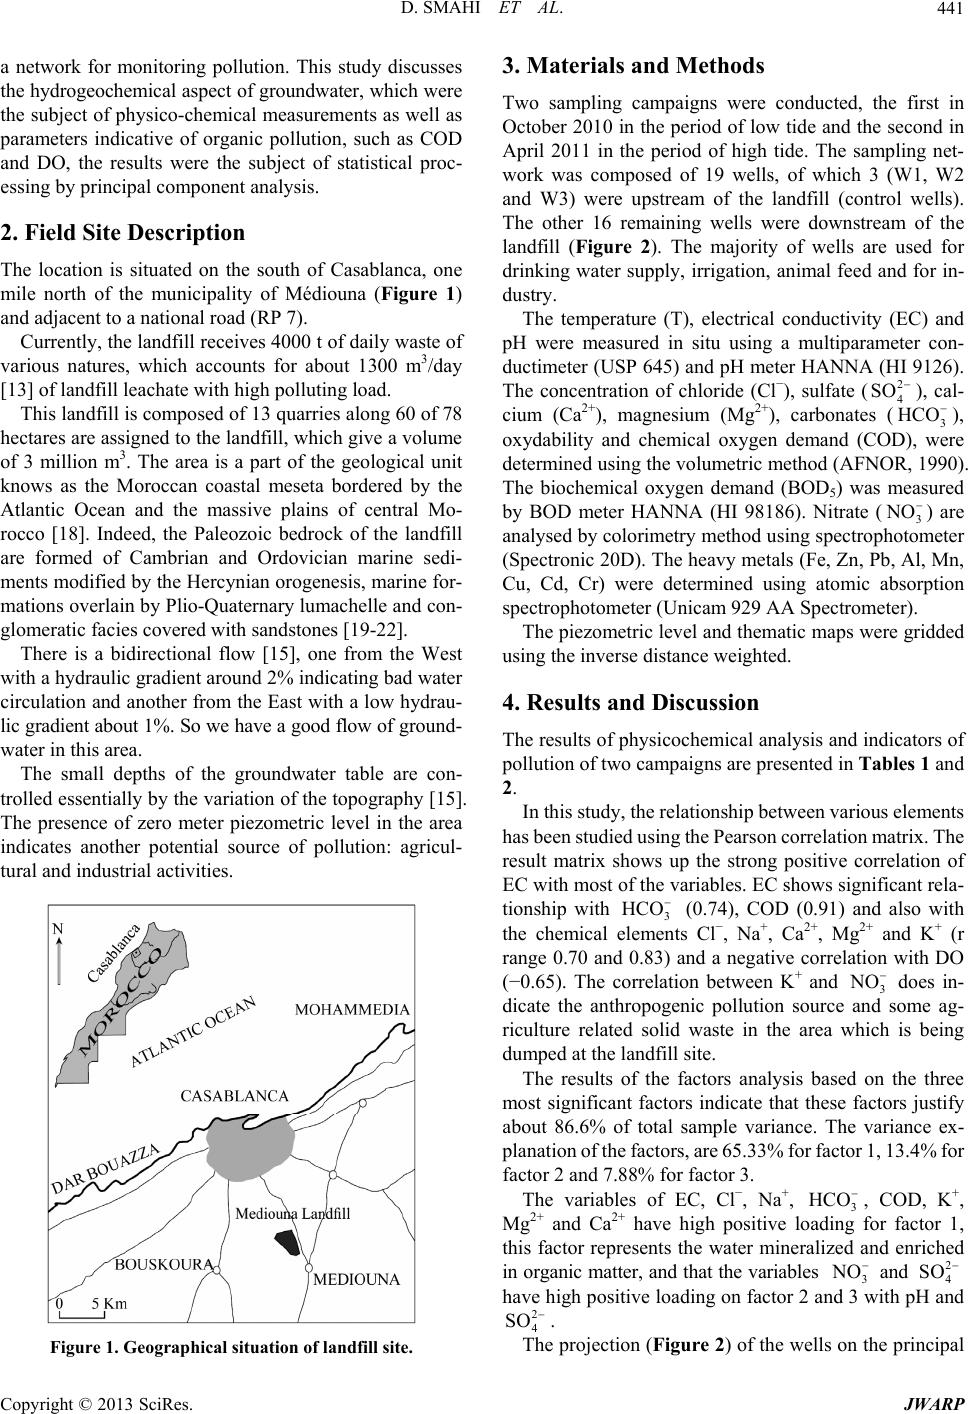 D. SMAHI ET AL. 441 a network for monitoring pollution. This study discusses the hydrogeochemical aspect of groundwater, which were the subject of physico-chemical measurements as well as parameters indicative of organic pollution, such as COD and DO, the results were the subject of statistical proc- essing by principal component analysis. 2. Field Site Description The location is situated on the south of Casablanca, one mile north of the municipality of Médiouna (Figure 1) and adjacent to a national road (RP 7). Currently, the landfill receives 4000 t of daily waste of various natures, which accounts for about 1300 m3/day [13] of landfill leachate with high polluting load. This landfill is composed of 13 quarries along 60 of 78 hectares are assigned to the landfill, which give a volume of 3 million m3. The area is a part of the geological unit knows as the Moroccan coastal meseta bordered by the Atlantic Ocean and the massive plains of central Mo- rocco [18]. Indeed, the Paleozoic bedrock of the landfill are formed of Cambrian and Ordovician marine sedi- ments modified by the Hercynian orogenesis, marine for- mations overlain by Plio-Quaternary lumachelle and con- glomeratic facies covered with sandstones [19-22]. There is a bidirectional flow [15], one from the West with a hydraulic gradient around 2% indicating bad water circulation and another from the East with a low hydrau- lic gradient about 1%. So we have a good flow of ground- water in this area. The small depths of the groundwater table are con- trolled essentially by the variation of the topography [15]. The presence of zero meter piezometric level in the area indicates another potential source of pollution: agricul- tural and industrial activities. Figure 1. Geographical situation of landfill site. 3. Materials and Methods Two sampling campaigns were conducted, the first in October 2010 in the period of low tide and the second in April 2011 in the period of high tide. The sampling net- work was composed of 19 wells, of which 3 (W1, W2 and W3) were upstream of the landfill (control wells). The other 16 remaining wells were downstream of the landfill (Figure 2). The majority of wells are used for drinking water supply, irrigation, animal feed and for in- dustry. The temperature (T), electrical conductivity (EC) and pH were measured in situ using a multiparameter con- ductimeter (USP 645) and pH meter HANNA (HI 9126). The concentration of chloride (Cl−), sulfate (SO2 4 ), cal- cium (Ca2+), magnesium (Mg2+), carbonates (3 HCO ), oxydability and chemical oxygen demand (COD), were determined using the volumetric method (AFNOR, 1990). The biochemical oxygen demand (BOD5) was measured by BOD meter HANNA (HI 98186). Nitrate (3 NO ) are analysed by colorimetry method using spectrophotometer (Spectronic 20D). The heavy metals (Fe, Zn, Pb, Al, Mn, Cu, Cd, Cr) were determined using atomic absorption spectrophotometer (Unicam 929 AA Spectrometer). The piezometric level and thematic maps were gridded using the inverse distance weighted. 4. Results and Discussion The results of physicochemical analysis and indicators of pollution of two campaigns are presented in Tables 1 and 2. In this study, the relationship between various elements has been studied using the Pearson correlation matrix. The result matrix shows up the strong positive correlation of EC with most of the variables. EC shows significant rela- tionship with 3 HCO (0.74), COD (0.91) and also with the chemical elements Cl−, Na+, Ca2+, Mg2+ and K+ (r range 0.70 and 0.83) and a negative correlation with DO (−0.65). The correlation between K+ and 3 NO does in- dicate the anthropogenic pollution source and some ag- riculture related solid waste in the area which is being dumped at the landfill site. The results of the factors analysis based on the three most significant factors indicate that these factors justify about 86.6% of total sample variance. The variance ex- planation of the factors, are 65.33% for factor 1, 13.4% for factor 2 and 7.88% for factor 3. The variables of EC, Cl−, Na+, 3, COD, K+, Mg2+ and Ca2+ have high positive loading for factor 1, this factor represents the water mineralized and enriched in organic matter, and that the variables 3 and 4 SO HCO NO 2 have high positive loading on factor 2 and 3 with pH and 2 SO 4. The projection (Figure 2) of the wells on the principal Copyright © 2013 SciRes. JWARP 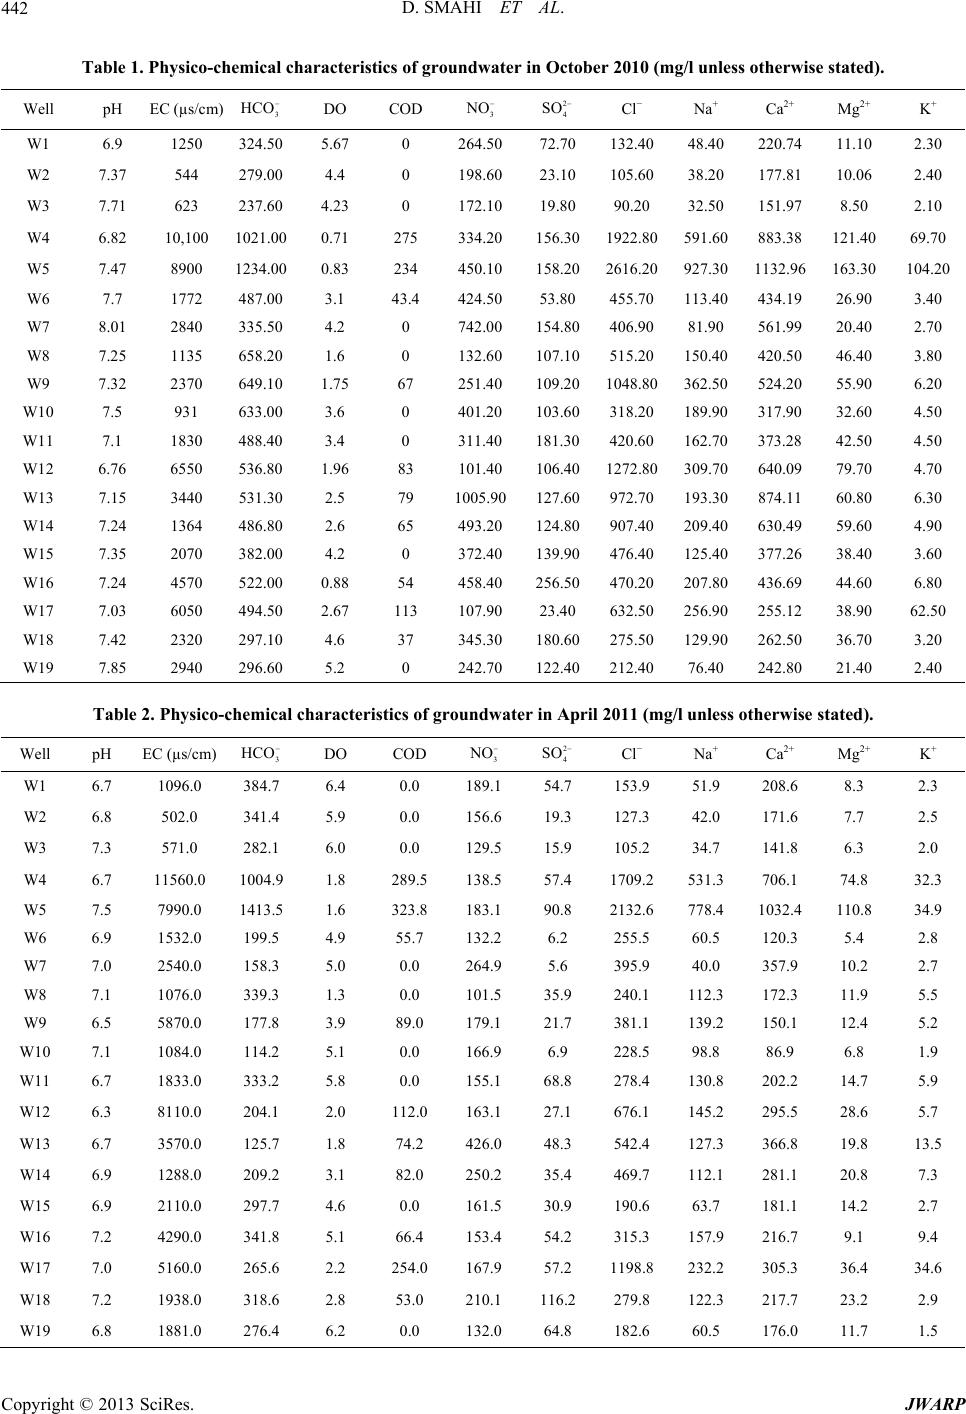 D. SMAHI ET AL. Copyright © 2013 SciRes. JWARP 442 3 HCO 3 NO Table 1. Physico-chemical characteristics of groundwater in October 2010 (mg/l unless otherwise stated). 2 4 SO Well pH EC (µs/cm) DO COD Cl− Na+ Ca2+ Mg2+ K + W1 6.9 1250 324.50 5.67 0 264.50 72.70 132.4048.40 220.74 11.10 2.30 W2 7.37 544 279.00 4.4 0 198.60 23.10 105.6038.20 177.81 10.06 2.40 W3 7.71 623 237.60 4.23 0 172.10 19.80 90.20 32.50 151.97 8.50 2.10 W4 6.82 10,100 1021.00 0.71 275 334.20 156.301922.80591.60883.38 121.4069.70 W5 7.47 8900 1234.00 0.83 234 450.10 158.202616.20927.301132.96 163.30104.20 W6 7.7 1772 487.00 3.1 43.4 424.50 53.80 455.70113.40434.19 26.90 3.40 W7 8.01 2840 335.50 4.2 0 742.00 154.80406.90 81.90 561.99 20.40 2.70 W8 7.25 1135 658.20 1.6 0 132.60 107.10515.20150.40420.50 46.40 3.80 W9 7.32 2370 649.10 1.75 67 251.40 109.201048.80362.50524.20 55.90 6.20 W10 7.5 931 633.00 3.6 0 401.20 103.60318.20189.90317.90 32.60 4.50 W11 7.1 1830 488.40 3.4 0 311.40 181.30420.60162.70373.28 42.50 4.50 W12 6.76 6550 536.80 1.96 83 101.40 106.401272.80309.70640.09 79.70 4.70 W13 7.15 3440 531.30 2.5 79 1005.90127.60972.70193.30874.11 60.80 6.30 W14 7.24 1364 486.80 2.6 65 493.20 124.80907.40209.40630.49 59.60 4.90 W15 7.35 2070 382.00 4.2 0 372.40 139.90476.40125.40377.26 38.40 3.60 W16 7.24 4570 522.00 0.88 54 458.40 256.50470.20207.80436.69 44.60 6.80 W17 7.03 6050 494.50 2.67 113 107.90 23.40 632.50256.90255.12 38.90 62.50 W18 7.42 2320 297.10 4.6 37 345.30 180.60275.50129.90262.50 36.70 3.20 W19 7.85 2940 296.60 5.2 0 242.70 122.40212.4076.40 242.80 21.40 2.40 Table 2. Physico-chemical characteristics of groundwater in April 2011 (mg/l unless otherwise stated). Well pH EC (µs/cm) 3 HCO 3 NO DO COD 2 4 SO Cl− Na+ Ca2+ Mg2+ K + W1 6.7 1096.0 384.7 6.4 0.0 189.1 54.7 153.9 51.9 208.6 8.3 2.3 W2 6.8 502.0 341.4 5.9 0.0 156.6 19.3 127.3 42.0 171.6 7.7 2.5 W3 7.3 571.0 282.1 6.0 0.0 129.5 15.9 105.2 34.7 141.8 6.3 2.0 W4 6.7 11560.0 1004.9 1.8 289.5 138.5 57.4 1709.2531.3 706.1 74.8 32.3 W5 7.5 7990.0 1413.5 1.6 323.8 183.1 90.8 2132.6778.4 1032.4 110.8 34.9 W6 6.9 1532.0 199.5 4.9 55.7 132.2 6.2 255.5 60.5 120.3 5.4 2.8 W7 7.0 2540.0 158.3 5.0 0.0 264.9 5.6 395.9 40.0 357.9 10.2 2.7 W8 7.1 1076.0 339.3 1.3 0.0 101.5 35.9 240.1 112.3 172.3 11.9 5.5 W9 6.5 5870.0 177.8 3.9 89.0 179.1 21.7 381.1 139.2 150.1 12.4 5.2 W10 7.1 1084.0 114.2 5.1 0.0 166.9 6.9 228.5 98.8 86.9 6.8 1.9 W11 6.7 1833.0 333.2 5.8 0.0 155.1 68.8 278.4 130.8 202.2 14.7 5.9 W12 6.3 8110.0 204.1 2.0 112.0 163.1 27.1 676.1 145.2 295.5 28.6 5.7 W13 6.7 3570.0 125.7 1.8 74.2 426.0 48.3 542.4 127.3 366.8 19.8 13.5 W14 6.9 1288.0 209.2 3.1 82.0 250.2 35.4 469.7 112.1 281.1 20.8 7.3 W15 6.9 2110.0 297.7 4.6 0.0 161.5 30.9 190.6 63.7 181.1 14.2 2.7 W16 7.2 4290.0 341.8 5.1 66.4 153.4 54.2 315.3 157.9 216.7 9.1 9.4 W17 7.0 5160.0 265.6 2.2 254.0 167.9 57.2 1198.8232.2 305.3 36.4 34.6 W18 7.2 1938.0 318.6 2.8 53.0 210.1 116.2 279.8 122.3 217.7 23.2 2.9 W19 6.8 1881.0 276.4 6.2 0.0 132.0 64.8 182.6 60.5 176.0 11.7 1.5 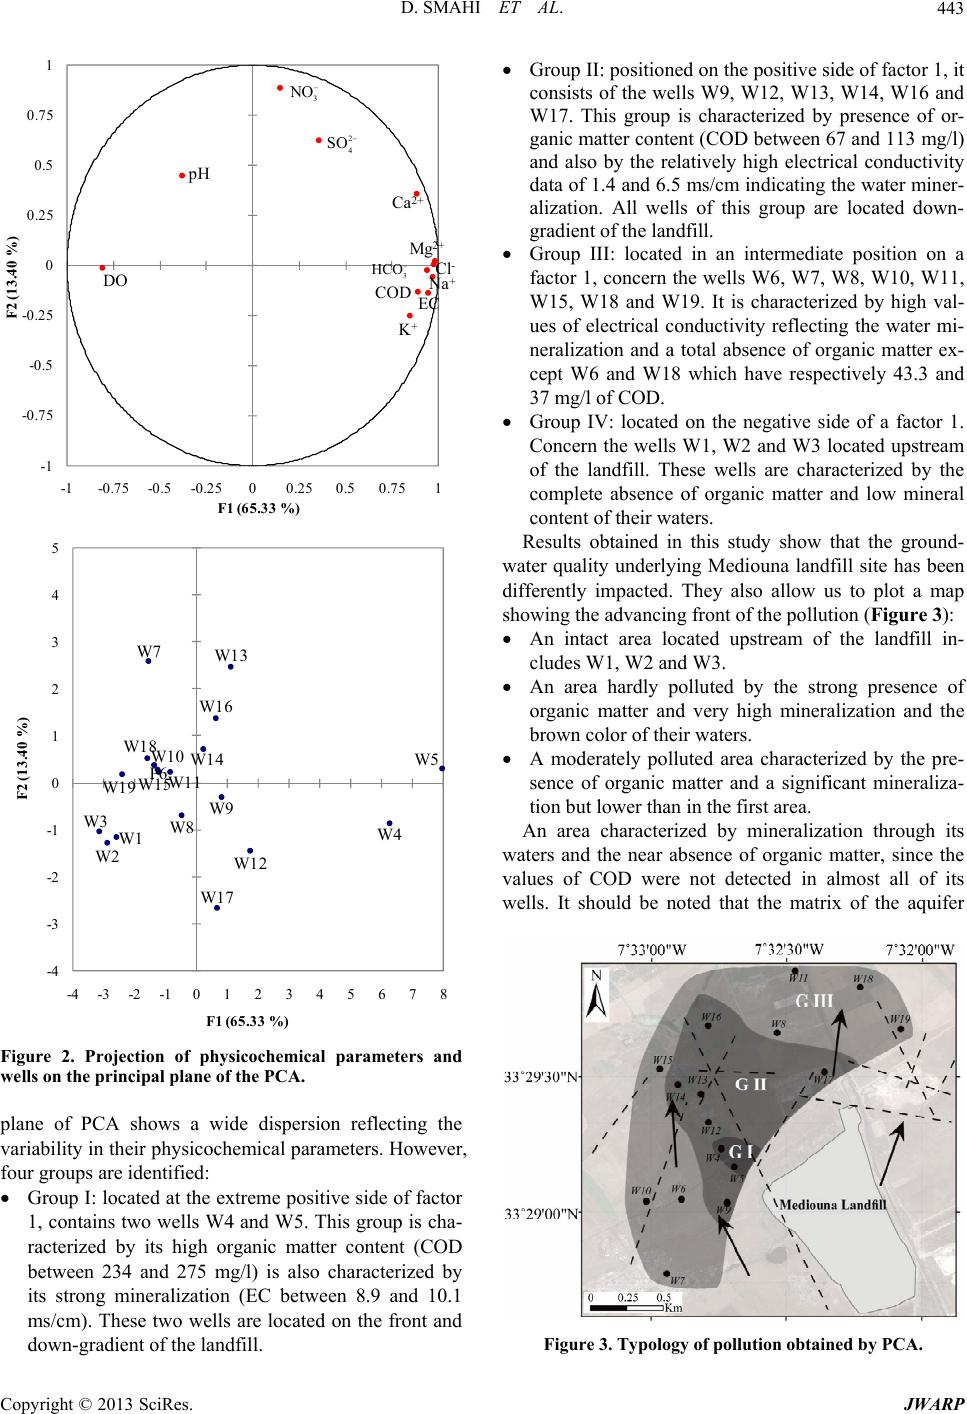 D. SMAHI ET AL. 443 pH DO SO4 EC COD 2- Na Ca2+ Mg K+ -1 -0.75 -0.5 -0.25 0 0.25 0.5 0.75 1 -1-0.75 -0.5-0.2500.250.50.751 F2 ( 13.40 %) F1 (65.33 %) 3 HCO Cl- + 2+ 2 4 SO 3 NO W1 W2 W3 P6 W7 W8 W9 W1 0 W11 W12 W1 3 W1 4 W15 W16 W17 W1 8 W19 -4 -3 -2 -1 0 1 2 3 4 5 -4-3-2-10123 F2 ( 13.40 %) F1 (65.33 %) W4 W5 45678 Figure 2. Projection of physicochemical parameters and wells on the principal plane of the P CA. plane of PCA shows a wide dispersion reflecting the variability in their physicochemical parameters. However, four groups are identified: Group I: located at the extreme positive side of factor 1, contains two wells W4 and W5. This group is cha- racterized by its high organic matter content (COD between 234 and 275 mg/l) is also characterized by its strong mineralization (EC between 8.9 and 10.1 ms/cm). These two wells are located on the front and down-gradient of the landfill. Group II: positioned on the positive side of factor 1, it consists of the wells W9, W12, W13, W14, W16 and W17. This group is characterized by presence of or- ganic matter content (COD between 67 and 113 mg/l) and also by the relatively high electrical conductivity data of 1.4 and 6.5 ms/cm indicating the water miner- alization. All wells of this group are located down- gradient of the landfill. Group III: located in an intermediate position on a factor 1, concern the wells W6, W7, W8, W10, W11, W15, W18 and W19. It is characterized by high val- ues of electrical conductivity reflecting the water mi- neralization and a total absence of organic matter ex- cept W6 and W18 which have respectively 43.3 and 37 mg/l of COD. Group IV: located on the negative side of a factor 1. Concern the wells W1, W2 and W3 located upstream of the landfill. These wells are characterized by the complete absence of organic matter and low mineral content of their waters. Results obtained in this study show that the ground- water quality underlying Mediouna landfill site has been differently impacted. They also allow us to plot a map showing the advancing front of the pollution (Figure 3): An intact area located upstream of the landfill in- cludes W1, W2 and W3. An area hardly polluted by the strong presence of organic matter and very high mineralization and the brown color of their waters. A moderately polluted area characterized by the pre- sence of organic matter and a significant mineraliza- tion but lower than in the first area. An area characterized by mineralization through its waters and the near absence of organic matter, since the values of COD were not detected in almost all of its wells. It should be noted that the matrix of the aquifer Figure 3. Typology of pollution obtained by PCA. Copyright © 2013 SciRes. JWARP 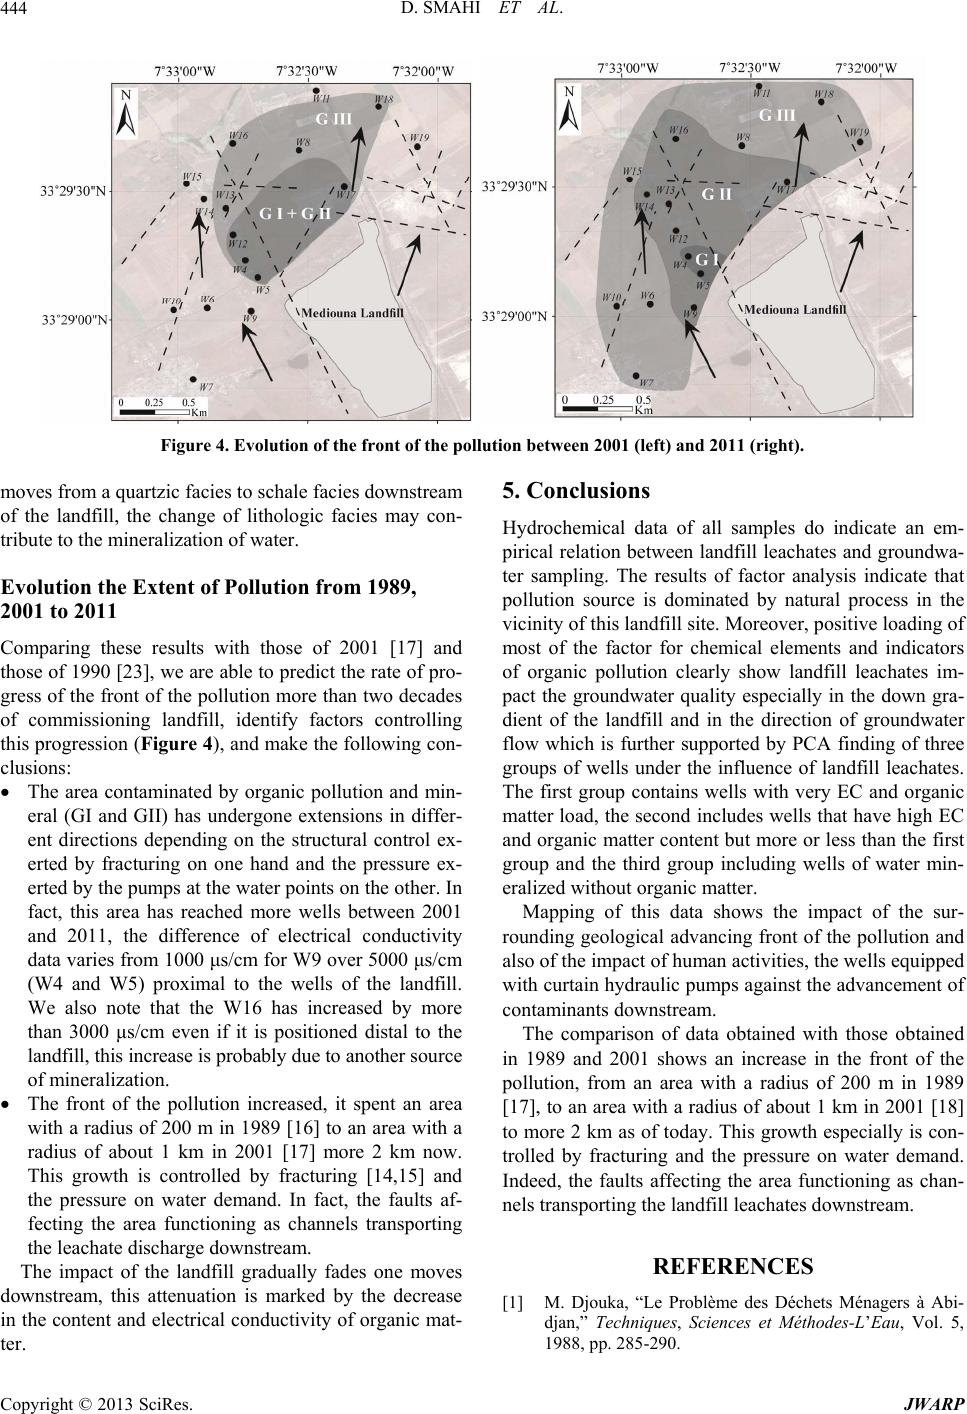 D. SMAHI ET AL. 444 Figure 4. Evolution of the front of the pollution between 2001 (left) and 2011 (right). moves from a quartzic facies to schale facies downstream of the landfill, the change of lithologic facies may con- tribute to the mineralization of water. Evolution the Extent of Pollution from 1989, 2001 to 2011 Comparing these results with those of 2001 [17] and those of 1990 [23], we are able to predict the rate of pro- gress of the front of the pollution more than two decades of commissioning landfill, identify factors controlling this progression (Figure 4), and make the following con- clusions: The area contaminated by organic pollution and min- eral (GI and GII) has undergone extensions in differ- ent directions depending on the structural control ex- erted by fracturing on one hand and the pressure ex- erted by the pumps at the water points on the other. In fact, this area has reached more wells between 2001 and 2011, the difference of electrical conductivity data varies from 1000 μs/cm for W9 over 5000 μs/cm (W4 and W5) proximal to the wells of the landfill. We also note that the W16 has increased by more than 3000 μs/cm even if it is positioned distal to the landfill, this increase is probably due to another source of mineralization. The front of the pollution increased, it spent an area with a radius of 200 m in 1989 [16] to an area with a radius of about 1 km in 2001 [17] more 2 km now. This growth is controlled by fracturing [14,15] and the pressure on water demand. In fact, the faults af- fecting the area functioning as channels transporting the leachate discharge downstream. The impact of the landfill gradually fades one moves downstream, this attenuation is marked by the decrease in the content and electrical conductivity of organic mat- ter. 5. Conclusions Hydrochemical data of all samples do indicate an em- pirical relation between landfill leachates and groundwa- ter sampling. The results of factor analysis indicate that pollution source is dominated by natural process in the vicinity of this landfill site. Moreover, positive loading of most of the factor for chemical elements and indicators of organic pollution clearly show landfill leachates im- pact the groundwater quality especially in the down gra- dient of the landfill and in the direction of groundwater flow which is further supported by PCA finding of three groups of wells under the influence of landfill leachates. The first group contains wells with very EC and organic matter load, the second includes wells that have high EC and organic matter content but more or less than the first group and the third group including wells of water min- eralized without organic matter. Mapping of this data shows the impact of the sur- rounding geological advancing front of the pollution and also of the impact of human activities, the wells equipped with curtain hydraulic pumps against the advancement of contaminants downstream. The comparison of data obtained with those obtained in 1989 and 2001 shows an increase in the front of the pollution, from an area with a radius of 200 m in 1989 [17], to an area with a radius of about 1 km in 2001 [18] to more 2 km as of today. This growth especially is con- trolled by fracturing and the pressure on water demand. Indeed, the faults affecting the area functioning as chan- nels transporting the landfill leachates downstream. REFERENCES [1] M. Djouka, “Le Problème des Déchets Ménagers à Abi- djan,” Techniques, Sciences et Méthodes-L’Eau, Vol. 5, 1988, pp. 285-290. Copyright © 2013 SciRes. JWARP 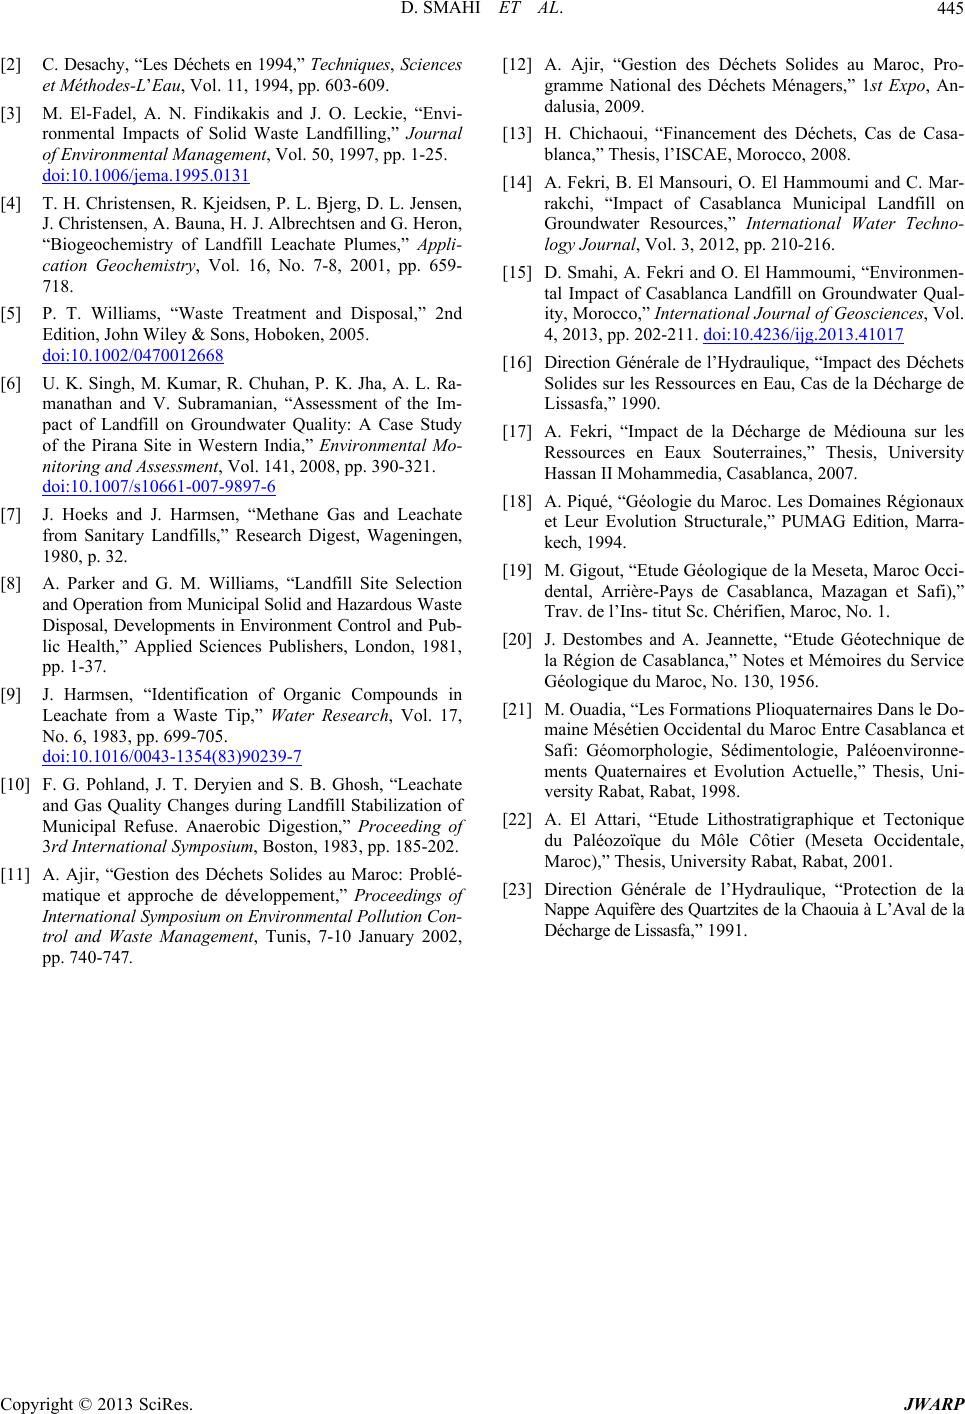 D. SMAHI ET AL. 445 [2] C. Desachy, “Les Déchets en 1994,” Techniques, Sciences et Méthodes-L’Eau, Vol. 11, 1994, pp. 603-609. [3] M. El-Fadel, A. N. Findikakis and J. O. Leckie, “Envi- ronmental Impacts of Solid Waste Landfilling,” Journal of Environmental Management, Vol. 50, 1997, pp. 1-25. doi:10.1006/jema.1995.0131 [4] T. H. Christensen, R. Kjeidsen, P. L. Bjerg, D. L. Jensen, J. Christensen, A. Bauna, H. J. Albrechtsen and G. Heron, “Biogeochemistry of Landfill Leachate Plumes,” Appli- cation Geochemistry, Vol. 16, No. 7-8, 2001, pp. 659- 718. [5] P. T. Williams, “Waste Treatment and Disposal,” 2nd Edition, John Wiley & Sons, Hoboken, 2005. doi:10.1002/0470012668 [6] U. K. Singh, M. Kumar, R. Chuhan, P. K. Jha, A. L. Ra- manathan and V. Subramanian, “Assessment of the Im- pact of Landfill on Groundwater Quality: A Case Study of the Pirana Site in Western India,” Environmental Mo- nitoring and Assessment, Vol. 141, 2008, pp. 390-321. doi:10.1007/s10661-007-9897-6 [7] J. Hoeks and J. Harmsen, “Methane Gas and Leachate from Sanitary Landfills,” Research Digest, Wageningen, 1980, p. 32. [8] A. Parker and G. M. Williams, “Landfill Site Selection and Operation from Municipal Solid and Hazardous Waste Disposal, Developments in Environment Control and Pub- lic Health,” Applied Sciences Publishers, London, 1981, pp. 1-37. [9] J. Harmsen, “Identification of Organic Compounds in Leachate from a Waste Tip,” Water Research, Vol. 17, No. 6, 1983, pp. 699-705. doi:10.1016/0043-1354(83)90239-7 [10] F. G. Pohland, J. T. Deryien and S. B. Ghosh, “Leachate and Gas Quality Changes during Landfill Stabilization of Municipal Refuse. Anaerobic Digestion,” Proceeding of 3rd International Symposium, Boston, 1983, pp. 185-202. [11] A. Ajir, “Gestion des Déchets Solides au Maroc: Problé- matique et approche de développement,” Proceedings of International Symposium on Environmental Pollution Con- trol and Waste Management, Tunis, 7-10 January 2002, pp. 740-747. [12] A. Ajir, “Gestion des Déchets Solides au Maroc, Pro- gramme National des Déchets Ménagers,” 1st Expo, An- dalusia, 2009. [13] H. Chichaoui, “Financement des Déchets, Cas de Casa- blanca,” Thesis, l’ISCAE, Morocco, 2008. [14] A. Fekri, B. El Mansouri, O. El Hammoumi and C. Mar- rakchi, “Impact of Casablanca Municipal Landfill on Groundwater Resources,” International Water Techno- logy Journal, Vol. 3, 2012, pp. 210-216. [15] D. Smahi, A. Fekri and O. El Hammoumi, “Environmen- tal Impact of Casablanca Landfill on Groundwater Qual- ity, Morocco,” International Journal of Geosciences, Vol. 4, 2013, pp. 202-211. doi:10.4236/ijg.2013.41017 [16] Direction Générale de l’Hydraulique, “Impact des Déchets Solides sur les Ressources en Eau, Cas de la Décharge de Lissasfa,” 1990. [17] A. Fekri, “Impact de la Décharge de Médiouna sur les Ressources en Eaux Souterraines,” Thesis, University Hassan II Mohammedia, Casablanca, 2007. [18] A. Piqué, “Géologie du Maroc. Les Domaines Régionaux et Leur Evolution Structurale,” PUMAG Edition, Marra- kech, 1994. [19] M. Gigout, “Etude Géologique de la Meseta, Maroc Occi- dental, Arrière-Pays de Casablanca, Mazagan et Safi),” Trav. de l’Ins- titut Sc. Chérifien, Maroc, No. 1. [20] J. Destombes and A. Jeannette, “Etude Géotechnique de la Région de Casablanca,” Notes et Mémoires du Service Géologique du Maroc, No. 130, 1956. [21] M. Ouadia, “Les Formations Plioquaternaires Dans le Do- maine Mésétien Occidental du Maroc Entre Casablanca et Safi: Géomorphologie, Sédimentologie, Paléoenvironne- ments Quaternaires et Evolution Actuelle,” Thesis, Uni- versity Rabat, Rabat, 1998. [22] A. El Attari, “Etude Lithostratigraphique et Tectonique du Paléozoïque du Môle Côtier (Meseta Occidentale, Maroc),” Thesis, University Rabat, Rabat, 2001. [23] Direction Générale de l’Hydraulique, “Protection de la Nappe Aquifère des Quartzites de la Chaouia à L’Aval de la Décharge de Lissasfa,” 1991. Copyright © 2013 SciRes. JWARP |