

Paper Menu >>
Journal Menu >>
 Journal of Water Resource and Protection, 2013, 5, 405-413 http://dx.doi.org/10.4236/jwarp.2013.54040 Published Online April 2013 (http://www.scirp.org/journal/jwarp) Response of the Plankton to a Fresh Water Pulse in a Fresh Water Deprived, Permanently Open South African Estuary Pierre William Froneman1*, Paul Denzi Vorwerk2 1Coastal Research Group, Department of Zoology and Entomology, Rhodes University, Grahamstown, South Africa 2South African Environmental Observation Network (SAEON) Elwandle Node, Grahamstown, South Africa Email: *[email protected] Received January 17, 2013; revised February 28, 2013; accepted March 10, 2013 Copyright © 2013 Pierre William Froneman, Paul Denzi Vorwerk. This is an open access article distributed under the Creative Commons Attribution License, which permits unrestricted use, distribution, and reproduction in any medium, provided the original work is properly cited. ABSTRACT This study assessed the influence of a freshwater pulse on selected physico-chemical and biological variables in a per- manently open freshwater deprived southern African estuary. In the absence of the freshwater pulse a reverse gradient in salinity was evident with hypersaline (salinity > 40) conditions prevailing in the upper reaches of the estuary. Total chlorophyll-a (chl-a) concentration during this period ranged from 0.25 to 0.60 µg·l−1. The mean total zooplankton abundance and biomass in the absence of freshwater during the daytime was 666 ind·m−3 (SD ± 196) and 12.4 mg·dwt·m−3 (SD ± 3.3), respectively. During the night time the mean total zooplankton abundance was 3121 ind·m−3 (SD ± 1203) and the biomass 21.8 mg·dwt·m−3 (SD ± 196). The total zooplankton abundance during the dry season was numerically dominated by the copepod nauplii and the calanoid copepod, Pseudodiaptomus hessei, which contributed up to 76% of the total zooplankton counts. The freshwater pulse was associated with the establishment of a horizontal gradient in salinity along the length of the estuary and a significant increase in the total chl-a concentration (range from 0.74 to 11.75 µg·l−1) and zooplankton biomass (range from 23.7 to 76.6 mg·dwt·m−3) (p < 0.05 in both cases). Addition- ally, there was a marked increase in the total zooplankton abundances and biomass within the estuary. A distinct shift in the zooplankton community composition was evident with the copepod, Acartia longipatella numerically dominating the zooplankton counts. Keywords: Estuary Zooplankton Community; Freshwater Inflow 1. Introduction Increased population growth coupled with industrializa- tion has coincided with a decrease in the magnitude of freshwater flowing into southern African estuaries. The influence of the reduced freshwater inflow on the biology of southern African estuaries is now well documented [1, 2]. Reduced freshwater inflow into estuaries has been linked to a decrease in the phytoplankton size composi- tion and daily production rates largely because freshwa- ter inflow represents the primary source of nutrients nec- essary to sustain the growth of the phytoplankton, par- ticularly diatoms [1,3,4]. Among the heterotrophic com- ponents of the estuarine food web, the alteration in the riverine inflow into estuaries has been linked to changes in the recruitment, biomass and species composition and distribution of both inverstebrates and vertebrates within these systems [2,5,6]. The formation of horizontal salin- ity gradients in estuaries is also associated with spatial patterns in the plankton biomass (so-called river-estuary interface (REI) zone [7] Finally, freshwater inflow into estuaries has been linked an increased diversity of niches and food sources available to animals in these systems [8-10]. The Kariega Estuary on the south-east coast of South Africa is regarded as a fresh water deprived system and has been reported as having hypersaline conditions in the upper reaches in various studies since 1991 [11-13]. The hypersaline conditions in the upper reaches of the estuary can be attributed to reduced freshwater inflow as a result of small catchment area (≈680 km2), the presence of sev- eral impoundments along the Kariega River and high evaporative losses, particularly during the summer months [12,13]. Localised flooding occurred during September 2006 along the south-east coast of South Africa, resulting in a horizontal salinity gradient being recorded within the system for the first time since 1991. The biological res- *Corresponding author. C opyright © 2013 SciRes. JWARP 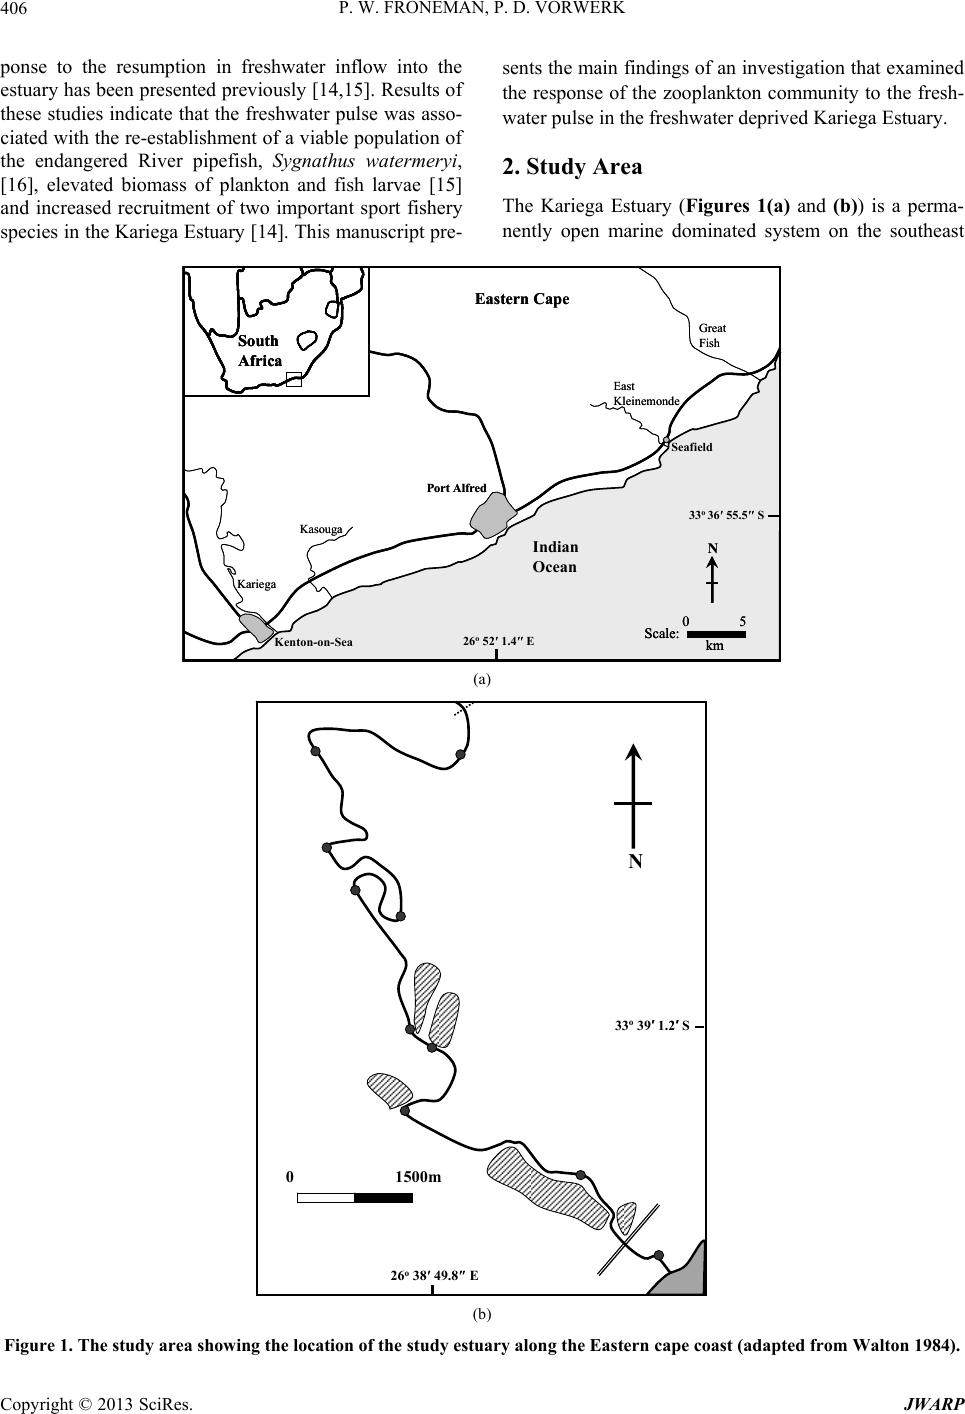 P. W. FRONEMAN, P. D. VORWERK 406 ponse to the resumption in freshwater inflow into the estuary has been presented previously [14,15]. Results of these studies indicate that the freshwater pulse was asso- ciated with the re-establishment of a viable population of the endangered River pipefish, Sygnathus watermeryi, [16], elevated biomass of plankton and fish larvae [15] and increased recruitment of two important sport fishery species in the Kariega Estuary [14]. This manuscript pre- sents the main findings of an investigation that examined the response of the zooplankton community to the fresh- water pulse in the freshwater deprived Kariega Estuary. 2. Study Area The Kariega Estuary (Figures 1(a) and (b)) is a perma- nently open marine dominated system on the southeast Port Alfred Seafield Eastern Cape Kenton-on-Sea Indian Ocean South Africa East Kleinemonde Great Fish 0 5 Kasouga Kariega km Scale: N 33 o 36′55.5″S 26 o 52′1.4″E Port Alfred Seafield Eastern Cape Kenton-on-Sea Indian Ocean South Africa South Africa East Kleinemonde Great Fish 0 5 Kasouga Kariega NN km 0 5 Scale:Scale:Scale: kmkm 33 o 36′55.5″S 26 o 52′1.4″E (a) 33o39′1.2′S 26o38′49.8″E N 0 1500m 33o39′1.2′S 26o38′49.8″E N 0 1500m 33o39′1.2′S 26o38′49.8″E N 0 1500m (b) Figure 1. The study area showing the location of the study estuary along the Eastern cape coast (adapted from Walton 1984). Copyright © 2013 SciRes. JWARP  P. W. FRONEMAN, P. D. VORWERK 407 coast of South Africa (33˚40'46.6"S; 26˚40'57.9"E) [14] The estuary is approximately 18 km long, has a depth range of 2.5 m to 3.5 m and varies in width between 40 m and 100 m [7,13] The estuary is predominantly marine with hypersaline conditions being recorded in the upper reaches since 1991 [3,11,13]. The dominance of the ma- rine environment within the system is indicated by the 106:1 ratio of tidal prism volume to river flow volume [17]. The middle reaches of the estuary are characterised by extensive salt marshes comprising the high marsh plants Sarcocornia perennis, Chenolea diffusa and Spar- tina maritima. The marine dominance of the system has also contributed to the eelgrass, Zostera capensis, ex- tending its distribution along the length of the estuary [7,13]. 3. Materials and Methods Sampling of the zooplankton and related physico-che- mical variables was conducted during November 2005 and November 2006. The November 2005 sampling re- presents the flow rates at present (low flow rates, design- nated dry season) within the system, while the November 2006 sampling represents a wet season for the Kariega Estuary. Sampling was conducted at 10 stations along the length of the Kariega Estuary during daylight and night time during low tide. 3.1. Physico-Chemical Variables Temperature and salinity (practical salinity units) at each station were measured using a Horiba U10 water sampler at both the surface and bottom of the water column with- in the estuary. 3.2. Chlorophyll-a (chl-a) Chlorophyll-a concentrations were determined for sur- face and bottom waters for each station by collecting 200 ml water sample using an 8 L Niskin bottle. These sam- ples were vacuum filtered (<5 cm Hg) through GF/F fil- ters which were subsequently extracted in 90% acetone for 24 hr in the dark at −20˚C. The total chlorophyll-a concentrations were then determined using a 10AU-Tur- ner flourometer before and after acidification according to the method of Holm-Hansen and Riemann [18]. 3.3. Zooplankton Zooplankton at each station was collected during three replicate surface tows (depth ≈ 0.5 m) conducted during the day and night using a WP-2 Net (50 cm diameter, 100 μm mesh) fitted with a General Oceanics flow meter to allow for volumetric standardisation of the samples. All samples collected were stored in 10% buffered for- malin for later identification in the laboratory. For each replicate sample the zooplankton dry biomass was de- termined by filtering a 1/2 to 1/32 sub-sample, obtained using a Folsom plankton splitter, through a pre-weighed GF/F filter and then oven drying at 60˚C for a period of 24 hr. The dry biomass was calculated as the difference between the filter weight and the combined dry weight. All zooplankton were counted to allow for density esti- mates which were then averaged across the three repli- cate samples. Abundance and biomass values were ex- pressed as ind·m−3 and mg·dwt·m−3, respectively. 3.4. Numerical Analyses The average community abundance data for each station was entered into the PRIMER (Plymouth Routines in Multivariate Ecological Research version 5.2.4 software package for comparison between the stations [19]. The data was transformed (log(x + 1)) to minimise the effect of less abundant species and input into a group-averaged Bray-Curtis Similarity analysis from which a cluster dia- gram was generated. The SIMPER routine was then em- ployed to identify which species were contributing to the differences between the groupings identified with the nu- merical analysis [19]. 3.5. Statistical Analyses To test for differences between wet and dry seasons for chlorophyll concentrations, zooplankton biomass and zooplankton densities, a Lilliefors test for normality was used prior to inputting the data into an ANOVA. These statistical tests were run in the STATISTICA for Win- dows package [20]. 4. Results 4.1. Flow Data The monthly flow volumes in the four months preceding the dry season sampling (from June to September) in 2005, never exceeded 0.026 × 10⁶ m 3 with a maximum occurring in June 2005 (Figure 2). The monthly flow volumes increased from 0.012 × 10⁶ m3 in June 2006 to 4.45 × 10⁶ m3 and 2.9 × 10⁶ m3 in August and September, respectively (Figure 2) (Department of Water Affairs and Forestry Flow Data). 4.2. Physico-Chemical Variables The temperature profiles recorded during both the wet and dry seasons were similar, with a temperature gradient evident from the mouth to the head of the system (Figure 3). Temperatures during the dry season (November 2005) ranged from 19.3˚C near the mouth to 23.4˚C at the head of the estuary, while during the wet season (November 2006) the lower reach temperatures were 17.4˚C with a maximum of 24˚C at the head. The recorded salinity Copyright © 2013 SciRes. JWARP  P. W. FRONEMAN, P. D. VORWERK 408 Month JuneJulyAugust September Monthly Flow Volume (million m3) 0.00 0.01 0.02 0.03 2.50 3.00 3.50 4.00 4.50 2005 2006 Figure 2. The monthly flow volume (million m3) in the months preceding the sampling during 2005 and 2006 (drawn from Department of Water Affairs and Forestry Flow Data). 20 20 21 21 22 22 22 22 23 23 Depth (m) 0.0 0.5 1.0 1.5 18 18 19 19 20 20 21 21 23 23 23 22 22 Distance from Mouth (km) 2 4 6 810121416 Depth (m) 0.0 0.5 1.0 1.5 A B (b) (a) Figure 3. Contour plots of the temperature (˚C) in the Kariega Estuary during the dry season, November 2005 (a); and the wet season, November 2006 (b). demonstrated a reverse salinity gradient during the dry season, with a minimum salinity of 35 near the mouth of the estuary and a maximum of 36.5 near the head of the system (Figure 4). Conversely, during the wet season, a normal salinity gradient was evident, with salinities of 34 recorded at the mouth and 4.7 at the head of the estuary (Figure 4). A salt wedge was also evident in the upper reaches of the system during the wet season, with salini- ties on the bottom less than 12. 4.3. Chlorophyll-a The total chlorophyll-a concentration during the dry sea- son was relatively uniform along the length of the estuary, and ranged from 0.25 μg·L−1 to 0.61 μg·L−1 (Figure 5). No apparent horizontal or vertical patterns were evident in the total chlorophyll-a concentration during the dry season. During the wet season, the total chlorophyll-a concentration was significantly higher (p < 0.001; F = 34.08), ranging from 0.74 μg·L−1 to a maximum of 11.75 μg·L−1. During the wet season the maximum chlorophyll- a concentration occurred in the mixing zone between oli- gohaline and polyhaline conditions approximately 14 km from the mouth (Figures 4 and 5). 4.4. Zooplankton Daytime dry season densities of zooplankton ranged from 432 ind·m−3 to 936 ind·m−3, while during the wet season total zooplankton densities varied between 76 Copyright © 2013 SciRes. JWARP 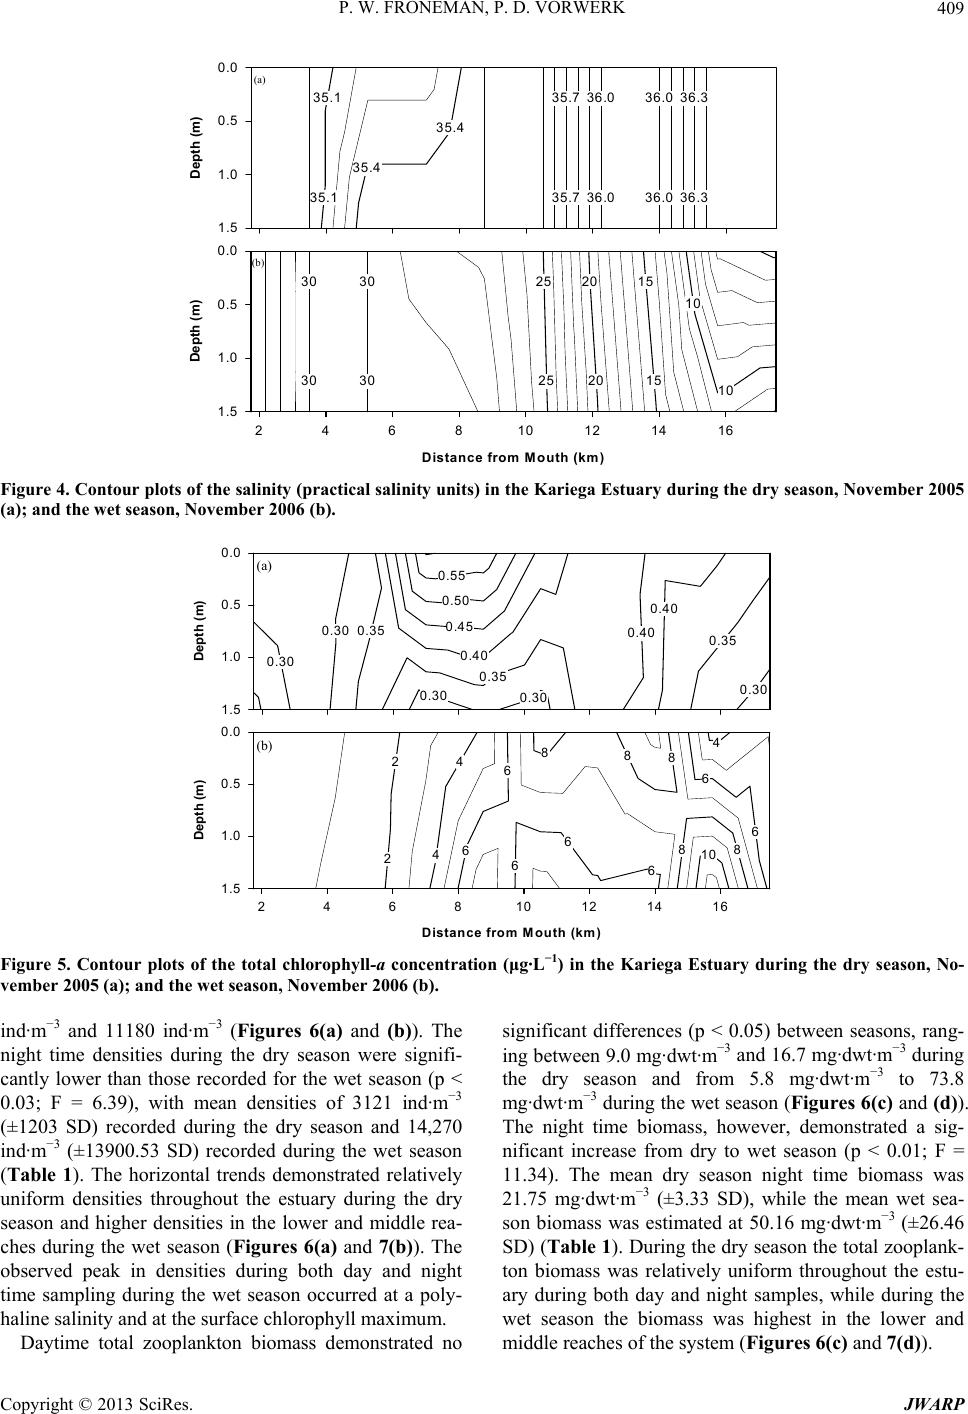 P. W. FRONEMAN, P. D. VORWERK 409 35.4 35.4 35.1 35.1 36.0 36.0 35.7 35.7 36.0 36.0 36.3 36.3 Depth (m) 0.0 0.5 1.0 1.5 30 30 30 30 25 25 20 20 15 15 10 10 Distance from Mouth (km) 246810 12 14 16 Depth (m) 0.0 0.5 1.0 1.5 A B (a) (b) Figure 4. Contour plots of the salinity (practical salinity units) in the Kariega Estuary during the dry season, November 2005 (a); and the wet season, November 2006 (b). 0.30 0.35 0.30 0.35 0.30 0.55 0.50 0.45 0.40 0.30 0.40 0.40 0.35 0.30 Depth (m) 0.0 0.5 1.0 1.5 2 2 6 6 4 46 6 6 84 8 8 6 6 10 88 Distance from Mouth (km) 246810121416 Depth (m) 0.0 0.5 1.0 1.5 A B (a) (b) Figure 5. Contour plots of the total chlorophyll-a concentration (μg·L−1) in the Kariega Estuary during the dry season, No- vember 2005 (a); and the wet season, November 2006 (b). ind·m−3 and 11180 ind·m−3 (Figures 6(a) and (b)). The night time densities during the dry season were signifi- cantly lower than those recorded for the wet season (p < 0.03; F = 6.39), with mean densities of 3121 ind·m−3 (±1203 SD) recorded during the dry season and 14,270 ind·m−3 (±13900.53 SD) recorded during the wet season (Table 1). The horizontal trends demonstrated relatively uniform densities throughout the estuary during the dry season and higher densities in the lower and middle rea- ches during the wet season (Figures 6(a) and 7(b)). The observed peak in densities during both day and night time sampling during the wet season occurred at a poly- haline salinity and at the surface chlorophyll maximum. Daytime total zooplankton biomass demonstrated no significant differences (p < 0.05) between seasons, rang- ing between 9.0 mg·dwt·m−3 and 16.7 mg·dwt·m−3 during the dry season and from 5.8 mg·dwt·m−3 to 73.8 mg·dwt·m−3 during the wet season (Figures 6(c) and (d)). The night time biomass, however, demonstrated a sig- nificant increase from dry to wet season (p < 0.01; F = 11.34). The mean dry season night time biomass was 21.75 mg·dwt·m−3 (±3.33 SD), while the mean wet sea- son biomass was estimated at 50.16 mg·dwt·m−3 (±26.46 SD) (Table 1). During the dry season the total zooplank- ton biomass was relatively uniform throughout the estu- ary during both day and night samples, while during the wet season the biomass was highest in the lower and middle reaches of the system (Figures 6(c) and 7(d)). Copyright © 2013 SciRes. JWARP 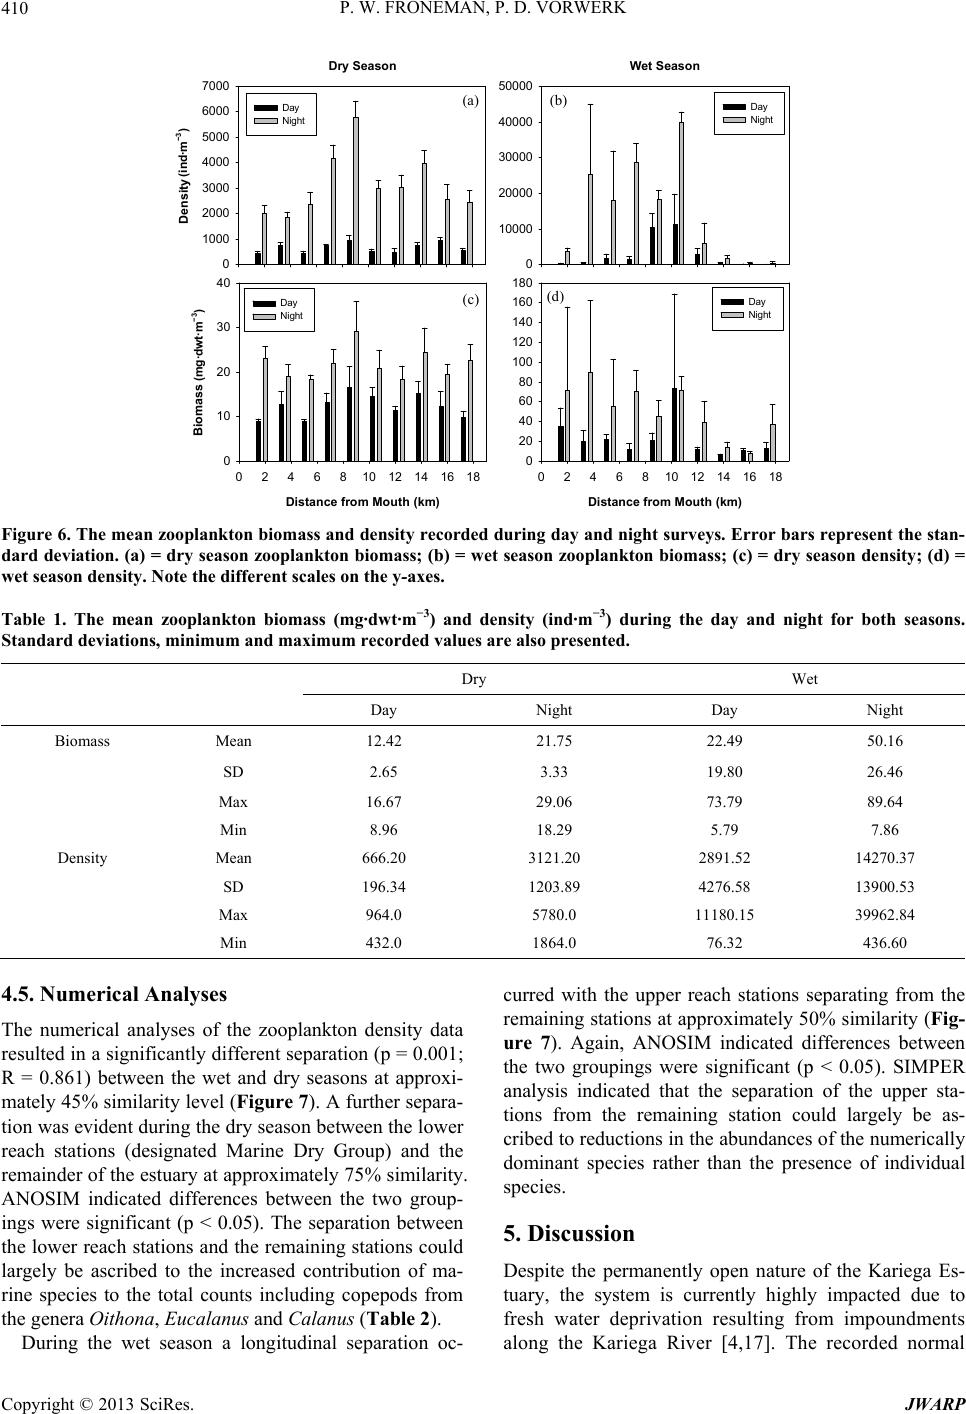 P. W. FRONEMAN, P. D. VORWERK 410 Dry Season Distance from Mouth (km) 024681012141618 Biomass (mg dwt m-3) 0 10 20 30 40 Day Night Wet Seaso Distance from M n outh (km) 0246810 Density (ind.m-3) 0 1000 2000 3000 4000 5000 6000 7000 Day Night 0 10000 20000 30000 40000 50000 Day Night 12141618 0 20 40 60 80 100 120 140 160 180 Day Night A CD B (a) (b) (c) (d) (ind·m −3 ) (mg·dwt·m −3 ) Figure 6. The mean zooplankton biomass and density recorded during day and night surveys. Error bars represent the stan- dard deviation. (a) = dry season zooplankton biomass; (b) = wet season zooplankton biomass; (c) = dry season density; (d) = wet season density. Note the different scales on the y-axes. Table 1. The mean zooplankton biomass (mg·dwt·m−3) and density (ind·m−3) during the day and night for both seasons. Standard deviations, minimum and maximum recorded values are also presented. Dry Wet Day Night Day Night Biomass Mean 12.42 21.75 22.49 50.16 SD 2.65 3.33 19.80 26.46 Max 16.67 29.06 73.79 89.64 Min 8.96 18.29 5.79 7.86 Density Mean 666.20 3121.20 2891.52 14270.37 SD 196.34 1203.89 4276.58 13900.53 Max 964.0 5780.0 11180.15 39962.84 Min 432.0 1864.0 76.32 436.60 4.5. Numerical Analyses The numerical analyses of the zooplankton density data resulted in a significantly different separation (p = 0.001; R = 0.861) between the wet and dry seasons at approxi- mately 45% similarity level (Figure 7). A further separa- tion was evident during the dry season between the lower reach stations (designated Marine Dry Group) and the remainder of the estuary at approximately 75% similarity. ANOSIM indicated differences between the two group- ings were significant (p < 0.05). The separation between the lower reach stations and the remaining stations could largely be ascribed to the increased contribution of ma- rine species to the total counts including copepods from the genera Oithona, Eucalanus and Calanus (Table 2). During the wet season a longitudinal separation oc- curred with the upper reach stations separating from the remaining stations at approximately 50% similarity (Fig- ure 7). Again, ANOSIM indicated differences between the two groupings were significant (p < 0.05). SIMPER analysis indicated that the separation of the upper sta- tions from the remaining station could largely be as- cribed to reductions in the abundances of the numerically dominant species rather than the presence of individual species. 5. Discussion Despite the permanently open nature of the Kariega Es- tuary, the system is currently highly impacted due to fresh water deprivation resulting from impoundments along the Kariega River [4,17]. The recorded normal Copyright © 2013 SciRes. JWARP 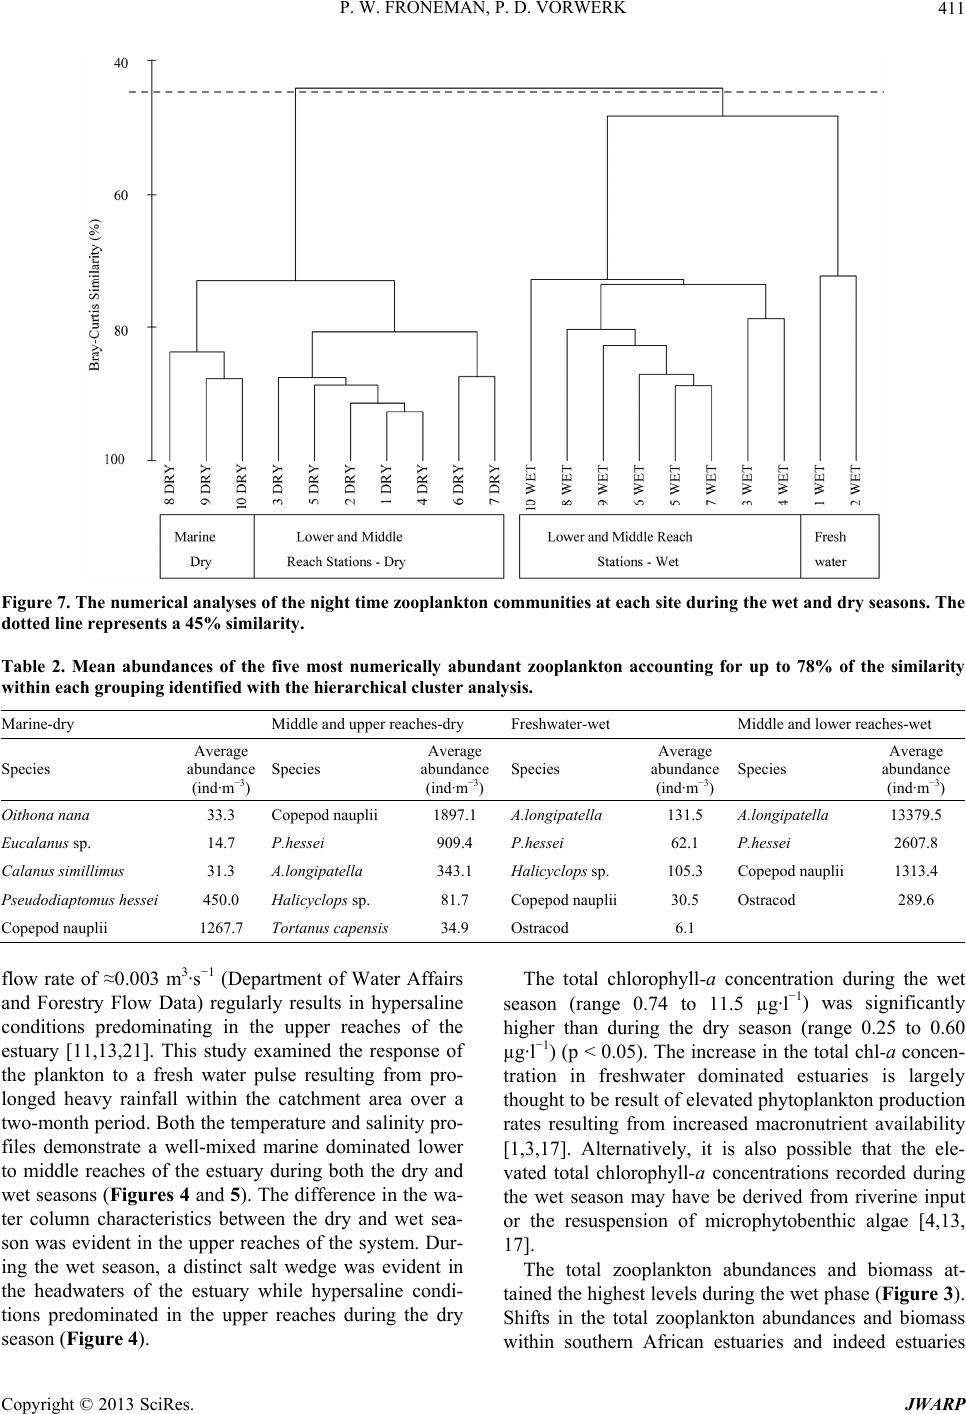 P. W. FRONEMAN, P. D. VORWERK 411 Figure 7. The numerical analyses of the night time zooplankton communities at each site during the wet and dry seasons. The dotted line represents a 45% similarity. Table 2. Mean abundances of the five most numerically abundant zooplankton accounting for up to 78% of the similarity within each grouping identified with the hierarchical cluster analysis. Marine-dry Middle and upper reaches-dry Freshwater-wet Middle and lower reaches-wet Species Average abundance (ind·m−3) Species Average abundance (ind·m−3) Species Average abundance (ind·m−3) Species Average abundance (ind·m−3) Oithona nana 33.3 Copepod nauplii 1897.1 A.longipatella 131.5 A.longipatella 13379.5 Eucalanus sp. 14.7 P.hessei 909.4 P.hessei 62.1 P.hessei 2607.8 Calanus simillimus 31.3 A.longipatella 343.1 Halicyclops sp. 105.3 Copepod nauplii 1313.4 Pseudodiapto mus h essei 450.0 Halicyclops sp. 81.7 Copepod nauplii30.5 Ostracod 289.6 Copepod nauplii 1267.7 Tortanus capensis34.9 Ostracod 6.1 flow rate of ≈0.003 m3·s−1 (Department of Water Affairs and Forestry Flow Data) regularly results in hypersaline conditions predominating in the upper reaches of the estuary [11,13,21]. This study examined the response of the plankton to a fresh water pulse resulting from pro- longed heavy rainfall within the catchment area over a two-month period. Both the temperature and salinity pro- files demonstrate a well-mixed marine dominated lower to middle reaches of the estuary during both the dry and wet seasons (Figures 4 and 5). The difference in the wa- ter column characteristics between the dry and wet sea- son was evident in the upper reaches of the system. Dur- ing the wet season, a distinct salt wedge was evident in the headwaters of the estuary while hypersaline condi- tions predominated in the upper reaches during the dry season (Figure 4). The total chlorophyll-a concentration during the wet season (range 0.74 to 11.5 µg·l−1) was significantly higher than during the dry season (range 0.25 to 0.60 µg·l−1) (p < 0.05). The increase in the total chl-a concen- tration in freshwater dominated estuaries is largely thought to be result of elevated phytoplankton production rates resulting from increased macronutrient availability [1,3,17]. Alternatively, it is also possible that the ele- vated total chlorophyll-a concentrations recorded during the wet season may have be derived from riverine input or the resuspension of microphytobenthic algae [4,13, 17]. The total zooplankton abundances and biomass at- tained the highest levels during the wet phase (Figure 3). Shifts in the total zooplankton abundances and biomass within southern African estuaries and indeed estuaries Copyright © 2013 SciRes. JWARP 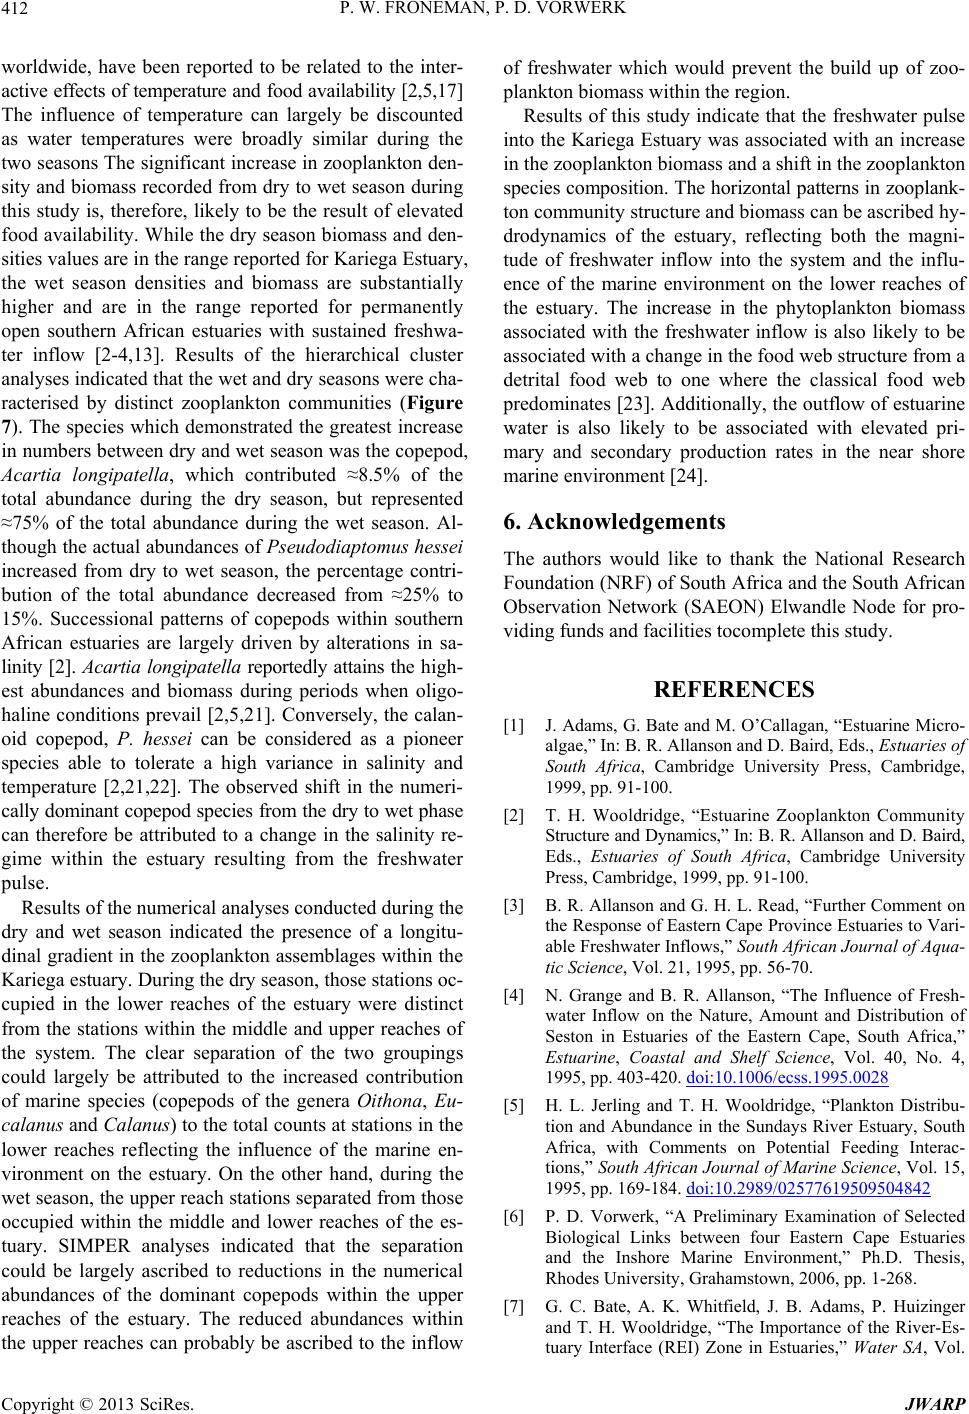 P. W. FRONEMAN, P. D. VORWERK 412 worldwide, have been reported to be related to the inter- active effects of temperature and food availability [2,5,17] The influence of temperature can largely be discounted as water temperatures were broadly similar during the two seasons The significant increase in zooplankton den- sity and biomass recorded from dry to wet season during this study is, therefore, likely to be the result of elevated food availability. While the dry season biomass and den- sities values are in the range reported for Kariega Estuary, the wet season densities and biomass are substantially higher and are in the range reported for permanently open southern African estuaries with sustained freshwa- ter inflow [2-4,13]. Results of the hierarchical cluster analyses indicated that the wet and dry seasons were cha- racterised by distinct zooplankton communities (Figure 7). The species which demonstrated the greatest increase in numbers between dry and wet season was the copepod, Acartia longipatella, which contributed ≈8.5% of the total abundance during the dry season, but represented ≈75% of the total abundance during the wet season. Al- though the actual abundances of Pseudodiaptomus hessei increased from dry to wet season, the percentage contri- bution of the total abundance decreased from ≈25% to 15%. Successional patterns of copepods within southern African estuaries are largely driven by alterations in sa- linity [2]. Acartia longipatella reportedly attains the high- est abundances and biomass during periods when oligo- haline conditions prevail [2,5,21]. Conversely, the calan- oid copepod, P. hessei can be considered as a pioneer species able to tolerate a high variance in salinity and temperature [2,21,22]. The observed shift in the numeri- cally dominant copepod species from the dry to wet phase can therefore be attributed to a change in the salinity re- gime within the estuary resulting from the freshwater pulse. Results of the numerical analyses conducted during the dry and wet season indicated the presence of a longitu- dinal gradient in the zooplankton assemblages within the Kariega estuary. During the dry season, those stations oc- cupied in the lower reaches of the estuary were distinct from the stations within the middle and upper reaches of the system. The clear separation of the two groupings could largely be attributed to the increased contribution of marine species (copepods of the genera Oithona, Eu- calanus and Calanus) to the total counts at stations in the lower reaches reflecting the influence of the marine en- vironment on the estuary. On the other hand, during the wet season, the upper reach stations separated from those occupied within the middle and lower reaches of the es- tuary. SIMPER analyses indicated that the separation could be largely ascribed to reductions in the numerical abundances of the dominant copepods within the upper reaches of the estuary. The reduced abundances within the upper reaches can probably be ascribed to the inflow of freshwater which would prevent the build up of zoo- plankton biomass within the region. Results of this study indicate that the freshwater pulse into the Kariega Estuary was associated with an increase in the zooplankton biomass and a shift in the zooplankton species composition. The horizontal patterns in zooplank- ton community structure and biomass can be ascribed hy- drodynamics of the estuary, reflecting both the magni- tude of freshwater inflow into the system and the influ- ence of the marine environment on the lower reaches of the estuary. The increase in the phytoplankton biomass associated with the freshwater inflow is also likely to be associated with a change in the food web structure from a detrital food web to one where the classical food web predominates [23]. Additionally, the outflow of estuarine water is also likely to be associated with elevated pri- mary and secondary production rates in the near shore marine environment [24]. 6. Acknowledgements The authors would like to thank the National Research Foundation (NRF) of South Africa and the South African Observation Network (SAEON) Elwandle Node for pro- viding funds and facilities tocomplete this study. REFERENCES [1] J. Adams, G. Bate and M. O’Callagan, “Estuarine Micro- algae,” In: B. R. Allanson and D. Baird, Eds., Estuaries of South Africa, Cambridge University Press, Cambridge, 1999, pp. 91-100. [2] T. H. Wooldridge, “Estuarine Zooplankton Community Structure and Dynamics,” In: B. R. Allanson and D. Baird, Eds., Estuaries of South Africa, Cambridge University Press, Cambridge, 1999, pp. 91-100. [3] B. R. Allanson and G. H. L. Read, “Further Comment on the Response of Eastern Cape Province Estuaries to Vari- able Freshwater Inflows,” South African Journal of Aqua- tic Science, Vol. 21, 1995, pp. 56-70. [4] N. Grange and B. R. Allanson, “The Influence of Fresh- water Inflow on the Nature, Amount and Distribution of Seston in Estuaries of the Eastern Cape, South Africa,” Estuarine, Coastal and Shelf Science, Vol. 40, No. 4, 1995, pp. 403-420. doi:10.1006/ecss.1995.0028 [5] H. L. Jerling and T. H. Wooldridge, “Plankton Distribu- tion and Abundance in the Sundays River Estuary, South Africa, with Comments on Potential Feeding Interac- tions,” South African Journal of Marine Science, Vol. 15, 1995, pp. 169-184. doi:10.2989/02577619509504842 [6] P. D. Vorwerk, “A Preliminary Examination of Selected Biological Links between four Eastern Cape Estuaries and the Inshore Marine Environment,” Ph.D. Thesis, Rhodes University, Grahamstown, 2006, pp. 1-268. [7] G. C. Bate, A. K. Whitfield, J. B. Adams, P. Huizinger and T. H. Wooldridge, “The Importance of the River-Es- tuary Interface (REI) Zone in Estuaries,” Water SA, Vol. Copyright © 2013 SciRes. JWARP  P. W. FRONEMAN, P. D. VORWERK Copyright © 2013 SciRes. JWARP 413 28, No. 3, 2002, pp. 271-279. [8] A. K. Whitfield and M. N. Bruton, “Some Biological Im- plications of Reduced Fresh Water Inflow into Eastern Cape Estuaries: A Preliminary Assessment,” South Afri- can Journal of Science, Vol. 85, 1989, pp. 691-694. [9] L. D. Ter, E. R. Morshuizen and A. K. Whitfield, “The Distribution of Littoral Fish Associated with Eelgrass Zostera capensis in the Kariega Estuary, a Southern Af- rican System with a Reversed Salinity Gradient,” South African Journal of Marine Science, Vol. 14, 1994, pp. 95- 105. doi:10.2989/025776194784287049 [10] A. K. Whitfield and T. H. Wooldridge, “Changes in Freshwater Supplies to Southern African Estuaries: Some Theoretical and Practical Considerations,” In: K. R. Dyer and R. J. Orth, Eds., Changes in Fluxes in Estuaries: Im- plications from Science to Management, Olsen & Olsen, Fredensborg, 1994, pp. 41-50. [11] L. D. Ter Morshuizen, A. K. Whitfield and A. W. Pater- son, “Influence of Freshwater Flow Regime on Fish As- semblages in the Great Fish River and Estuary,” South African Journal of Aquatic Science, Vol. 22, 1996, pp. 52-61. [12] A. K. Whitfield and A. W. Paterson, “Distribution Pat- terns of Fishes in a Freshwater Deprived Eastern Cape Estuary, with Particular Emphasis on the Geographical Headwater Region,” Water SA, Vol. 29, No. 1, 2003, pp. 61-67. [13] E. E. Heyns and P. W. Froneman,“Spatial and Temporal Patterns in the Hyperbenthic Community Structure in Sou- thern African Permanently Open Estuary,” Estuarine, Coastal and Shelf Science, Vol. 88, 2010, pp. 105-115. [14] P. D. Vorwerk, A. W. Paterson, P. W. Froneman and A. K. Whitfield, “Increased Abundance of Two Important Sport Fishery Species Following Renewed River Flow into a Freshwater Deprived South African Estuary,” Fish- eries Management and Ecology, Vol. 16, No. 5, 2009, pp. 420-423. doi:10.1111/j.1365-2400.2009.00687.x [15] P. D. Vorwerk, P. W. Froneman, A. W. Paterson, N. A. Strydom and A. K. Whitfield, “Biological Responses to a Resumption in River Flow in a Freshwater Deprived, Permanently Open Southern African Estuary,” Water SA, Vol. 34, No. 5, 2008, pp. 597-604. [16] P. D. Vorwerk, P. W. Froneman and A. W. Paterson, “Re- vival of the Critically Endangered River Pipefish, Syn- gnathus watermeyeri, in Eastern Cape Estuaries,” South African Journal of Science, Vol. 103, 2007, pp. 193-195. [17] N. Grange, A. K. Whitfield, C. J. De Villiers and B. R. Allanson, “The Response of Two South African East Coast Estuaries to Altered River Flow Regimes,” Aquatic Conservation: Marine and Freshwater Ecosystems, Vol. 10, No. 3, 2000, pp. 155-177. doi:10.1002/1099-0755(200005/06)10:3<155::AID-AQC 406>3.0.CO;2-Z [18] O. Holm-Hansen and B. Riemann, “Chlorophyll-a Deter- mination: Improvements in Methodology,” Oikos, Vol. 30, No. 3, 1978, pp. 438-447. doi:10.2307/3543338 [19] K. R. Clarke and R. M. Warwick, “Change in Marine Communities: An Approach to Statistical Analysis and Interpretation,” Plymouth Marine Laboratory, Plymouth, 1994. [20] Statsoft Inc., “Statistica, Data Analysis Software System,” Version 7, 2004 [21] N. A. Strydom, A. K. Whitfield, A. W. Paterson, N. A. Strydom, A. K. Whitfield and A. W. Paterson, “Influence of Altered Freshwater Flow Regimes on Abundance of Larval and Juvenile Gilchristella aestuaria (Pisces: Clu- peidae) in the Upper Reaches of Two South African Es- tuaries,” Marine and Freshwater Research, Vol. 69, 2002, pp. 178-189. [22] P. W. Froneman, “Response of the Plankton to Three Dif- ferent Hydrological Phases of the Temporarily Open/ Closed Kasouga Estuary, South Africa,” Estuarine, Coas- tal and Shelf Science, Vol. 55, 2002, pp. 535-546. doi:10.1006/ecss.2001.0921 [23] A. W. Paterson and A. K. Whitfield, “A Stable Carbon Isotope Study of the Food-Web in a Freshwater-Deprived South African Estuary, with Particular Emphasis on the Ichthyofauna,” Estuarine, Coastal and Shelf Science, Vol. 45, 1997, pp. 705-715. doi:10.1006/ecss.1997.0243 [24] P. D. Vorwerk and P. W. Froneman, “The Importance of Estuarine Derived Carbon for the Near Shore Marine En- vironment: Studies on Contrasting Southern African Es- tuaries,” African Journal of Aquatic Science, Vol. 34, 2009, pp. 67-77. doi:10.2989/AJAS.2009.34.2.4.891 |