

Paper Menu >>
Journal Menu >>
 Journal of Software Engineering and Applications, 2013, 6, 121-130 http://dx.doi.org/10.4236/jsea.2013.63016 Published Online March 2013 (http://www.scirp.org/journal/jsea) 121 Building Productivity Models for Small Enhancements Jean-Marc Desharnais1,2, Gülşah Yıldızoğlu1, Alain April2, Alain Abran2 1Boğaziçi University, Istanbul, Turkey; 2Department of Software Engineering and IT, École de Technologie Supérieure, Montréal, Canada. Email: [email protected] Received January 9th, 2013; revised February 10th, 2013; accepted February 18th, 2013 ABSTRACT Software is in constant evolution and many approaches have been suggested to study software maintenance productivity. This research reports on a process to design and implement a productivity model of legacy software based on the meas- urement of small functional enhancements using the COSMIC ISO 19761 international standard. Two motivations in- fluence this research: 1) understanding the productivity of the software maintenance process to help manage the cost of maintenance; 2) understanding the cost drivers that affect the software maintenance productivity. This research reports on an empirical study of a productivity measurement program implemented in a large banking legacy system. Keywords: Small Enhancements; Productivity; Productivity Models; Maintenance; Cost of Maintenance 1. Introduction 1.1. Definition of Maintenance The software lifecycle can be divided into two distinct parts, as presented in ISO 12207 [1]: the initial develop- ment of the software and its use and ongoing mainte- nance. The international standard ISO 14764 [2] on software maintenance defines four categories to classify the nature of individual maintenance work requests: adaptive, cor- rective, preventive, and perfective (see Table 1). ISO 14764 classifies adaptive and perfective mainte- nance as enhancements, and the corrective and preven- tive maintenance as corrections [2]. This research is fo- cused mainly on adaptive and corrective work requests where most of the changes to functionality occur. Table 1. ISO 14764 Software maintenance categories. Category Description Adaptive Modifications to adapt a software product to change in data requirements and processing environments Corrective Reactive modification of a software product performed after delivery to correct the faults discovered. These modifications often repair code to satisfy functional requirements Preventive Modification of a software product after delivery to detect and correct latent faults before they become operational faults Perfective Modification of a software product after delivery implementing new or changed user requirements which concern functional enhancements to the software In large organizations, most of the IT personnel are as- signed to software maintenance—see Table 2 [3]. How- ever, software maintenance is still a rather neglected ac- tivity by both IT managers and academic research ac- cording to a number of authors (Torchiano, Ricca, and De Lucia [4], Koskinen [5], Kuhlmann [6]). Already in 1996 Basili et al. were reporting that there were not enough empirical studies and available research data for software maintenance [4] while Koskinen [5] was report- ing that “Software maintenance and evolution is a con- siderably understudied area while taking into account its cost effect”. Many of the empirical studies on software maintenance management date back to the pre-2000, such as Abran [7], Lehman [8], Genuchten [9], Arfa [10], Desharnais [11] and others. Table 2 published in 2006 shows that between 2000 and 2005 there was an increase of nearly 4% of the maintenance personnel in USA [12]. The projection for the following years is showing that the number of per- sonnel in maintenance would increase considerably over Table 2. USA software personnel in software development and maintenance—2006 [12]. Year Development personnel Maintenance personnel Total personnel Maintenance percent 2000 750,000 2,000,000 2,750,000 72.73% 2005 775,000 2,500,000 3,275,000 76.34% 2010 800,000 3,000,000 3,800,000 78.95% 2015 1,000,0003,500,000 4,500,000 77.78% 2020 1,100,0003,750,000 4,850,000 77.32% 2025 1,250,0004,250,000 5,500,000 77.27% Copyright © 2013 SciRes. JSEA 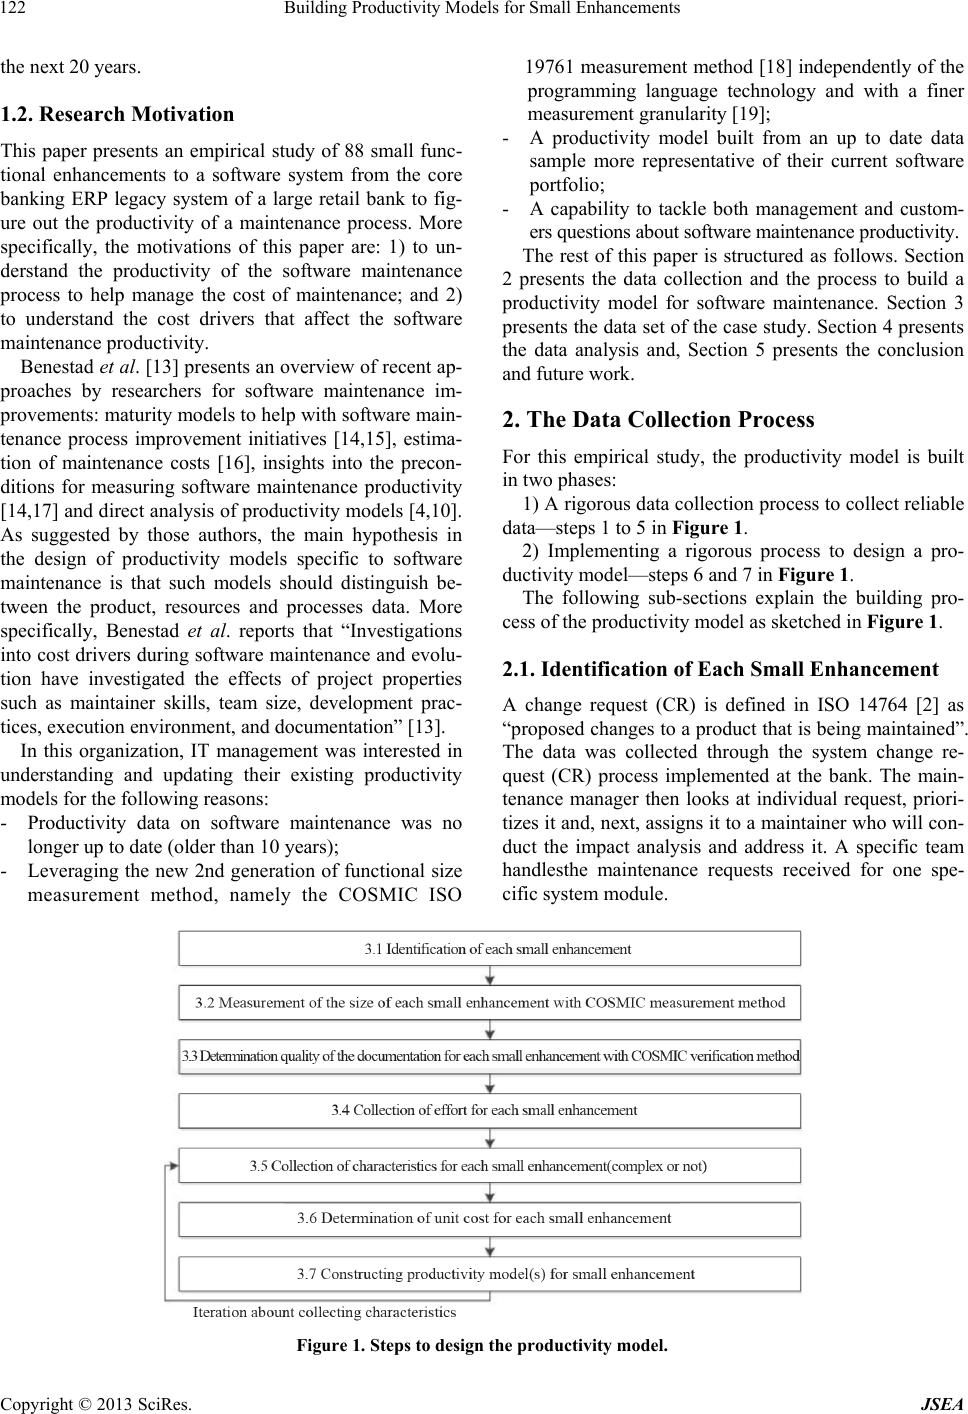 Building Productivity Models for Small Enhancements 122 the next 20 years. 1.2. Research Motivation This paper presents an empirical study of 88 small func- tional enhancements to a software system from the core banking ERP legacy system of a large retail bank to fig- ure out the productivity of a maintenance process. More specifically, the motivations of this paper are: 1) to un- derstand the productivity of the software maintenance process to help manage the cost of maintenance; and 2) to understand the cost drivers that affect the software maintenance productivity. Benestad et al. [13] presents an overview of recent ap- proaches by researchers for software maintenance im- provements: maturity models to help with software main- tenance process improvement initiatives [14,15], estima- tion of maintenance costs [16], insights into the precon- ditions for measuring software maintenance productivity [14,17] and direct analysis of productivity models [4,10]. As suggested by those authors, the main hypothesis in the design of productivity models specific to software maintenance is that such models should distinguish be- tween the product, resources and processes data. More specifically, Benestad et al. reports that “Investigations into cost drivers during software maintenance and evolu- tion have investigated the effects of project properties such as maintainer skills, team size, development prac- tices, execution environment, and documentation” [13]. In this organization, IT management was interested in understanding and updating their existing productivity models for the following reasons: - Productivity data on software maintenance was no longer up to date (older than 10 years); - Leveraging the new 2nd generation of functional size measurement method, namely the COSMIC ISO 19761 measurement method [18] independently of the programming language technology and with a finer measurement granularity [19]; - A productivity model built from an up to date data sample more representative of their current software portfolio; - A capability to tackle both management and custom- ers questions about software maintenance productivity. The rest of this paper is structured as follows. Section 2 presents the data collection and the process to build a productivity model for software maintenance. Section 3 presents the data set of the case study. Section 4 presents the data analysis and, Section 5 presents the conclusion and future work. 2. The Data Collection Process For this empirical study, the productivity model is built in two phases: 1) A rigorous data collection process to collect reliable data—steps 1 to 5 in Figure 1. 2) Implementing a rigorous process to design a pro- ductivity model—steps 6 and 7 in Figure 1. The following sub-sections explain the building pro- cess of the productivity model as sketched in Figure 1. 2.1. Identification of Each Small Enhancement A change request (CR) is defined in ISO 14764 [2] as “proposed changes to a product that is being maintained”. The data was collected through the system change re- quest (CR) process implemented at the bank. The main- tenance manager then looks at individual request, priori- tizes it and, next, assigns it to a maintainer who will con- duct the impact analysis and address it. A specific team handlesthe maintenance requests received for one spe- cific system module. Figure 1. Steps to design the productivity model. Copyright © 2013 SciRes. JSEA  Building Productivity Models for Small Enhancements 123 Adaptive and corrective maintenance: The enhancements with the effort less than 3 weeks of effort1 were selected for analysis. All from the same core banking application, ensuring the same application domain (i.e., management infor- mation system—MIS), programmed on an IBM main- frame environment: e.g., COBOL, PL/1 or tools like Cool:Genusing DB2 or Oracle databases. 2.2. Measurement of the Size of Each Small Enhancement Each 88 small enhancements, being a functional process, represent enough data points to fulfill good statistical conditions for the sixth criteria. These small enhance- ments (adaptive and corrective only) were designed, pro- grammed and implemented on the same large core bank- ing ERP application from April 2010 to December 2011. Each small enhancement had documented and well un- derstood characteristics, in the change request system of the bank, such as: the programming language used, types (i.e. batch vs. online), and tools used—see Appendix A for more details. These 88 small functional enhancements were meas- ured by the same “maintainer” and next verified by an independent COSMIC certified expert. In this step, the COSMIC [18] measurement method was used to deter- mine the size of each small enhancement. To measure the size of a small enhancement, all of its functional proc- esses were identified, and then measured in terms of COSMIC function points (CFP). The maintainer who applied the measurement method was the one who ana- lyzed, programmed and implemented each small enhan- cement. Afterwards, an independent functional measure- ment expert verified the number of CFP obtained for each functional process based on the documentation of each small enhancement (see examples in Appendix A). Each small enhancement had a functional size of less than twenty CFP (COSMIC Function Points). 2.3. Determination of the Quality of the Information Provided for Each Small Enhancement The documentation was produced and controlled by the same maintainer who had implemented the small en- hancements. The quality of the documentation of each small enhancement was assessed based on the COSMIC verification process requirements [19]. This activity helps verify the quality of the functional size results. The determination of the quality of the documentation can be assessed based on: 1) the presence or absence of a data model; 2) the availability of the description of the data movements; and 3) the identification of each functional process in the software. Because the maintainer who had done the maintenance was present during this exercise, it was possible to complete the documentation, when need- ed. The resulting quality of the documentation related to small enhancements used in this case study is considered as high (i.e., of very good quality) based on the quality rating (Appendix A). 2.4. Collection of Effort for Each Small Enhancement The maintainers recorded the effort information on a daily basis. Duration between half a day and 3 weeks. Effort and duration measures were available and reliable. A small team of 1 or 2 maintainers executed every small enhancement. 2.5. Collection of Characteristics of Each Small Enhancement The data available to analyze characteristics are: 1) func- tional size [18]; 2) maintenance categories (adaptive and corrective maintenance types are handled); 3) develop- ment tool (Cool:Gen versus PL/1); 4) batch versus online programs. Cost drivers are used in this empirical study to analyze their influence on the effort. 2.6. Determination of Unit Cost for Each Small Enhancement After the maintenance requests are ordered according to efforts, the number of functional points per hour is used to calculate the productivity ratio while the unit cost is determined by dividing effort (input) required to develop small enhancements to functional size (output) of each small enhancement. Effort Functional Size 2.7. Constructing Productivity Model(s) for Small Enhancements A productivity model is typically built with data from CRs completed, when all information on a CR is avail- able and that there is no more uncertainty: all of the software functions have been delivered and all of the number of hours for the project have been completed and measured. 3. Presentation of the Dataset This section presents a descriptive analysis of the dataset. Table 3 shows the minimum, maximum, average and standard deviation of the functional size (in number of CFP) and effort (in person-hours) of this data set. In 1It was decided by the organization analyzed that if an enhancement works take more than three weeks it fall in another category. Copyright © 2013 SciRes. JSEA  Building Productivity Models for Small Enhancements 124 Table 3. Distribution of CFP and hours. Min. Max. Avg. Std. Dev. CFP 3 13 5.0 2.1 Effort 1 40 9.9 8.4 Table 3, the functional size of the for small enhance- ments varies from 3 to 13 CFP, while the effort in hours varies from 1 to 40 hours. The average functional size of a small enhancement is 5 CFP with a standard deviation of 2.1 CFP. The average number of hours is 9.9 with a standard deviation of 8.4 hours. Table 4 presents the others variables. Those variables are related to the programming (PL/1 or Cool:Gen), the access type (Batch or Online) and the type of main- tenance (adaptive or corrective). Since these variables are descriptive, they must be transformed into dummy vari- ables, where eachcandidate value isbinary (either 0 or 1: presence or absence) for each of those category of vari- able . In Tabl e 4, the number of small enhancements pro- gram in PL/1 is 39, and in Cool:Gen 49. The types of access for small enhancements are respectively 39 and 49, and the type of enhancement are 51 for adaptive and 26 for corrective. There is no information for 11 small enhancements or they are mixed. Also, when looking at the data (Appendix A) it shows that the PL/1 is always associated with Batch and Cool:Gen with Online. For this reason it is not possible to analyze those variables independently. 4. Analysis of the Data SPSS was used to analyze the data with regression statis- tics. The acceptance of regression results hinges on di- agnostic checking for the acceptance of “classical as- sumptions” [20]. In software engineering, the classical assumption is that the size should explain 70% of the effort 80% of the time. For this analysis, if the regression analysis is showing a result greater than 0.70, this will confirm the “classical assumption” [20]. 4.1. Regression Analysis Procedure To proceed for a regression analysis it is necessary to follow the procedure commended in [20]. A) Steps before starting the regression: 1) Define the methodology to build the regression model for productivity (Section 2). 2) Decide which variable will be used in the model. 3) Choose the statistical tool and enter the data for sta- tistical analysis. 4) Use descriptive analysis to find outliers. From the descriptive statistics no outlier is present for the quantita- tive variables (functional size and effort) in the data set Table 4. Others variables. Variable Category Number of enhancements PL/1 39 Programming language Cool:Gen 49 Batch 49 Type of programs Online 39 Adaptive 51 Type of maintenanceCorrective 26 used. B) Steps for the regression analysis: 1) Choose which variables will be analyzed. 2) Run a regression analysis. 3) Present the results. 4) Interpret the results. 5) Accept or reject the results (in the productivity mo- del). 6) Start again with new choices of variables. 4.2. Linear Regression Models It is not possible to present all the results. Only some of them will be presented following the proposed steps: 1) Choose which variables will be analyzed. In this regression analysis, the functional size of small enhancements is selected as the dependent variable and effort as the independent variable in the model. This analysis aims to find the relation between functional size and effort: Effort = function (functional size in CFP) 2) Run a regression analysis. SPSS was chosen to run a linear regression analysis with the ANOVA (Table 4). Table 5 shows the regression analysis and the ANOVA, and Figure 2 the corresponding regression plot. In Figure 2 the regression plot is based on 88 small en- hancements points at the intersection of the size (CFP) and the effort. There is no obvious outlier that can be seen. 3) Interpret the results. The coefficient of determination (i.e. R2) result is 0.75. This study considers that a R2 of 0.70 is acceptable in software engineering. For the Anova in Table 5, the last column Sig. shows the goodness of fit of the model. If this number is smaller than 0.01 then the model is sig- nificant at 99%, if it is smaller than 0.05 then the model is significant at 95%, and if it less than 0.1 the model is significant at 90% [20]. Significance implies the accep- tance of the model: the lower this number, the better it fits. For the Anova in Ta ble 5, the Sig. value of 0.000 confirms the significance of the model at more than 99%. The result is acceptable from the goodness of the fit. The number of CFP explains more than 75% of the Copyright © 2013 SciRes. JSEA  Building Productivity Models for Small Enhancements 125 Table 5. Regression analysis and Anova. Variables Entered/Removeda Model Variables Entered Variables Removed Method 1 CFPb Enter aDependent variable: Effort; bAll requested variables entered. Model Summary Model R R Square Adjusted R Square Std. Error of the Estimate 1 0.870a 0.757 0.754 4.155 aPredictors: (Constant), CFP. ANOVAa Model Sum of Squares df Mean Square F Sig. Regression 1 Residual Total 4,617,496 1,484,948 6,102,443 1 86 87 4,617,496 17,26 267,420 0,000^b aDependent variable: Effort, bPredictors: (Constant), CFP. variance in the effort. 4) Start again from new choices of variables. 4.3. Linear Regression Models In the previous models, only two variables were used. The next question is: is it possible to improve the regres- sion value using some other variables or multiple vari- ables? Table 5 presents the multi-regressions results for the three (3) independent cost drivers analyzed, together with the independent variable CFP, and the dependent vari- able effort. Table 5 shows that the R2 is constantly over 0.75, which means that independents variables (adaptive/cor- rective, online/batch) used for regression analysis explain more than 75% of the variance in the effort variable. The ANOVA still have a Sig. of 0.000 for all three multi-re- gressions and the plot is not very useful because of the binary nature of each variable. However, none of these additional independent variables adds much to the ex- planation of the relationship with functional size and effort, which already had an R2 of 0.75, thereby, the con- tribution of these additional variables, concurrently, is minimal. Average Unit Cost This research also presents the average unit costs using a number of cost drivers. Table 6 shows that the average unit cost for all the data is 1.81 hours per CFP with a difference between the lowest and highest average of 0.9 hours for 88 small en- hancements. Table 7 shows that that the lowest unit cost is for Table 6. Multi-regression models. Independent Variables Size & Adaptive/ Corrective Size & Online/Batch Size & PL1/Cool:Gen R2 0.773 0.761 0.759 Table 7. Unit cost per variable. Variables Average hours/CFP All data 1.8 Batch 1.6 Online 2.0 Adaptive 1.4 Corrective 2.5 Adaptive maintenance (1.4 hrs/CFP), while corrective maintenance costs almost twice as much (2.5 hrs/CFP). For Batch and Online the average is 1.6 and 2.0 hours/ CFP respectively. 5. Conclusions and Future Works The following five criteria were followed in this empiri- cal study: 1) Use of an internationally recognized functional size measurement method to measure every small functional enhancement, that is: the COSMIC ISO 19761 measure- ment method [17] was used to measure the functional size of each small enhancement (functional processes were measured and verified). 2) Assessment of the quality of the documentation used for the sizing of each functional enhancement. 3) A controlled environment for the maintenance per- sonnel that worked on the enhancements. 4) Implementation of a reliable effort data collection mechanism for each small enhancement. 5) Documentation of the individual characteristics of each small enhancements included in this empirical study. Enough data points (individual enhancements) are col- lected to build a valid productivity model. Using those criteria, it was possible to produce a pro- ductivity model with this sample using all independent variables (R2 of more than 0.75) of a specific large retail bank. The productivity is 20% better using Online, instead of Batch mode (Table 6). Unit cost is also better (almost 60% decrease) for adaptive maintenance compare to cor- rective maintenance. There were a number of homogeneous empirical con- ditions to construct this productivity model (Ta bl e 4 and Figure 2): functional enhancements to the same major software banking application within a single organiza- tion, each distinct functional enhancement designed, Copyright © 2013 SciRes. JSEA  Building Productivity Models for Small Enhancements Copyright © 2013 SciRes. JSEA 126 [8] M. M. Lehman, “System Maintenance and Evolution in an Era of Reuse, COTS, and Component-Based Systems,” International Conference on Software Maintenance (ICSM), Oxford, 30 August 1999. [9] M. Van Genuchten, G. Brethouwer, T. Van den Boomen and F. J. Heemstra, “An Empirical Study of Software Maintenance,” Information and Software Technology, Vol. 34, No. 8, 1992, pp. 507-512. doi:10.1016/0950-5849(92)90144-E [10] L. B. Arfa, A. Mili and L. Sekhri, “An Empirical Study of Software Maintenance,” Proceedings of Conference on Software Maintenance, Sorrento, 15-17 October 1991, pp. 52-58. [11] J. M. Desharnais, F. Pare, M. Maya and D. St-Pierre, “Im- plementing a Measurement Program in Software Mainte- nance: An Experience Report Based on Basili’s App- roach,” IFPUG Spring Conference, Cincinnati, 1997. Figure 2. Regression plot with size & effort. programmed and implemented by the same person, docu- mented by the maintainer, measured within a controlled environment and verified by a measurement expert. [12] C. Jones, “The Economics of Software Maintenance in the Tweenty First Century,” 2006. [13] H. C. Benestad, B. Anda and E. Arisholm, “Understanding Software Maintenance and Evolution by Analyzing Indi- vidual Changes: A Literature Review,” Journal of Soft- ware Maintenance and Evolution: Research and Practice, Vol. 21, No. 6, 2009, pp. 349-378. doi:10.1002/smr.412 While this type of situation is common in practice, availability of such data for empirical analysis is scarce. On the other hand, such homogeneity limits the gener- alization of the results to other contexts, such as different software applications. Availability of additional data sets is therefore necessary for further research work. [14] A. April and A. Abran, “Software Maintenance Mana- gement: Evaluation and Continuous Improvement,” Wi- ley-IEEE Computer Society Press, Honoken, 2008. doi:10.1002/9780470258033 REFERENCES [15] M. Kajko-Mattsson, “Corrective Maintenance Maturity Model (CM3): Maintainer’s Education and Training,” Proceedings of the 23rd International Conference on So- ftware Engineering, Toronto, 12 May 2001, pp. 610-619. [1] ISO/IEC 12207, Systems and Software Engineering— Software Life Cycle Processes, International Organization for Standardization, Geneva, 2008. [2] ISO/IEC 14764, Software Engineering—Software Life Cycle Processes—Maintenance, International Organiza- tion for Standardization, Geneva, 2006. [16] A. Abran, “Estimation Models for Software Maintenance Based on Functional Size,” Journal of Software Tech- nology, Vol. 9, No. 3, 2006, pp. 18-25. [3] M. Maya, A. Abran and P. Bourque, “Measuring the Size of Small Functional to Enhancements Software,” The 6th International Workshop on Software Measurement, Re- gensburg, 19-20 September 1996. [17] A. April, A. Abran and R. R. Dumke, “Software Mainte- nance Productivity Measurement: How to Assess the Readiness of Your Organization, Software Maintenance Productivity Measurement,” IWSM/Metrikon, 2004. [4] J. Koskinen, “Software Maintenance Costs,” University of Jykäskylä, Finland, 2010. [18] Measurement Manual v3.0.1 (The COSMIC Implementa- tion Guide for ISO/IEC 19761: 2003), 2009, The Com- mon Software Measurement International Consortium (COSMIC), 2012. [5] M. Torchiano, F. Ricca and A. De Lucia, “Empirical Studies in Software Maintenance and Evolution,” IEEE International Conference on Software Maintenance, Paris, 2-5 October 2007, pp. 491-494. [19] The COSMIC Functional Size Measurement Method Ver- sion 3.0.1 Guideline for Assuring the Accuracy of Meas- urements Version 0.92, Common Software Measurement International Consortium, 2011. [6] U. Kuhlmann, “Maintenance Activities in Software Proc- ess Models: Theory and Case Study Practice,” Master Thesis, University of Koblenz Landau, Koblenz, 2003, pp. 1-135. [20] Regression Explained in Simpler Terms, A Vijay Gupta Publication, SPSS for Beginners, 2000. https://mywebspace.wisc.edu/rlbrown3/web/library/regres sion_explained.pdf [7] A. Abran and H. Nguyenkim, “Analysis of Maintenance Work Categories through Measurement,” IEEE Interna- tional Conference on Software Maintenance, Sorrento, 15-17 October 1991, pp. 104-113.  Building Productivity Models for Small Enhancements 127 Appendix A. List of the Small Enhancements with Measures No Identification E R W XCFPEffortTypeRatioToolQualityBatch Online Write ExitModule 1 Changing General Ledger Numbers of Retail Credit 1 1 1 1 44 M 1.00PL/IA Y N 0 0 1 2 Changing General Ledger Numbers of Commercial Credits1 1 1 1 44 M 1.00PL/IA Y N 0 0 1 3 Changing General Ledger Numbers of Overdue Credits 1 1 1 1 44 M 1.00PL/IA Y N 0 0 1 4 Calculation of Effective Interest Rate of Retail Credits 1 2 2 1 622 N 3.67PL/IA Y N 1 0 1 5 Calculating Adjustment Amount of Retail Credits 1 2 2 1 620 N 3.33PL/IA Y N 1 0 1 6 Daily Adjustment Accounting 1 5 1 1 818 N 2.25PL/IA Y N 0 0 0 7 Changing Commission and Income General Numbers of Amortization Batch 1 1 0 1 34 M 1.33PL/IA Y N 0 0 0 8 Transfer of Opening Commissions related to Commercial Credits with payment plan number to the income system 1 1 1 1 44 M 1.00Cool: Gen A N Y 0 0 0 9 Transfer of Opening Commissions related to Commercial Credits with no payment plan number to the income system (PL/I batch is used) 1 1 0 1 33 M 1.00PL/IA Y N 0 0 0 10 Cancel amortization of opening commissions related to commercial credits with payment plan number to the income system 1 1 1 1 44 M 1.00Cool: Gen A N Y 0 0 0 11 Transfer of Periodic Commissions related to Commercial Credits with payment plan number to the income system 1 1 0 1 34 M 1.33Cool: Gen A N Y 0 0 0 12 Cancel amortization of periodic commissions related to commercial credits with payment plan number to the income system 1 1 1 1 44 M 1.00PL/IA Y N 0 0 0 13 Transfer of Opening Commissions related to Retail Credits with payment plan number to the income system 1 1 1 1 44 M 1.00Cool: Gen A N Y 0 0 0 14 Cancel amortization of opening commissions related to retail credits with payment plan number to the income system 1 1 1 1 44 M 1.00Cool: Gen A N Y 0 0 0 15 Transfer of Periodic Commissions related to Retail Credits with payment plan to the income system 1 1 1 1 44 M 1.00PL/IA Y N 0 0 0 16 Cancel amortization of periodic commissions related to commercial retail income system 1 1 1 1 44 M 1.00PL/IA Y N 0 0 0 17 Commercial Credits Commission Rediscount Create 1 1 1 1 42 M 0.50PL/IA Y N 0 0 0 18 Commercial Credits Commission Rediscount Function 2 2 2 1 710 N 1.43PL/IA Y N 1 0 0 19 Calling IFRS general link to calculate EIR, Adjustment and Effective amount in Commercial Credits Investment Rediscount 1 2 2 1 610 N 1.67Cool: Gen A N Y 1 0 0 20 Calling IFRS general link to calculate EIR, Adjustment and Effective amount in Retail Credits Investment Rediscount 1 2 2 1 610 N 1.67Cool: Gen A N Y 1 0 0 Copyright © 2013 SciRes. JSEA  Building Productivity Models for Small Enhancements 128 No Identification E R W X CFPEffortTypeRatioTool QualityBatch Online Write ExitModule 21 Calling IFRS general link to calculate EIR, Adjustment and Effective amount in Retail Credits Commission Rediscount 1 2 2 1 6 8 N 1.33Cool:GenA N Y 1 0 0 22 Cancel of calling amortization create from periodic commission collection of retail credits 1 1 1 1 4 3 M 0.75PL/I A Y N 0 0 0 23 Cancel of calling amortization create from opening commission collection of retail credits 1 1 1 1 4 3 M 0.75Cool:GenA N Y 0 0 0 24 Cancel of calling amortization create from periodic commission collection of commercial credits 1 1 1 1 4 3 M 0.75PL/I A Y N 0 0 0 25 Calling income system link from periodic commission collection of retail credits 1 1 1 1 4 4 M 1.00PL/I A Y N 0 0 0 26 Calling income system link from opening commission collection of retail credits 1 1 1 1 4 4 M 1.00Cool:GenA N Y 0 0 0 27 Calling income system link from periodic commission collection of commercial credit 1 1 1 1 4 4 M 1.00PL/I A Y N 0 0 0 28 Cancel of calling amortization create from accrual system 1 1 1 1 4 3 M 0.75PL/I A Y N 0 0 0 29 Calling commercial credits commission rediscount create link from accrual system 1 1 1 1 4 4 M 1.00PL/I A Y N 0 0 0 30 Connection between income system and amortization system for opening commission records of commercial credits with no payment plan 1 0 1 1 3 4 M 1.33Cool:GenA N Y 0 0 1 31 Extra Commission Collection Facility for Commercial Credits1 6 5 1 13 35 N 2.69Cool:GenA N Y 1 0 1 32 Extra Commission Collection Facility for Retail Credits 1 5 4 1 11 28 N 2.55Cool:GenA N Y 1 0 1 33 Discarding new Transactions from the First Level of Accounting Unload 1 1 1 3 1 M 0.33PL/I A Y N 0 0 0 34 Adding new Transactions to the Second Level of Accounting Unload 1 1 1 3 1 M 0.33PL/I A Y N 0 0 0 35 Loading accounting from excel file to the system without using general parametric accounting link 1 3 1 1 6 14 N 2.33PL/I A Y N 0 0 1 36 Comparison of accounting movement and account movement to control trial balance (in two ways: from accounting to account movement and from account movement to accounting movement) 1 2 1 4 12 M 3,00PL/I A Y N 0 0 1 37 Facility to insert general numbers according to product 1 3 1 1 6 10 N 1.67Cool:GenA N Y 0 0 0 38 Facility to insert old product codes and new products codes into product change parameter table 1 2 1 1 5 6 M 1.20Cool:GenA N Y 0 0 0 39 NBR Opening Commission Report of Retail Credits 1 1 1 1 4 4 M 1.00PL/I A Y N 0 0 0 40 NBR Periodic Commission Report of Retail Credits 1 1 1 1 4 4 M 1.00PL/I A Y N 0 0 0 41 NBR Extra Commission Report of Retail Credits 1 1 1 1 4 4 M 1.00PL/I A Y N 0 0 0 42 NBR Opening Commission Report of Commercial Credits 1 1 1 1 4 4 M 1.00PL/I A Y N 0 0 0 Copyright © 2013 SciRes. JSEA  Building Productivity Models for Small Enhancements 129 No Identification E R W X CFPEffortTypeRatio Tool QualityBatch Online Write ExitModule 43 NBR Periodic Commission Report of Commercial Credits1 1 1 1 4 4 M 1.00PL/I A Y N 0 0 0 44 NBR Extra Commission Report of Commercial Credits 1 1 1 1 4 4 M 1.00PL/I A Y N 0 0 0 45 Facility to Relate Income Codes with Product Codes 1 1 1 1 4 4 M 1.00Cool:GenA N Y 0 0 0 46 List of Income Codes Related to Product Codes 1 1 1 1 4 8 M 2.0 Cool:GenA N Y 0 0 0 47 Impair Flag Update for Risky Credits 1 5 2 1 9 16 N 1.78PL/I A Y N 1 0 1 48 Calculating Effective Interest Amount of Commercial Credits1 6 2 1 1026 N 2.60PL/I A Y N 1 0 1 49 Calculation Effective Interest Rate(EIR) of Commercial Credits 1 2 2 1 6 12 N 2.00PL/I A Y N 1 0 1 50 Calculating Adjustment Amount of Commercial Credits 1 2 2 1 6 13 N 2.17PL/I A Y N 1 0 1 51 Customer Account Report General Ledger Number Change1 1 1 3 1 M 0.33PL/I A Y N 0 0 0 52 Recover Table Lock Escalation Problem 1 1 1 1 4 10 M 2.50PL/I A Y N 0 0 0 53 Income Delivery Operations 1 4 3 2 1040 N 4.00PL/I A Y N 1 0 1 54 Pricing Service List 1 1 2 4 16 M 4.00Cool:GenA N Y 0 0 0 55 Service Definition Operation 1 2 1 3 7 16 N 2.29Cool:GenA N Y 0 1 0 56 Record Priority Screen 1 1 1 1 4 8 M 2.00Cool:GenA N Y 0 0 0 57 Pricing Service code Product Code Relation 1 1 1 1 4 8 M 2.00Cool:GenA N Y 0 0 0 58 Service Pricing 3 1 3 1 8 24 N 3.00Cool:GenA N Y 1 0 0 59 Business of Industry Price Detail Entry 2 3 1 2 8 22 N 2.75Cool:GenA N Y 0 0 0 60 Reference Price Detail Entry 2 3 1 2 8 18 N 2.25Cool:GenA N Y 0 0 0 61 Special Price Detail Entry 2 3 1 2 8 19 N 2.38Cool:GenA N Y 0 0 0 62 Charge Commission Amount Querying 2 6 4 1238 N 3.17Cool:GenA N Y 0 1 1 63 Calculation of Profitability of Customer for Company 1 2 2 5 20 M 4.00PL/I A Y N 0 0 1 64 Extract of Account Report 1 3 2 6 24 N 4.00PL/I A Y N 0 0 1 65 Revenue List 1 3 2 6 22 N 3.67PL/I A Y N 0 0 1 66 Campaign Parameter Entry Screen Change 1 1 1 2 5 8 M 1.60Cool:GenA N Y 0 0 0 67 Closing Accounts According to Criteria 1 4 1 2 8 24 N 3.00PL/I A Y N 0 0 1 68 General Ledger Number Update1 3 1 2 7 11 N 1.57PL/I A Y N 0 0 0 69 Adding New Fields to the Campaign Parameter Entry Screen 1 1 1 1 4 10 M 2.5 PL/I A Y Y 0 0 0 70 Adding New Fields to the Campaign Product Parameter Entry Screen 1 1 1 3 8 M 2.67PL/I A Y Y 0 0 0 71 Customer Report Interest Amount Setting 1 2 1 4 6 M 1.5 PL/I A Y N 0 0 0 72 Adding new Accounting Case To the Income Return Process1 2 1 1 5 10 M 2 Cool:GenA N Y 0 0 1 73 Retail Credits Interest Discount Control Link 1 1 1 3 8 M 2.67Cool:GenA N Y 0 0 0 74 Customer Transfer Check Link1 1 1 3 8 M 2.67Cool:GenA N Y 0 0 0 75 Cost Matrix Special Price Definition Log List 1 1 2 4 6 M 1.5 PL/I A Y N 0 0 0 Copyright © 2013 SciRes. JSEA  Building Productivity Models for Small Enhancements Copyright © 2013 SciRes. JSEA 130 No Identification E R W X CFPEffortTypeRatioTool Quality Batch Online Write Exit Module 76 Accounting Transaction Group List Service 1 1 1 3 8 M 2.67Cool:GenA N Y 0 0 0 77 Account Plan Service 1 1 1 3 8 M 2.67Cool:GenA N Y 0 0 0 78 Accounting Transaction List Performance Enhancement 1 1 1 3 7 M 2.33Cool:GenA N Y 0 0 0 79 Simulation facility to calculate EIR, adjustment and effective amount 1 1 2 4 8 2 Cool:GenA N Y 0 0 0 80 Valuable Fund Tax Transfer 1 3 1 1 6 10 1.67PL/I A Y N 0 0 1 81 General Ledger Number Update for Unit 1 2 1 4 4 1 PL/I A Y N 0 0 0 82 Credit Read Service 1 1 1 3 8 2.67Cool:GenA N Y 0 0 0 83 Retail Credits Master Information Read Service 1 1 1 3 8 2.67Cool:GenA N Y 0 0 0 84 Parametric Accounting Detail Read Service 1 2 2 5 10 2 Cool:GenA N Y 0 0 0 85 Rediscount Information Update Service 1 1 1 1 4 8 2 Cool:GenA N Y 0 0 0 86 Amortization Information Update Service 1 1 1 1 4 8 2 Cool:GenA N Y 0 0 0 87 Commission Report new fields request for Retail Credits 1 1 2 4 3 0.75PL/I A Y N 0 0 0 88 Commission Report new fields request for Commercial Credits1 2 2 5 5 1 PL/I A Y N 0 0 0 Appendix B. Small Enhancements Documentation (2 Examples) 1) Changing General Ledger Numbers of Retail Credits There is a ledger number for each product code. If the product code is changed, ledger number must be changed. Trigger: Product code change Entry: Product Code Read: General Ledger (1 Read) Write: General Ledger (1Write) Error Message: 1 Exit (General Ledger number is not defined related to product code) 1(E) + 1(R) + 1(W) + 1(X) = 4CFP Quality: A Effort Enh. = 4 hours Data Group: General Ledger 2) Changing General Ledger Numbers of Commercial Credits There is a ledger number for each product code. If the product code is changed, ledger number must be changed. Trigger: Product code change Entry: Product Code Read: General Ledger (1 Read) Write: General Ledger (1Write) Error Message: 1 Exit (General Ledger number is not defined related to product code) 1(E) + 1(R) + 1(W) + 1(X) = 4CFP Quality: A Effort Enh. = 4 hours Data Group: General Ledger |