

Paper Menu >>
Journal Menu >>
 Vol.2, No.10, 1057-1060 (2010) Natural Science http://dx.doi.org/10.4236/ns.2010.210130 Copyright © 2010 SciRes. OPEN ACCESS High sensitive and rapid responsive n-type Si: Au sensor for monitoring breath rate Xuelan Hu1, Jiachang Liang2*, Xing Li3, Yue Chen4, Chao Zou5, Sheng Liu6, Xin Chen2 1Sino-European Institute of Aviation Engineering, Civil Aviation University of China, Tianjin, China; 2College of Science, Civil Aviation University of China, Tianjin, China; *Corresponding Author: [email protected]; 3Department of Automation, Tianjin Technical Normal Institute, Tianjin, China; 4College of Aeronautical Engineering, Civil Aviation University of China, Tianjin, China; 5China Electronic Standardization Institute, Beijing, China; 6Sino-European Institute of Aviation Engineering, Civil Aviation University of China, Tianjin, China. Received 25 March 2010; revised 30 April 2010; accepted 6 May 2010. ABSTRACT 125 µm-breath sensor with high sensitivity and rapid response was prepared by using n-type Si: Au material. Its sensitivity coefficient and time constant were 4 V.sec / L and 38 msec, respec- tively. Its working principle was based on ano- malous resistance effect, which not only increa- sed the sensitivity, but also reduced its time constant greatly. Its signal processing system can select the breath signals and work stably. Therefore, the small changes of breath system can be measured and, especially, patient’s breath rate can be monitored at a distance. Keywords: Breath sensor; Signal processing system; Deep impurity; Anomalous resistance effect 1. INTRODUCTION For semiconductors containing shallow impurities, in- cluding n-type silicon, the variation of its resistance Rs with temperature obeys T-3 / 2 rule, i.e. Rs = CT-3 / 2 (1) where C is proportional constant. For single crystal n-type silicon doped with deep impurities, near room temperature, the relationship between its resistance Rd and temperature T satisfies [1-3] Rd = C exp [ – (EF – EA) / kT ] (2) where k is Boltzmann constant, EF Fermi level and EA the deep acceptor level in the band gap of silicon con- taining deep acceptor impurities. For n-type Si: Au (n- type silicon containing deep acceptor impurities of gold), the anomalous resistance effect of exponential term in Eq.2 can increase the sensitivity greatly. To compare the effects of T-3 / 2 and exp [– (EF – EA) / kT], we take kkTEETB TBEET dTdR dTdR dR dR A F AF s d s d 3 / ] / )( [ exp)( )( )( 2 / / 2/1 (3) Fermi level and the deep acceptor level of gold impu- rity are equal to 0.57 eV and 0.54 eV, respectively, be- low the conduction band in the band gap of our n-type Si: Au material and, thus, EF – EA = 0.03 eV. At room tem- perature (T = 300 K), we have 3 10 3.1 s d dR dR (4) Our experimental measuring value is 3 105.1 . There- fore, the sensitivity of 125 µm-breath sensor, made by Wheatstone bridge using n-type Si: Au material as bridge arms, can be increased by 103 times, comparing with con- taining shallow impurities [4]. Our 125 µm-breath sensor can be used to monitor dif- ferent breath flux and frequencies. In the Wheatstone bridge of our 125 µm-breath sensor, the variation of the offset voltage will play a vital role to the circuit. Gener- ally speaking, the offset voltage is not a constant, but ra- ther a function containing several unknown parameters. It varies according with the changes of ambient tempe- rature and brightness, service voltage and current, even the technical defects during manufacturing. Another fac- tor affecting the offset voltage is the asymmetry between the bridge arms, especially the relevant resistors’ tem- perature coefficient, which depends on the deep impurity. If the offset voltage remains constant, the voltage output of 125 µm-breath sensor only depends on its flux. In order to eliminate the offset voltage drift, some compensation methods and auto-adjusting circuits are adopted. Thus, the sensor with such signal processing system can be used as  X. L. Hu et al. / Natural Science 2 (2010) 1057-1060 Copyright © 2010 SciRes. OPEN ACCESS 1058 the breath sensor to monitor the patient’s breath rate. 2. EXPERIMENTS In n-type Si, the concentration of doped phosphorus (shallow donor impurity) was equal to 15 100.1 cm-3 and in n-type Si: Au material the concentration of gold (deep acceptor impurity) was equal to 15 101.1 cm-3. The doped Au element was diffused in Si substrate by deep doping method [5]. The main part of 125 µm- breath sensor, made of n-type Si: Au material, was a Wheatstone bridge using anisotropic etching n-type Si: Au resistors. The length of each bridge arm was 125 µm. In terms of electrostatic method, the bridge was bonded to a borosilicate grass substrate, which had high thermal isolation capacity. The structure and photograph of the integrated fabrication of the 125 µm-breath sensor were shown in Figures 1 and 2, respectively. The schematic diagram of monitoring system of 125 µm-breath sensor was shown in Figure 3. A resistor R was connected in series with the power supply circuit to protect the sensor. The measurement was carried out in a 6 mm-radius tube with the measuring range from 0 to 27 L/min. Before measuring, the circuit should be supplied Figure 1. The structure of the 125 µm-breath sensor. Figure 2. Photograph of integrated fabrication of 125 µm-breath sensor. Figure 3. The schematic diagram of monitoring system of the 125 µm-breath sensor. with power to preheat for 30 minutes. The static and tran- sient characteristics of 125 µm-breath sensor were mea- sured, including the output voltage as well as time con- stant of 125 µm-breath sensor. 3. RESULTS AND DISCUSSION 3.1. Working Principle of 125 µm-breath Sensor Except for using n-type Si: Au material instead of hot wires to form the electric bridge arms, this 125 µm-breath sensor shares the same principle with the hot wire flow meter. When air flows through the electric bridge, the temperature variation between the two arms perpendicu- lar to the air flow direction is much more than that be- tween the two arms parallel with the air flow direction. Thus, the temperature difference lead to the resistance change of each bridge arm, and then lead to the change of output voltage related with the flux at the output ends. The sensitivity of the sensor depends on the resistance variation of the electric bridge arms when air flows through the sensor. The more the resistance varies, the higher the sensor’s sensitivity is. When the sensor size decreases to micro dimensions, the contact area between the air and bridge arms is also largely reduced. So se- lecting materials which have high sensitivity toward temperature is the key problem. The sensitivity of 125 µm-breath sensor was increased greatly by using n-type Si: Au material, because deep doping method can in- crease the temperature sensitivity of the electric bri- dge’s single arm resistance, as shown in Eq.3 and Eq.4. 3.2. The Static Characteristics of the Monitoring System of 125 µm-breath Sensor Suppose the measurand is x , output isyand the re- sponse time is zero, the function between the measurand and the output should be 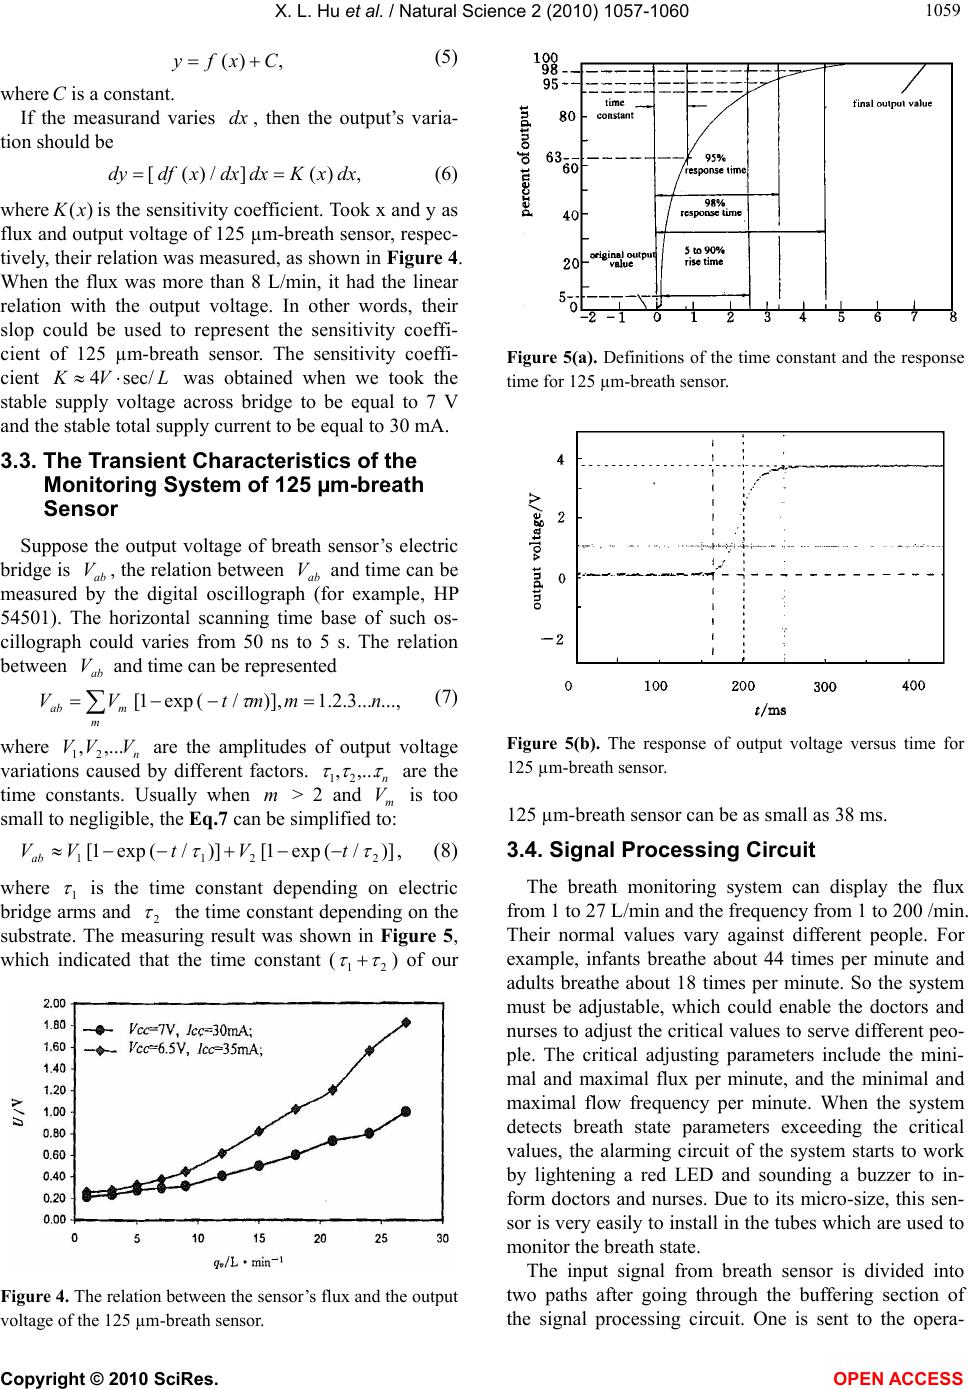 X. L. Hu et al. / Natural Science 2 (2010) 1057-1060 Copyright © 2010 SciRes. OPEN ACCESS 105 1059 , )( Cxfy (5) where Cis a constant. If the measurand varies dx , then the output’s varia- tion should be , )( ] / )( [dxxKdxdxxdfdy (6) where )(xK is the sensitivity coefficient. Took x and y as flux and output voltage of 125 µm-breath sensor, respec- tively, their relation was measured, as shown in Figure 4. When the flux was more than 8 L/min, it had the linear relation with the output voltage. In other words, their slop could be used to represent the sensitivity coeffi- cient of 125 µm-breath sensor. The sensitivity coeffi- cient LVK sec/4 was obtained when we took the stable supply voltage across bridge to be equal to 7 V and the stable total supply current to be equal to 30 mA. 3.3. The Transient Characteristics of the Monitoring System of 125 µm-breath Sensor Suppose the output voltage of breath sensor’s electric bridge is ab V, the relation between ab V and time can be measured by the digital oscillograph (for example, HP 54501). The horizontal scanning time base of such os- cillograph could varies from 50 ns to 5 s. The relation between ab V and time can be represented ...,...3.2.1)], / ( exp1[ nmmtVV m mab (7) where n VVV ,..., 21 are the amplitudes of output voltage variations caused by different factors. n ,..., 21 are the time constants. Usually when m > 2 and m V is too small to negligible, the Eq.7 can be simplified to: )] / ( exp 1[ )] / ( exp1[ 2211 tVtVVab , (8) where 1 is the time constant depending on electric bridge arms and 2 the time constant depending on the substrate. The measuring result was shown in Figure 5, which indicated that the time constant (21 ) of our Figure 4. The relation between the sensor’s flux and the output voltage of the 125 µm-breath sensor. Figure 5(a). Definitions of the time constant and the response time for 125 µm-breath sensor. Figure 5(b). The response of output voltage versus time for 125 µm-breath sensor. 125 µm-breath sensor can be as small as 38 ms. 3.4. Signal Processing Circuit The breath monitoring system can display the flux from 1 to 27 L/min and the frequency from 1 to 200 /min. Their normal values vary against different people. For example, infants breathe about 44 times per minute and adults breathe about 18 times per minute. So the system must be adjustable, which could enable the doctors and nurses to adjust the critical values to serve different peo- ple. The critical adjusting parameters include the mini- mal and maximal flux per minute, and the minimal and maximal flow frequency per minute. When the system detects breath state parameters exceeding the critical values, the alarming circuit of the system starts to work by lightening a red LED and sounding a buzzer to in- form doctors and nurses. Due to its micro-size, this sen- sor is very easily to install in the tubes which are used to monitor the breath state. The input signal from breath sensor is divided into two paths after going through the buffering section of the signal processing circuit. One is sent to the opera- 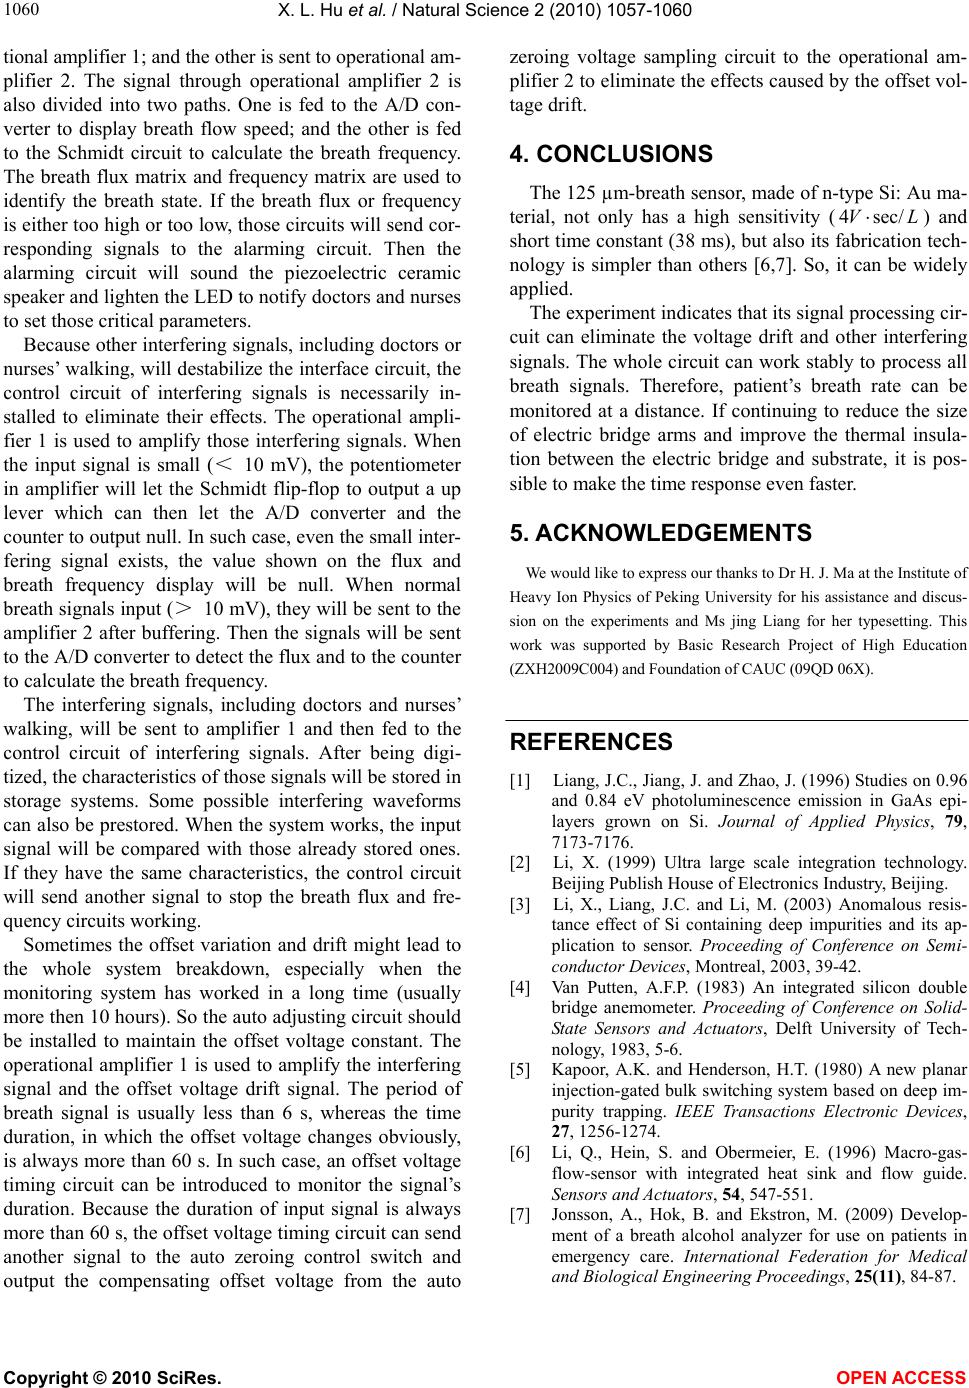 X. L. Hu et al. / Natural Science 2 (2010) 1057-1060 Copyright © 2010 SciRes. OPEN ACCESS 1060 tional amplifier 1; and the other is sent to operational am- plifier 2. The signal through operational amplifier 2 is also divided into two paths. One is fed to the A/D con- verter to display breath flow speed; and the other is fed to the Schmidt circuit to calculate the breath frequency. The breath flux matrix and frequency matrix are used to identify the breath state. If the breath flux or frequency is either too high or too low, those circuits will send cor- responding signals to the alarming circuit. Then the alarming circuit will sound the piezoelectric ceramic speaker and lighten the LED to notify doctors and nurses to set those critical parameters. Because other interfering signals, including doctors or nurses’ walking, will destabilize the interface circuit, the control circuit of interfering signals is necessarily in- stalled to eliminate their effects. The operational ampli- fier 1 is used to amplify those interfering signals. When the input signal is small (< 10 mV), the potentiometer in amplifier will let the Schmidt flip-flop to output a up lever which can then let the A/D converter and the counter to output null. In such case, even the small inter- fering signal exists, the value shown on the flux and breath frequency display will be null. When normal breath signals input (> 10 mV), they will be sent to the amplifier 2 after buffering. Then the signals will be sent to the A/D converter to detect the flux and to the counter to calculate the breath frequency. The interfering signals, including doctors and nurses’ walking, will be sent to amplifier 1 and then fed to the control circuit of interfering signals. After being digi- tized, the characteristics of those signals will be stored in storage systems. Some possible interfering waveforms can also be prestored. When the system works, the input signal will be compared with those already stored ones. If they have the same characteristics, the control circuit will send another signal to stop the breath flux and fre- quency circuits working. Sometimes the offset variation and drift might lead to the whole system breakdown, especially when the monitoring system has worked in a long time (usually more then 10 hours). So the auto adjusting circuit should be installed to maintain the offset voltage constant. The operational amplifier 1 is used to amplify the interfering signal and the offset voltage drift signal. The period of breath signal is usually less than 6 s, whereas the time duration, in which the offset voltage changes obviously, is always more than 60 s. In such case, an offset voltage timing circuit can be introduced to monitor the signal’s duration. Because the duration of input signal is always more than 60 s, the offset voltage timing circuit can send another signal to the auto zeroing control switch and output the compensating offset voltage from the auto zeroing voltage sampling circuit to the operational am- plifier 2 to eliminate the effects caused by the offset vol- tage drift. 4. CONCLUSIONS The 125 µm-breath sensor, made of n-type Si: Au ma- terial, not only has a high sensitivity (LV sec/4) and short time constant (38 ms), but also its fabrication tech- nology is simpler than others [6,7]. So, it can be widely applied. The experiment indicates that its signal processing cir- cuit can eliminate the voltage drift and other interfering signals. The whole circuit can work stably to process all breath signals. Therefore, patient’s breath rate can be monitored at a distance. If continuing to reduce the size of electric bridge arms and improve the thermal insula- tion between the electric bridge and substrate, it is pos- sible to make the time response even faster. 5. ACKNOWLEDGEMENTS We would like to express our thanks to Dr H. J. Ma at the Institute of Heavy Ion Physics of Peking University for his assistance and discus- sion on the experiments and Ms jing Liang for her typesetting. This work was supported by Basic Research Project of High Education (ZXH2009C004) and Foundation of CAUC (09QD 06X). REFERENCES [1] Liang, J.C., Jiang, J. and Zhao, J. (1996) Studies on 0.96 and 0.84 eV photoluminescence emission in GaAs epi- layers grown on Si. Journal of Applied Physics, 79, 7173-7176. [2] Li, X. (1999) Ultra large scale integration technology. Beijing Publish House of Electronics Industry, Beijing. [3] Li, X., Liang, J.C. and Li, M. (2003) Anomalous resis- tance effect of Si containing deep impurities and its ap- plication to sensor. Proceeding of Conference on Semi- conductor Devices, Montreal, 2003, 39-42. [4] Van Putten, A.F.P. (1983) An integrated silicon double bridge anemometer. Proceeding of Conference on Solid- State Sensors and Actuators, Delft University of Tech- nology, 1983, 5-6. [5] Kapoor, A.K. and Henderson, H.T. (1980) A new planar injection-gated bulk switching system based on deep im- purity trapping. IEEE Transactions Electronic Devices, 27, 1256-1274. [6] Li, Q., Hein, S. and Obermeier, E. (1996) Macro-gas- flow-sensor with integrated heat sink and flow guide. Sensors and Actuators, 54, 547-551. [7] Jonsson, A., Hok, B. and Ekstron, M. (2009) Develop- ment of a breath alcohol analyzer for use on patients in emergency care. International Federation for Medical and Biological Engineering Proceedings, 25(11), 84-87. |